
PUBLISHER: Global Market Insights Inc. | PRODUCT CODE: 2019206

PUBLISHER: Global Market Insights Inc. | PRODUCT CODE: 2019206
Cenospheres Market Opportunity, Growth Drivers, Industry Trend Analysis, and Forecast 2026 - 2035
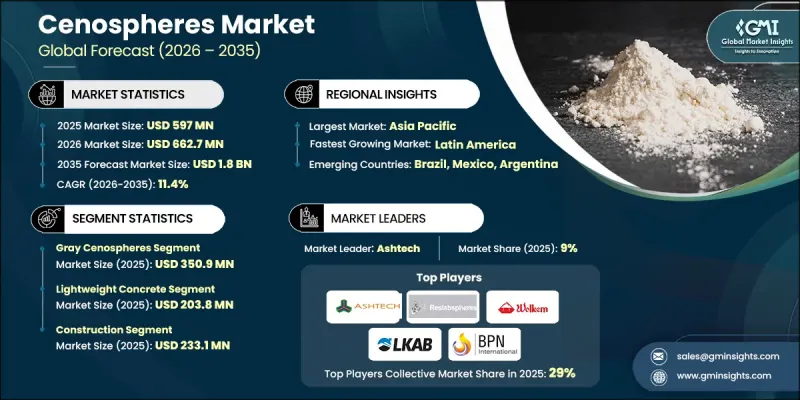
The Global Cenospheres Market was valued at USD 597 million in 2025 and is estimated to grow at a CAGR of 11.4% to reach USD 1.8 billion by 2035.
Cenospheres are primarily composed of silica and alumina, offering low weight, high strength, thermal resistance, and chemical inertness. These characteristics make them ideal as functional fillers across multiple industries, improving mechanical properties while minimizing material consumption. Technological advancements in extraction and processing, such as enhanced wet gravity techniques combined with magnetic separation, have increased purity, recovery rates, and cost efficiency. As a result, cenospheres are increasingly incorporated in lightweight concrete, engineered composites, insulation systems, and industrial fluids, meeting the rising demand for high-performance, energy-efficient, and sustainable materials. Manufacturers now focus on optimizing particle size, surface treatment, and dispersion to maximize structural and operational benefits across applications.
| Market Scope | |
|---|---|
| Start Year | 2025 |
| Forecast Year | 2026-2035 |
| Start Value | $597 Million |
| Forecast Value | $1.8 Billion |
| CAGR | 11.4% |
The gray cenospheres segment reached USD 350.9 million in 2025, due to their use in heavy-duty applications requiring cost efficiency and mechanical strength. Optimized particle size and surface treatments ensure superior dispersion for cementitious materials, mortars, refractories, and drilling fluids, supporting durability while maintaining lightweight characteristics.
The lightweight concrete applications segment captured USD 203.8 million in 2025, as the hollow structure of cenospheres reduces material weight while improving workability, thermal efficiency, and strength. Industries increasingly rely on cenospheres as stable, uniform fillers for energy-efficient, high-performance construction, insulation, and composite solutions.
North America Cenospheres Market is expected to reach USD 494.8 million in 2035. Demand is driven by the adoption of lightweight, durable, and cost-effective materials across construction, energy, and industrial manufacturing sectors. The region emphasizes sustainable building materials, advanced insulation, and engineered composites that reduce weight without compromising long-term performance, fueling continued market expansion.
Prominent companies in the Global Cenospheres Industry include Ashtech, BPN International, LKAB Minerals, Frilite, Microspheres South Africa, Reslab Microfiller, and N.K.Coatchem, China Beihai Fiberglass, Kulin Corporation, Wolkem, and Xingtai Kehui Trading. Companies in the cenospheres market adopt several strategies to strengthen their position and expand market share. They focus on enhancing production processes to improve purity, consistency, and yield while reducing energy consumption and costs. Strategic partnerships with construction, energy, and composite manufacturers allow integration of cenospheres into high-value applications. Firms invest in R&D to develop optimized particle sizes, surface treatments, and advanced dispersions tailored to diverse industrial needs. Expanding regional footprints and distribution networks ensures access to emerging markets with growing demand for lightweight, high-performance materials. Additionally, companies emphasize sustainability by offering eco-friendly, energy-efficient, and low-emission cenospheres, enhancing brand reputation and securing long-term contracts in industrial and construction sectors.
Table of Contents
Chapter 1 Methodology & Scope
- 1.1 Market scope and definition
- 1.2 Research design
- 1.2.1 Research approach
- 1.2.2 Data collection methods
- 1.3 Data mining sources
- 1.3.1 Global
- 1.3.2 Regional/Country
- 1.4 Base estimates and calculations
- 1.4.1 Base year calculation
- 1.4.2 Key trends for market estimation
- 1.5 Primary research and validation
- 1.5.1 Primary sources
- 1.6 Forecast model
- 1.7 Research assumptions and limitations
Chapter 2 Executive Summary
- 2.1 Industry 360° synopsis
- 2.2 Key market trends
- 2.2.1 Source
- 2.2.2 Type
- 2.2.3 Application
- 2.2.4 End Use Industry
- 2.2.5 Regional
- 2.3 TAM Analysis, 2026-2035
- 2.4 CXO perspectives: Strategic imperatives
- 2.5 Future outlook and strategic recommendations
Chapter 3 Industry Insights
- 3.1 Industry ecosystem analysis
- 3.1.1 Supplier landscape
- 3.1.2 Profit margin
- 3.1.3 Value addition at each stage
- 3.1.4 Factor affecting the value chain
- 3.1.5 Disruptions
- 3.2 Industry impact forces
- 3.2.1 Growth drivers
- 3.2.1.1 Rising demand for lightweight materials
- 3.2.1.2 Expanding use in composites and polymers
- 3.2.1.3 Increasing focus on sustainability and circular utilization
- 3.2.2 Industry pitfalls and challenges
- 3.2.2.1 Limited and inconsistent raw material supply
- 3.2.2.2 High processing and extraction challenges
- 3.2.3 Market opportunities
- 3.2.3.1 Growth in advanced manufacturing and additive technologies
- 3.2.3.2 Emerging applications in construction and infrastructure
- 3.2.3.3 Increasing adoption in oil & gas and energy sectors
- 3.2.1 Growth drivers
- 3.3 Growth potential analysis
- 3.4 Regulatory landscape
- 3.4.1 North America
- 3.4.2 Europe
- 3.4.3 Asia Pacific
- 3.4.4 Latin America
- 3.4.5 Middle East & Africa
- 3.5 Porter's analysis
- 3.6 PESTEL analysis
- 3.7 Technology and innovation landscape
- 3.7.1 Current technological trends
- 3.7.2 Emerging technologies
- 3.8 Price trends
- 3.8.1 By region
- 3.8.2 By type
- 3.9 Future market trends
- 3.10 Patent landscape
- 3.11 Trade statistics (HS code)
- 3.11.1 Major importing countries
- 3.11.2 Major exporting countries
- 3.12 Sustainability and environmental aspects
- 3.12.1 Sustainable practices
- 3.12.2 Waste reduction strategies
- 3.12.3 Energy efficiency in production
- 3.12.4 Eco-friendly initiatives
- 3.13 Carbon footprint consideration
Chapter 4 Competitive Landscape, 2025
- 4.1 Introduction
- 4.2 Company market share analysis
- 4.2.1 By region
- 4.2.1.1 North America
- 4.2.1.2 Europe
- 4.2.1.3 Asia Pacific
- 4.2.1.4 LATAM
- 4.2.1.5 MEA
- 4.2.1 By region
- 4.3 Company matrix analysis
- 4.4 Competitive analysis of major market players
- 4.5 Competitive positioning matrix
- 4.6 Key developments
- 4.6.1 Mergers & acquisitions
- 4.6.2 Partnerships & collaborations
- 4.6.3 New product launches
- 4.6.4 Expansion plans
Chapter 5 Market Estimates and Forecast, By Type, 2022-2035 (USD Million) (Kilo Tons)
- 5.1 Key trends
- 5.2 Gray cenospheres
- 5.3 White cenospheres
Chapter 6 Market Estimates and Forecast, By Application, 2022-2035 (USD Million) (Kilo Tons)
- 6.1 Key trends
- 6.2 Lightweight concrete
- 6.3 Thermal insulation materials
- 6.4 Drilling mud additives
- 6.5 Composite reinforcements
- 6.6 Others
Chapter 7 Market Estimates and Forecast, By End Use Industry, 2022-2035 (USD Million) (Kilo Tons)
- 7.1 Key trends
- 7.2 Construction
- 7.3 Oil & gas
- 7.4 Automotive
- 7.5 Aerospace
- 7.6 Paints & coatings
- 7.7 Others
Chapter 8 Market Estimates and Forecast, By Region, 2022-2035 (USD Million) (Kilo Tons)
- 8.1 Key trends
- 8.2 North America
- 8.2.1 U.S.
- 8.2.2 Canada
- 8.3 Europe
- 8.3.1 Germany
- 8.3.2 UK
- 8.3.3 France
- 8.3.4 Spain
- 8.3.5 Italy
- 8.3.6 Rest of Europe
- 8.4 Asia Pacific
- 8.4.1 China
- 8.4.2 India
- 8.4.3 Japan
- 8.4.4 Australia
- 8.4.5 South Korea
- 8.4.6 Rest of Asia Pacific
- 8.5 Latin America
- 8.5.1 Brazil
- 8.5.2 Mexico
- 8.5.3 Argentina
- 8.5.4 Rest of Latin America
- 8.6 Middle East and Africa
- 8.6.1 Saudi Arabia
- 8.6.2 South Africa
- 8.6.3 UAE
- 8.6.4 Rest of Middle East and Africa
Chapter 9 Company Profiles
- 9.1 Ashtech
- 9.2 BPN International
- 9.3 China Beihai Fiberglass
- 9.4 Frilite
- 9.5 Kulin Corporation
- 9.6 LKAB Minerals
- 9.7 Microspheres South Africa
- 9.8 N.K.Coatchem
- 9.9 Reslab Microfiller
- 9.10 Wolkem
- 9.11 Xingtai Kehui Trading

