
PUBLISHER: Global Market Insights Inc. | PRODUCT CODE: 2027596

PUBLISHER: Global Market Insights Inc. | PRODUCT CODE: 2027596
Agricultural Micronutrients Market Opportunity, Growth Drivers, Industry Trend Analysis, and Forecast 2026 - 2035
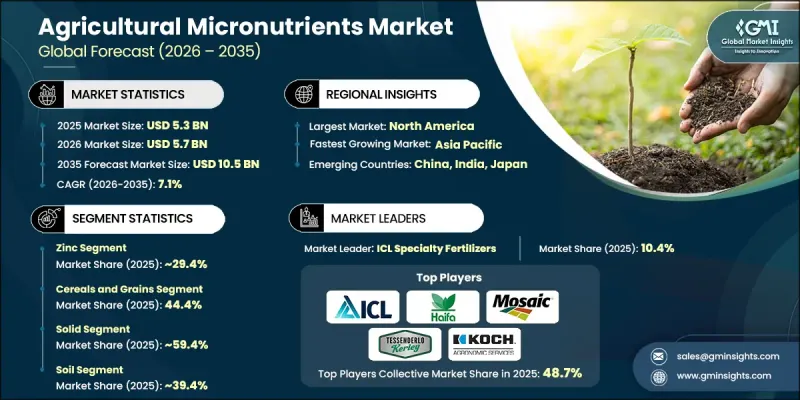
The Global Agricultural Micronutrients Market was valued at USD 5.3 billion in 2025 and is estimated to grow at a CAGR of 7.1% to reach USD 10.5 billion by 2035.
The market is witnessing expansion as global agriculture intensifies its focus on improving crop productivity and soil health. Agricultural micronutrients such as zinc, iron, manganese, boron, copper, molybdenum, and nickel play a crucial role in supporting plant growth in extremely small quantities, yet they significantly influence crop development, resistance to stress, and yield performance. Rising awareness among farmers regarding soil nutrient deficiencies is encouraging wider adoption of micronutrient-based fertilizers. Emerging economies, particularly in regions facing widespread soil depletion, are showing strong uptake of these inputs. The shift toward sustainable and organic farming practices is further boosting demand as growers aim to improve soil fertility using environmentally responsible methods. Continuous advancements in nutrient formulation technologies, including chelated products with enhanced bioavailability, are improving efficiency and crop response. These micronutrients also support essential physiological functions such as enzyme activation, photosynthesis, and nutrient absorption, helping improve crop resilience against environmental stressors like drought and salinity while enhancing overall agricultural output and quality.
| Market Scope | |
|---|---|
| Start Year | 2025 |
| Forecast Year | 2026-2035 |
| Start Value | $5.3 Billion |
| Forecast Value | $10.5 Billion |
| CAGR | 7.1% |
The cereals and grains segment accounted for 44.4% share in 2025 and is expected to grow at a CAGR of 6.7% through 2035. Their dominance is attributed to their status as staple food crops, where micronutrient application is essential to improve yield stability and crop resilience. Increasing adoption in grain cultivation is enhancing productivity and supporting food security objectives globally.
The solid form segment held a 59.4% share in 2025 and is projected to grow at a CAGR of 6.8% during 2026-2035. Despite the growing shift toward liquid formulations, solid micronutrients continue to be widely used due to their longer shelf life, ease of storage, and suitability for soil-based applications. However, liquid formulations are gaining traction due to faster absorption rates and compatibility with modern nutrient delivery systems such as fertigation and foliar application.
North America Agricultural Micronutrients Market accounted for 34.9% of the global share in 2025. Growth in the region is supported by advanced farming practices and strong adoption of precision agriculture technologies. Increasing focus on sustainable nutrient management and environmental efficiency is further driving demand. The United States and Canada are leading adopters of chelated and liquid micronutrient solutions, particularly for high-value and specialty crops, while growing interest in organic farming practices is reinforcing the shift toward eco-friendly agricultural inputs.
Key companies operating in the Global Agricultural Micronutrients Market include Haifa Group, The Mosaic Company, Koch Agronomic Services, ICL Specialty Fertilizers, Helena Agri-Enterprises, Tessenderlo Kerley, Brandt Consolidated, Miller Chemical, AgroLiquid, NACHURS Alpine Solutions, SAN Agrow, Agricen, Atlantica Agricola, Micromix Plant Health, and WUXAL. Companies in the Global Agricultural Micronutrients Market are strengthening their competitive position through innovation in formulation technologies and expansion of product portfolios. Significant investments are being directed toward developing chelated and highly bioavailable micronutrient solutions that improve crop efficiency and soil absorption. Strategic collaborations with distributors and agricultural service providers are enhancing market penetration. Firms are also focusing on expanding production capacities to meet rising global demand. Increasing emphasis on sustainable agriculture is driving companies to develop eco-friendly and organic-compatible products. Additionally, businesses are leveraging digital agriculture platforms and agronomic advisory services to improve farmer engagement and promote precision nutrient application practices, thereby enhancing long-term customer loyalty and market presence.
Table of Contents
Chapter 1 Methodology & Scope
- 1.1 Market scope and definition
- 1.2 Research design
- 1.2.1 Research approach
- 1.2.2 Data collection methods
- 1.3 Data mining sources
- 1.3.1 Global
- 1.3.2 Regional/Country
- 1.4 Base estimates and calculations
- 1.4.1 Base year calculation
- 1.4.2 Key trends for market estimation
- 1.5 Primary research and validation
- 1.5.1 Primary sources
- 1.6 Forecast model
- 1.7 Research assumptions and limitations
Chapter 2 Executive Summary
- 2.1 Industry 360° synopsis
- 2.2 Key market trends
- 2.2.1 Regional
- 2.2.2 Type
- 2.2.3 Crop type
- 2.2.4 Form
- 2.2.5 Application
- 2.2.6 End user
- 2.3 TAM Analysis, 2026-2035
- 2.4 CXO perspectives: Strategic imperatives
- 2.4.1 Executive decision points
Chapter 3 Industry Insights
- 3.1 Industry ecosystem analysis
- 3.1.1 Supplier landscape
- 3.1.2 Profit margin
- 3.1.3 Value addition at each stage
- 3.1.4 Factor affecting the value chain
- 3.1.5 Disruptions
- 3.2 Industry impact forces
- 3.2.1 Growth drivers
- 3.2.2 Industry pitfalls and challenges
- 3.2.3 Market opportunities
- 3.3 Growth potential analysis
- 3.4 Regulatory landscape
- 3.4.1 North America
- 3.4.2 Europe
- 3.4.3 Asia Pacific
- 3.4.4 Latin America
- 3.4.5 Middle East & Africa
- 3.5 Porter's analysis
- 3.6 PESTEL analysis
- 3.7 Price trends
- 3.7.1 By region
- 3.7.2 By type
- 3.8 Future market trends
- 3.9 Technology and Innovation landscape
- 3.9.1 Current technological trends
- 3.9.2 Emerging technologies
- 3.10 Patent Landscape
- 3.11 Trade statistics (HS code)
- 3.11.1 Major importing countries
- 3.11.2 Major exporting countries
- 3.12 Sustainability and environmental aspects
- 3.12.1 Sustainable practices
- 3.12.2 Waste reduction strategies
- 3.12.3 Energy efficiency in production
- 3.12.4 Eco-friendly initiatives
- 3.13 Carbon footprint consideration
Chapter 4 Competitive Landscape, 2025
- 4.1 Introduction
- 4.2 Company market share analysis
- 4.2.1 By region
- 4.2.1.1 North America
- 4.2.1.2 Europe
- 4.2.1.3 Asia Pacific
- 4.2.1.4 LATAM
- 4.2.1.5 MEA
- 4.2.1 By region
- 4.3 Company matrix analysis
- 4.4 Competitive analysis of major market players
- 4.5 Competitive positioning matrix
- 4.6 Key developments
- 4.6.1 Mergers & acquisitions
- 4.6.2 Partnerships & collaborations
- 4.6.3 New Product Launches
- 4.6.4 Expansion Plans
Chapter 5 Market Estimates and Forecast, By Type, 2022-2035 (USD Billion) (Kilo Tons)
- 5.1 Key trends
- 5.2 Zinc
- 5.3 Boron
- 5.4 Manganese
- 5.5 Iron
- 5.6 Molybdenum
- 5.7 Copper
- 5.8 Others
Chapter 6 Market Estimates and Forecast, By Crop Type, 2022-2035 (USD Billion) (Kilo Tons)
- 6.1 Key trends
- 6.2 Cereals and grains
- 6.3 Oilseeds and pulses
- 6.4 Fruits and vegetables
- 6.5 Others
Chapter 7 Market Estimates and Forecast, By Form, 2022-2035 (USD Billion) (Kilo Tons)
- 7.1 Key trends
- 7.2 Solid
- 7.3 Liquid
Chapter 8 Market Estimates and Forecast, By Application, 2022-2035 (USD Billion) (Kilo Tons)
- 8.1 Key trends
- 8.2 Soil
- 8.3 Foliar
- 8.4 Fertigation
Chapter 9 Market Estimates and Forecast, By End User, 2022-2035 (USD Billion) (Kilo Tons)
- 9.1 Key trends
- 9.2 Commercial farms/large-scale agriculture
- 9.3 Small & medium farms
- 9.4 Greenhouse & controlled environment agriculture
- 9.5 Turf & ornamentals
- 9.6 Others
Chapter 10 Market Estimates and Forecast, By Region, 2022-2035 (USD Billion) (Kilo Tons)
- 10.1 Key trends
- 10.2 North America
- 10.2.1 U.S.
- 10.2.2 Canada
- 10.3 Europe
- 10.3.1 Germany
- 10.3.2 UK
- 10.3.3 France
- 10.3.4 Spain
- 10.3.5 Italy
- 10.3.6 Rest of Europe
- 10.4 Asia Pacific
- 10.4.1 China
- 10.4.2 India
- 10.4.3 Japan
- 10.4.4 Australia
- 10.4.5 South Korea
- 10.4.6 Rest of Asia Pacific
- 10.5 Latin America
- 10.5.1 Brazil
- 10.5.2 Mexico
- 10.5.3 Argentina
- 10.5.4 Rest of Latin America
- 10.6 Middle East and Africa
- 10.6.1 Saudi Arabia
- 10.6.2 South Africa
- 10.6.3 UAE
- 10.6.4 Rest of Middle East and Africa
Chapter 11 Company Profiles
- 11.1 Agricen
- 11.2 AgroLiquid
- 11.3 Atlantica Agricola
- 11.4 Brandt Consolidated
- 11.5 Haifa Group
- 11.6 Helena Agri-Enterprises
- 11.7 ICL Specialty Fertilizers
- 11.8 Koch Agronomic Services
- 11.9 Micromix Plant Health
- 11.10 Miller Chemical
- 11.11 NACHURS Alpine Solutions
- 11.12 SAN Agrow
- 11.13 Tessenderlo Kerley
- 11.14 The Mosaic Company
- 11.15 WUXAL

