
PUBLISHER: Global Market Insights Inc. | PRODUCT CODE: 2027602

PUBLISHER: Global Market Insights Inc. | PRODUCT CODE: 2027602
Holographic Display Market Opportunity, Growth Drivers, Industry Trend Analysis, and Forecast 2026 - 2035
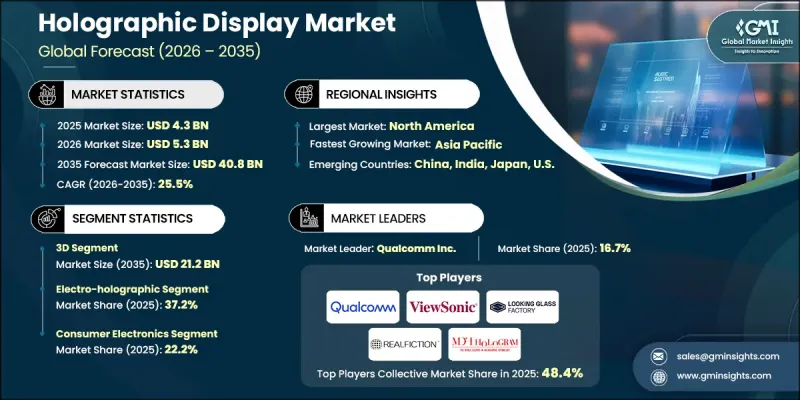
The Global Holographic Display Market was valued at USD 4.3 billion in 2025 and is estimated to grow at a CAGR of 25.5% to reach USD 40.8 billion by 2035.
Market growth is driven by the rising demand for advanced 3D visualization technologies across entertainment, healthcare, automotive, education, and other interactive application areas. The increasing shift toward highly immersive digital experiences is accelerating the adoption of holographic display solutions. Continuous advancements in immersive imaging technologies are further supporting market expansion by improving visual clarity, depth perception, and real-time interaction capabilities. The growing preference for engaging and interactive content delivery is encouraging industries to integrate holographic systems into their operational and consumer-facing platforms. At the same time, rising investments in next-generation display technologies, including projection systems and interactive visualization platforms, are broadening the scope of applications across multiple sectors. The convergence of artificial intelligence with holographic rendering and real-time content adaptation is also enhancing user engagement and personalization. As industries increasingly prioritize experiential technologies, holographic displays are emerging as a key component in transforming digital interaction and visualization ecosystems.
| Market Scope | |
|---|---|
| Start Year | 2025 |
| Forecast Year | 2026-2035 |
| Start Value | $4.3 Billion |
| Forecast Value | $40.8 Billion |
| CAGR | 25.5% |
The 3D segment is projected to reach USD 21.2 billion by 2035, reflecting strong demand for immersive visualization technologies. Industries such as retail, entertainment, and healthcare are increasingly adopting 3D holographic solutions to deliver interactive and engaging user experiences. These displays enable users to view, manipulate, and interact with digital content from multiple angles, significantly enhancing perception and engagement. The rising preference for realistic and immersive digital environments is further accelerating the adoption of 3D holographic technologies across various end-use applications.
The consumer electronics segment accounted for 22.2% share in 2025. Growth in this segment is being driven by the increasing integration of advanced display technologies into everyday electronic devices. Manufacturers are incorporating holographic capabilities into a range of products to enhance visual interaction and user engagement. As technological innovation continues to advance, the adoption of holographic displays in consumer electronics is expected to expand further, driven by demand for more immersive and intuitive user interfaces.
North America Holographic Display Market held a 36.3% share in 2025, supported by strong adoption across healthcare and automotive sectors. The region is witnessing increased utilization of advanced visualization technologies in medical imaging applications and in-vehicle display systems. Growing demand for enhanced diagnostic accuracy and improved driving experiences is contributing to the integration of holographic solutions. Continuous technological advancements and strong investment in research and development are further reinforcing the region's leadership in the global market.
Key companies operating in the Global Holographic Display Market include Qualcomm Inc., ViewSonic Corporation, Provision Holding Inc., MDH Hologram Ltd., Realview Imaging Ltd., RealFiction (Realfiction Holding AB), EON Reality Inc., and Holoxica Ltd. Companies in the Holographic Display Market are strengthening their market position through continuous innovation, strategic collaborations, and expansion into emerging application areas. They are investing heavily in research and development to improve display resolution, depth accuracy, and real-time rendering capabilities. Partnerships with technology providers and end-use industries are helping accelerate commercialization and broaden application scope. Many players are focusing on integrating artificial intelligence and augmented reality features to enhance interactivity and user experience. Additionally, companies are expanding their production capabilities and global distribution networks to meet rising demand. Emphasis on cost optimization, product differentiation, and customized solutions is further enabling firms to strengthen competitiveness and capture new growth opportunities across diverse industry verticals.
Table of Contents
Chapter 1 Methodology and Scope
- 1.1 Market scope and definition
- 1.2 Research design
- 1.2.1 Research approach
- 1.2.2 Data collection methods
- 1.3 Data mining sources
- 1.3.1 Global
- 1.3.2 Regional/Country
- 1.4 Base estimates and calculations
- 1.4.1 Base year calculation
- 1.4.2 Key trends for market estimation
- 1.5 Primary research and validation
- 1.5.1 Primary sources
- 1.6 Forecast model
- 1.7 Research assumptions and limitations
Chapter 2 Executive Summary
- 2.1 Industry 360° synopsis, 2022 - 2035
- 2.2 Key market trends
- 2.2.1 Technology trends
- 2.2.2 Dimension trends
- 2.2.3 Application trends
- 2.2.4 Regional trends
- 2.3 TAM Analysis, 2026-2035
- 2.4 CXO perspectives: Strategic imperatives
Chapter 3 Industry Insights
- 3.1 Industry ecosystem analysis
- 3.1.1 Supplier Landscape
- 3.1.2 Profit Margin
- 3.1.3 Cost structure
- 3.1.4 Value addition at each stage
- 3.1.5 Factor affecting the value chain
- 3.1.6 Disruptions
- 3.2 Industry impact forces
- 3.2.1 Growth drivers
- 3.2.1.1 Rising demand for 3D holographic displays
- 3.2.1.2 Increasing adoption in augmented reality (AR) and virtual reality (VR)
- 3.2.1.3 Growing adoption in healthcare for medical imaging
- 3.2.1.4 Growing popularity of holographic displays in gaming and entertainment
- 3.2.1.5 Rising adoption of holographic displays in digital signage and retail
- 3.2.2 Industry pitfalls and challenges
- 3.2.2.1 High production and implementation costs
- 3.2.2.2 Limited content and software compatibility
- 3.2.3 Market opportunities
- 3.2.3.1 Increasing use in events, entertainment, and live performances
- 3.2.3.2 Deployment in smart cities and public infrastructure
- 3.2.1 Growth drivers
- 3.3 Growth potential analysis
- 3.4 Regulatory landscape
- 3.4.1 North America
- 3.4.2 Europe
- 3.4.3 Asia Pacific
- 3.4.4 Latin America
- 3.4.5 Middle East & Africa
- 3.5 Porter's analysis
- 3.6 PESTEL analysis
- 3.7 Technology and Innovation landscape
- 3.7.1 Current technological trends
- 3.7.2 Emerging technologies
- 3.8 Emerging Business Models
- 3.9 Compliance Requirements
Chapter 4 Competitive Landscape, 2025
- 4.1 Introduction
- 4.2 Company market share analysis
- 4.2.1 By region
- 4.2.1.1 North America
- 4.2.1.2 Europe
- 4.2.1.3 Asia Pacific
- 4.2.1.4 Latin America
- 4.2.1.5 Middle East & Africa
- 4.2.2 Market concentration analysis
- 4.2.1 By region
- 4.3 Competitive benchmarking of key players
- 4.3.1 Financial performance comparison
- 4.3.1.1 Revenue
- 4.3.1.2 Profit margin
- 4.3.1.3 R&D
- 4.3.2 Product portfolio comparison
- 4.3.2.1 Product range breadth
- 4.3.2.2 Technology
- 4.3.2.3 Innovation
- 4.3.3 Geographic presence comparison
- 4.3.3.1 Global footprint analysis
- 4.3.3.2 Service network coverage
- 4.3.3.3 Market penetration by region
- 4.3.4 Competitive positioning matrix
- 4.3.4.1 Leaders
- 4.3.4.2 Challengers
- 4.3.4.3 Followers
- 4.3.4.4 Niche players
- 4.3.5 Strategic outlook matrix
- 4.3.1 Financial performance comparison
- 4.4 Key developments
- 4.4.1 Mergers and acquisitions
- 4.4.2 Partnerships and collaborations
- 4.4.3 Technological advancements
- 4.4.4 Expansion and investment strategies
- 4.4.5 Digital transformation initiatives
- 4.5 Emerging/ startup competitors landscape
Chapter 5 Market Estimates and Forecast, By Technology, 2022 - 2035 (USD Million)
- 5.1 Key trends
- 5.2 Electro-holographic
- 5.3 Touchable
- 5.4 Laser
- 5.4.1 Gas laser-based
- 5.4.2 Solid-state laser-based
- 5.4.3 Diode laser-based
- 5.5 Piston
Chapter 6 Market Estimates and Forecast, By Dimension, 2022 - 2035 (USD Million)
- 6.1 Key trends
- 6.2 2D holographic displays
- 6.3 3D holographic displays
- 6.4 4D holographic displays
Chapter 7 Market Estimates and Forecast, By Application, 2022 - 2035 (USD Million)
- 7.1 Key trends
- 7.2 Automotive head-up displays
- 7.2.1 Passenger vehicles
- 7.2.2 Light commercial vehicles
- 7.2.3 Heavy commercial vehicles
- 7.3 Medical imaging
- 7.3.1 Surgical imaging & guidance
- 7.3.1.1 Neurosurgery
- 7.3.1.2 Orthopedic surgery
- 7.3.1.3 Minimally invasive surgery
- 7.3.2 Diagnostic imaging
- 7.3.2.1 Radiology & CT
- 7.3.2.2 Pathology & microscopy
- 7.3.3 Medical education & training
- 7.3.3.1 Anatomy visualization
- 7.3.3.2 Surgical training simulators
- 7.3.3.3 Others
- 7.3.1 Surgical imaging & guidance
- 7.4 Consumer electronics
- 7.4.1 Smart TVs
- 7.4.2 Laptops & tablets
- 7.4.3 Smartphones & mobile devices
- 7.4.4 Digital cameras & imaging devices
- 7.4.5 Others
- 7.5 Retail & digital signage
- 7.5.1 In-store advertising & product display
- 7.5.2 Outdoor digital signage
- 7.5.3 Interactive retail experiences
- 7.5.4 Others
- 7.6 Aerospace and defense
- 7.6.1 Military HUDs & cockpit displays
- 7.6.2 Training & simulation systems
- 7.6.2.1 Flight simulators
- 7.6.2.2 Tactical training systems
- 7.6.3 Command & control centers
- 7.6.3.1 Situational awareness displays
- 7.6.3.2 Mission planning & briefing
- 7.6.4 Others
- 7.7 AR/VR
- 7.7.1 AR headsets & glasses
- 7.7.2 VR gaming & entertainment
- 7.7.3 Enterprise AR applications
- 7.7.4 Others
- 7.8 Others
Chapter 8 Market Estimates and Forecast, By Region, 2022 - 2035 (USD Million)
- 8.1 Key trends
- 8.2 North America
- 8.2.1 U.S.
- 8.2.2 Canada
- 8.3 Europe
- 8.3.1 Germany
- 8.3.2 UK
- 8.3.3 France
- 8.3.4 Spain
- 8.3.5 Italy
- 8.3.6 Netherlands
- 8.3.7 Rest of Europe
- 8.4 Asia Pacific
- 8.4.1 China
- 8.4.2 India
- 8.4.3 Japan
- 8.4.4 Australia
- 8.4.5 South Korea
- 8.4.6 Rest of Asia Pacific
- 8.5 Latin America
- 8.5.1 Brazil
- 8.5.2 Mexico
- 8.5.3 Argentina
- 8.5.4 Rest of Latin America
- 8.6 Middle East and Africa
- 8.6.1 South Africa
- 8.6.2 Saudi Arabia
- 8.6.3 UAE
- 8.6.4 Rest of MEA
Chapter 9 Company Profiles
- 9.1 Global Key Players
- 9.1.1 Qualcomm Inc.
- 9.1.2 ViewSonic Corporation
- 9.1.3 Provision Holding Inc.
- 9.1.4 MDH Hologram Ltd.
- 9.1.5 Realview Imaging Ltd.
- 9.1.6 RealFiction (Realfiction Holding AB)
- 9.1.7 EON Reality Inc.
- 9.2 Regional key players
- 9.2.1 Konica Minolta, Inc.
- 9.2.2 AV Concepts Inc.
- 9.2.3 Zebra Imaging
- 9.2.4 Looking Glass Factory Inc.
- 9.2.5 SeeReal Technologies S.A.
- 9.2.6 Leia Inc.
- 9.3 Niche Players/Disruptors
- 9.3.1 HOLOCO GmbH
- 9.3.2 Holoconnects
- 9.3.3 HoloTech Switzerland AG
- 9.3.4 HYPERVSN
- 9.3.5 zSpace, Inc.
- 9.3.6 Ovizio Imaging Systems NV/SA

