
PUBLISHER: Global Market Insights Inc. | PRODUCT CODE: 2027637

PUBLISHER: Global Market Insights Inc. | PRODUCT CODE: 2027637
Smart Home Products Market Opportunity, Growth Drivers, Industry Trend Analysis, and Forecast 2026 - 2035
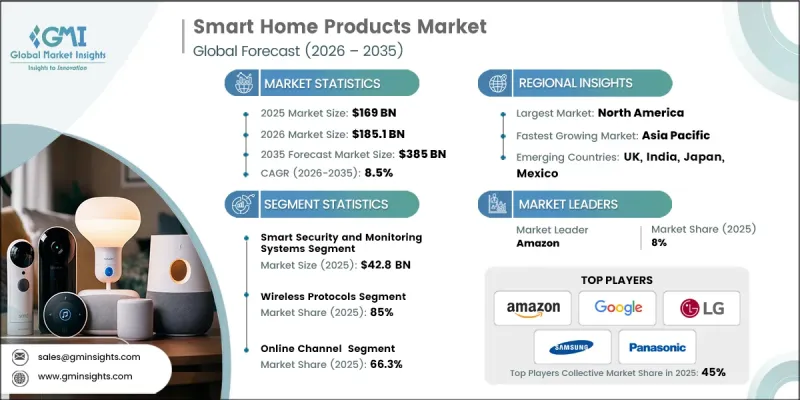
The Global Smart Home Products Market was valued at USD 169 billion in 2025 and is estimated to grow at a CAGR of 8.5% to reach USD 385 billion by 2035.
The market is witnessing strong momentum as consumers increasingly prioritize energy-efficient, connected, and automated home solutions. The integration of renewable energy with smart home systems is emerging as a key driver, enabling sustainable living and reducing reliance on conventional power sources. Innovations in voice recognition, AI, and intelligent device interoperability are transforming how homeowners interact with their living spaces, creating convenience, safety, and energy optimization. Rising awareness of green building standards and smart energy management is further fueling adoption. Smart home technologies now encompass security, lighting, climate control, and health-focused devices, all connected through intuitive platforms that provide seamless control, monitoring, and predictive functionality. The combination of convenience, sustainability, and advanced technology is positioning smart home products as a core part of modern residences globally.
| Market Scope | |
|---|---|
| Start Year | 2025 |
| Forecast Year | 2026-2035 |
| Start Value | $169 Billion |
| Forecast Value | $385 Billion |
| CAGR | 8.5% |
The smart security and monitoring systems segment held a 25.3% share, generating USD 42.8 billion in 2025. These solutions are highly sought after due to growing safety concerns and the expanding adoption of connected IoT devices. Homeowners benefit from real-time alerts, cloud video storage, and remote monitoring capabilities, enabling proactive security management.
The wireless protocols segment held an 85% share, generating USD 143.6 billion in 2025. Popular IoT standards such as Wi-Fi, Zigbee, and Z-Wave have become integral to smart home integration due to their flexibility and ease of use. The development of mobile and cloud applications has further boosted wireless adoption, allowing consumers to control lighting, security systems, and appliances remotely while improving energy efficiency. Wireless solutions also support easy upgrades and interoperability, catering to modern consumer demands for convenience and efficiency.
U.S. Smart Home Products Market held an 84%, generating USD 58.5 billion in 2025. The strong market position is driven by high disposable incomes, evolving consumer preferences, and the presence of key technology innovators. Leading companies based in the U.S., including Amazon, Google, and Ecobee, continue to shape the industry through extensive product portfolios, technological advancements, and setting global standards for connected homes. Their leadership ensures robust market growth and drives further adoption of energy-efficient and smart home solutions.
Key players operating in the Global Smart Home Products Market include Apple, Amazon, Bosch, Dyson, Ecobee, Google, Honeywell, LG, Panasonic, Ring, Samsung, Schneider Electric, Siemens, Sonos, and Xiaomi. Companies in the Smart Home Products Market are strengthening their position through strategic innovation, expanding product portfolios, and investing in advanced technologies such as AI, voice control, and IoT integration. They are forming partnerships to enhance interoperability and cloud connectivity, allowing seamless integration of devices across ecosystems. Many firms are focusing on energy-efficient solutions to align with sustainability trends, while others are emphasizing premium offerings and user-friendly designs to appeal to high-end consumers. Strategic marketing, localized solutions, and investment in research and development are also being used to expand geographic reach and solidify brand credibility, ensuring long-term growth and competitive advantage in the rapidly evolving smart home market.
Table of Contents
Chapter 1 Methodology & Scope
- 1.1 Market scope and definition
- 1.2 Research design
- 1.2.1 Research approach
- 1.2.2 Data collection methods
- 1.3 Data mining sources
- 1.3.1 Global
- 1.3.2 Regional
- 1.4 Base estimates and calculations
- 1.4.1 Base year calculation
- 1.4.2 Key trends for market estimation
- 1.5 Primary research and validation
- 1.5.1 Primary sources
- 1.6 Forecast model
- 1.7 Research assumptions and limitations
Chapter 2 Executive Summary
- 2.1 Industry 360° synopsis
- 2.2 Key market trends
- 2.2.1 Regional
- 2.2.2 Product type
- 2.2.3 Connectivity
- 2.2.4 Price range
- 2.2.5 Installation
- 2.2.6 Distribution channel
Chapter 3 Industry Insights
- 3.1 Industry ecosystem analysis
- 3.1.1 Supplier landscape
- 3.1.2 Profit margin
- 3.1.3 Value addition at each stage
- 3.1.4 Factor affecting the value chain
- 3.2 Industry impact forces
- 3.2.1 Growth drivers
- 3.2.1.1 Rising demand for energy-efficiency
- 3.2.1.2 IoT and wireless connectivity expansion
- 3.2.1.3 Security and safety concerns
- 3.2.2 Industry pitfalls & challenges
- 3.2.2.1 Data privacy and cybersecurity risks
- 3.2.2.2 High initial costs and fragmented ecosystems
- 3.2.3 Opportunities
- 3.2.3.1 Growth in emerging markets
- 3.2.3.2 Integration with wellness and healthcare
- 3.2.1 Growth drivers
- 3.3 Growth potential analysis
- 3.4 Future market trends
- 3.5 Technology and innovation landscape
- 3.5.1 Current technological trends
- 3.5.2 Emerging technologies
- 3.6 Pricing analysis (driven by primary research)
- 3.6.1 Historical price trend analysis (driven by primary research)
- 3.6.2 Pricing strategy by player type (premium / value / cost-plus) (driven by primary research)
- 3.6.3 Price elasticity by product category
- 3.6.4 Regional price variations & purchasing power parity by region
- 3.7 Regulatory landscape
- 3.7.1 Standards and compliance requirements
- 3.7.2 Regional regulatory frameworks
- 3.7.3 Certification standards
- 3.8 Porter's analysis
- 3.9 PESTEL analysis
- 3.10 Consumer behaviour analysis
- 3.10.1 Purchasing patterns
- 3.10.2 Preference analysis
- 3.10.3 Regional variations in consumer behaviour
- 3.10.4 Impact of e-commerce on buying decision
- 3.11 Trade data analysis (driven by paid database)
- 3.11.1 Import/export volume & value trends
- 3.11.2 Key trade corridors & tariff impact
- 3.11.3 Trade policy impact on market dynamics
- 3.12 Impact of AI & generative AI on the market
- 3.12.1 AI-driven disruption of existing business models
- 3.12.2 GenAI use cases & adoption roadmap by segment
- 3.12.3 Risks, limitations & regulatory considerations
- 3.12.4 AI-powered personalization & predictive automation
- 3.13 Distribution infrastructure & channel penetration landscape (driven by primary research)
- 3.13.1 Channel coverage by region & format (modern vs. traditional trade) (driven by primary research)
- 3.13.2 Last-mile infrastructure gaps & emerging channel shifts (driven by primary research)
- 3.13.3 E-commerce platform concentration & market power
Chapter 4 Competitive Landscape, 2025
- 4.1 Introduction
- 4.2 Company market share analysis
- 4.2.1 By region
- 4.2.1.1 North America
- 4.2.1.2 Europe
- 4.2.1.3 Asia Pacific
- 4.2.1.4 Latin America
- 4.2.1.5 Middle East and Africa
- 4.2.1 By region
- 4.3 Company matrix analysis
- 4.4 Competitive analysis of major market players
- 4.5 Competitive positioning matrix
- 4.6 Key developments
- 4.6.1 Mergers & acquisitions
- 4.6.2 Partnerships & collaborations
- 4.6.3 New product launches
- 4.6.4 Expansion plans
Chapter 5 Market Estimates & Forecast, By Product type, 2022-2035 (USD Billion) (Million Units)
- 5.1 Key trends
- 5.2 Smart security & monitoring systems
- 5.2.1 Security cameras
- 5.2.2 Baby monitors
- 5.2.3 Smart door locks
- 5.2.4 Others (smart smoke detectors etc.)
- 5.3 Smart lighting & electrical systems
- 5.3.1 Smart light bulbs
- 5.3.2 Smart light switches
- 5.3.3 Smart light fixtures
- 5.3.4 Others (smart electrical panels etc.)
- 5.4 Smart climate control & HVAC systems
- 5.4.1 Smart thermostats
- 5.4.2 Smart HVAC controllers
- 5.4.3 Smart air purifiers
- 5.4.4 Smart humidifiers & dehumidifiers
- 5.4.5 Others (smart air quality monitors etc.)
- 5.5 Smart entertainment & media systems
- 5.5.1 Smart speakers
- 5.5.2 Smart streaming devices
- 5.5.3 Smart projectors
- 5.5.4 Smart gaming consoles
- 5.5.5 Others (smart VR/AR systems etc.)
- 5.6 Smart kitchen & appliance systems
- 5.6.1 Smart refrigerators
- 5.6.2 Smart ovens & ranges
- 5.6.3 Smart dishwashers
- 5.6.4 Smart coffee makers
- 5.6.5 Others (smart blenders etc.)
- 5.7 Smart laundry & cleaning systems
- 5.7.1 Smart washing machines
- 5.7.2 Smart dryers
- 5.7.3 Smart robotic vacuums
- 5.7.4 Others (smart window cleaners etc.)
- 5.8 Smart outdoor & garden systems
- 5.8.1 Smart sprinkler controllers
- 5.8.2 Smart drip irrigation
- 5.8.3 Smart lawn mowers
- 5.8.4 Others (smart weather stations etc.)
- 5.9 Smart health & wellness system
- 5.9.1 Smart air quality monitors
- 5.9.2 Smart sleep monitors
- 5.9.3 Smart medicine dispensers
- 5.9.4 Others (smart fall detection systems etc.)
- 5.10 Smart energy & utility systems
- 5.10.1 Smart meters
- 5.10.2 Smart solar systems
- 5.10.3 Smart battery storage
- 5.10.4 Others (smart load controllers etc.)
- 5.11 Others (smart connectivity & control systems etc.)
Chapter 6 Market Estimates & Forecast, By Connectivity, 2022-2035 (USD Billion) (Million Units)
- 6.1 Key trends
- 6.2 Wireless protocols
- 6.2.1 ZigBee
- 6.2.2 Wi-Fi
- 6.2.3 Bluetooth
- 6.2.4 Z Wave
- 6.2.5 Others
- 6.3 Wired protocols
- 6.3.1 Ethernet
- 6.3.2 Powerline communication (PLC)
- 6.4 Hybrid.
Chapter 7 Market Estimates & Forecast, By Price, 2022-2035 (USD Billion) (Million Units)
- 7.1 Key trends
- 7.2 Low (below USD 500)
- 7.3 Medium (between USD 500 and USD 1,000)
- 7.4 High (above USD 1,000)
Chapter 8 Market Estimates & Forecast, By Installation, 2022-2035 (USD Billion) (Million Units)
- 8.1 Key trends
- 8.2 New construction
- 8.3 Retrofit
Chapter 9 Market Estimates & Forecast, By Distribution Channel, 2022-2035 (USD Billion) (Million Units)
- 9.1 Key trends
- 9.2 Online
- 9.3 Offline
Chapter 10 Market Estimates & Forecast, By Region, 2022-2035 (USD Billion) (Million Units)
- 10.1 Key trends
- 10.2 North America
- 10.2.1 U.S.
- 10.2.2 Canada
- 10.3 Europe
- 10.3.1 Germany
- 10.3.2 UK
- 10.3.3 France
- 10.3.4 Spain
- 10.3.5 Italy
- 10.4 Asia Pacific
- 10.4.1 China
- 10.4.2 Japan
- 10.4.3 India
- 10.4.4 Australia
- 10.4.5 South Korea
- 10.5 Latin America
- 10.5.1 Brazil
- 10.5.2 Mexico
- 10.5.3 Argentina
- 10.6 Middle East and Africa
- 10.6.1 South Africa
- 10.6.2 Saudi Arabia
- 10.6.3 UAE
Chapter 11 Company Profiles
- 11.1 Amazon
- 11.2 Apple
- 11.3 Bosch
- 11.4 Dyson
- 11.5 Ecobee
- 11.6 Google
- 11.7 Honeywell
- 11.8 LG
- 11.9 Panasonic
- 11.10 Ring
- 11.11 Samsung
- 11.12 Schneider Electric
- 11.13 Siemens
- 11.14 Sonos
- 11.15 Xiaomi

