
PUBLISHER: Global Market Insights Inc. | PRODUCT CODE: 2027645

PUBLISHER: Global Market Insights Inc. | PRODUCT CODE: 2027645
HVAC Valve Market Opportunity, Growth Drivers, Industry Trend Analysis, and Forecast 2026 - 2035
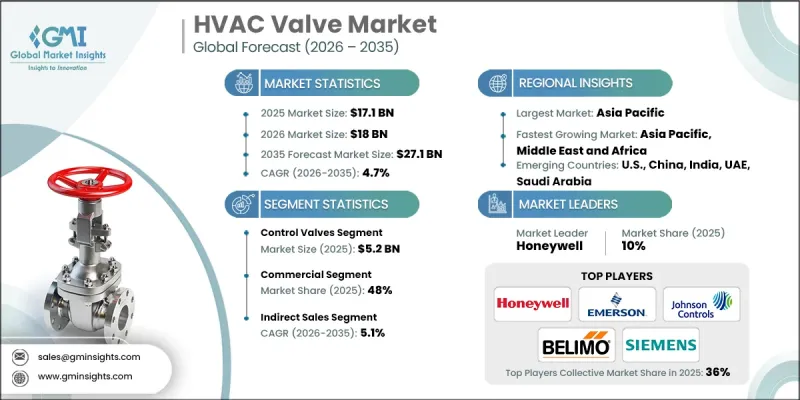
The Global HVAC Valve Market was valued at USD 17.1 billion in 2025 and is estimated to grow at a CAGR of 4.7% to reach USD 27.1 billion by 2035.
The market is expanding due to the rising adoption of energy-efficient HVAC systems and increasing construction activities across residential and commercial sectors. Growing emphasis on reducing energy consumption and emissions has accelerated the demand for advanced HVAC systems, which require high-performance valves. Technological advancements, particularly the integration of IoT and AI in HVAC systems, have also fueled market growth, enabling real-time monitoring and control, which reduces operational costs. Additionally, favorable government policies, incentives, and regulations promoting energy efficiency are encouraging widespread adoption of modern HVAC solutions. The combination of urbanization, rising disposable incomes, and demand for smarter building automation systems is further driving the HVAC valve market forward, positioning it in a strong growth phase over the forecast period.
| Market Scope | |
|---|---|
| Start Year | 2025 |
| Forecast Year | 2026-2035 |
| Start Value | $17.1 Billion |
| Forecast Value | $27.1 Billion |
| CAGR | 4.7% |
In 2025, the control valves segment generated USD 5.2 billion and is projected to grow at a CAGR of 5.2% through 2035. Control valves are critical in modern HVAC systems because they allow precise regulation of temperature and pressure, enhancing overall system performance and energy efficiency.
The commercial segment held a 48% share in 2025 and is expected to grow at a CAGR of 5% from 2026 to 2035. Expansion in commercial spaces, including offices, retail environments, and healthcare facilities, is fueling the demand for energy-efficient HVAC systems. Urbanization, higher disposable income, and technological adoption in smart building systems are driving sustained growth in this segment, while residential demand for advanced HVAC valves continues to rise alongside home automation trends.
United States HVAC Valve Market held an 80% share in 2025, generating USD 3.8 billion. Rapid expansion is driven by demand for energy-saving HVAC systems, advanced building automation technologies, and favorable climate conditions, particularly in southern states. Rapid urbanization and construction growth in states like Texas and Florida are significant contributors to the U.S. market's development. Key players in the HVAC Valve Industry include KITZ Corporation, Flowserve, Schneider Electric, Belimo, Caleffi, Honeywell, Johnson Controls, Oventrop, Siemens Building Technologies, Taco Comfort Solutions, Emerson (Fisher), KSB, Neway Valve, Samson, and Watts Water Technologies. Companies in the HVAC Valve Market are implementing multiple strategies to strengthen their presence and market position. They focus on developing energy-efficient and smart valve solutions that integrate with IoT and AI systems. Expansion of distribution networks, partnerships with HVAC system integrators, and collaborations with construction firms allow broader market access. Investment in R&D for high-performance, low-maintenance, and sustainable valve products helps meet evolving energy efficiency standards. Firms emphasize after-sales services, technical support, and customized solutions to enhance customer satisfaction. Additionally, mergers, acquisitions, and geographic expansion are key strategies used to secure a long-term market foothold and competitiveness.
Table of Contents
Chapter 1 Methodology and scope
- 1.1 Research approach
- 1.2 Quality Commitments
- 1.2.1 GMI AI policy & data integrity commitment
- 1.2.1.1 Source consistency protocol
- 1.2.1 GMI AI policy & data integrity commitment
- 1.3 Research Trail & Confidence Scoring
- 1.3.1 Research Trail Components
- 1.3.2 Scoring Components
- 1.4 Data Collection
- 1.4.1 Partial list of primary sources
- 1.5 Data mining sources
- 1.5.1 Paid sources
- 1.5.1.1 Sources, by region
- 1.5.1 Paid sources
- 1.6 Base estimates and calculations
- 1.6.1 Base year calculation for any one approach
- 1.7 Forecast model
- 1.7.1 Quantified market impact analysis
- 1.7.1.1 Mathematical impact of growth parameters on forecast
- 1.7.1 Quantified market impact analysis
- 1.8 Research transparency addendum
- 1.8.1 Source attribution framework
- 1.8.2 Quality assurance metrics
- 1.8.3 Our commitment to trust
Chapter 2 Executive summary
- 2.1 Industry 360° synopsis
- 2.2 Key market trends
- 2.2.1 Regional trends
- 2.2.2 Valve type trends
- 2.2.3 Operation type trends
- 2.2.4 Application trends
- 2.2.5 End user trends
- 2.2.6 Distribution channel trends
Chapter 3 Industry insights
- 3.1 Industry ecosystem analysis
- 3.1.1 Supplier landscape
- 3.1.2 Profit margin
- 3.1.3 Value addition at each stage
- 3.1.4 Factor affecting the value chain
- 3.2 Industry impact forces
- 3.2.1 Growth drivers
- 3.2.2 Industry pitfalls & challenges
- 3.2.3 Opportunities
- 3.3 Growth potential analysis
- 3.4 Regulatory landscape
- 3.4.1 Energy Efficiency Standards (ASHRAE 90.1, EU ErP Directive)
- 3.4.2 Building Codes & Safety Regulations
- 3.4.3 Environmental Compliance (RoHS, REACH)
- 3.5 Major market trends and disruptions
- 3.6 Technological and innovation landscape
- 3.6.1 Emerging technologies
- 3.7 Pricing analysis (Driven by Primary Research)
- 3.7.1 Historical price trend analysis (Driven by Primary Research)
- 3.7.2 Pricing strategy by player type (Premium / Value / Cost-plus) (Driven by Primary Research)
- 3.8 Trade data analysis (Driven by Paid Data Base)
- 3.8.1 Import/export volume & value trends (Driven by Primary Research)
- 3.8.2 Key trade corridors & tariff impact (Driven by Primary Research)
- 3.9 Impact of AI & generative AI on the market
- 3.9.1 AI-driven disruption of existing business models
- 3.9.2 GenAI use cases & adoption roadmap by segment
- 3.9.3 Risks, limitations & regulatory considerations
- 3.10 Porter's analysis
- 3.11 PESTEL analysis
Chapter 4 Competitive landscape, 2025
- 4.1 Introduction
- 4.2 Company market share analysis
- 4.2.1 North America
- 4.2.2 Europe
- 4.2.3 Asia Pacific
- 4.2.4 Latin America
- 4.2.5 MEA
- 4.3 Company matrix analysis
- 4.4 Competitive analysis of major market players
- 4.5 Competitive positioning matrix
- 4.6 Key developments
- 4.6.1 Mergers & acquisitions
- 4.6.2 Partnerships & collaborations
- 4.6.3 New product launches
- 4.6.4 Expansion plans
Chapter 5 Market Estimates & Forecast, By Valve Type, 2022 - 2035 ($Billion, Thousand Units)
- 5.1 Key trends
- 5.2 Ball valves
- 5.3 Globe valves
- 5.4 Butterfly valves
- 5.5 Check valves
- 5.6 Gate valves
- 5.7 Pressure relief valves
- 5.8 Control valves
- 5.9 Solenoid valves
- 5.10 Others (disc valves etc.)
Chapter 6 Market Estimates & Forecast, By Operation Type, 2022 - 2035 ($Billion, Thousand Units)
- 6.1 Key trends
- 6.2 Manual
- 6.3 Pneumatic
- 6.4 Hydraulic
- 6.5 Electric
- 6.6 Smart/connected
Chapter 7 Market Estimates & Forecast, By Application, 2022 - 2035 ($Billion, Thousand Units)
- 7.1 Key trends
- 7.2 Heating systems
- 7.3 Cooling systems
- 7.4 Ventilation systems
- 7.5 District cooling
- 7.6 Refrigeration
Chapter 8 Market Estimates & Forecast, By End User, 2022 - 2035 ($Billion, Thousand Units)
- 8.1 Key trends
- 8.2 Residential
- 8.3 Commercial
- 8.3.1 Office buildings
- 8.3.2 Retail
- 8.3.3 Hospitality
- 8.3.4 Healthcare
- 8.3.5 Others (educational institute etc.)
- 8.4 Industrial
- 8.4.1 Oil and gas
- 8.4.2 Manufacturing
- 8.4.3 Food and beverages
- 8.4.4 Others (pharmaceuticals etc.)
Chapter 9 Market Estimates & Forecast, By Distribution Channel, 2022 - 2035 ($Billion, Thousand Units)
- 9.1 Key trends
- 9.2 Direct sales
- 9.3 Indirect sales
Chapter 10 Market Estimates & Forecast, By Region, 2022 - 2035 ($Billion, Thousand Units)
- 10.1 Key trends
- 10.2 North America
- 10.2.1 U.S.
- 10.2.2 Canada
- 10.3 Europe
- 10.3.1 Germany
- 10.3.2 UK
- 10.3.3 France
- 10.3.4 Spain
- 10.3.5 Italy
- 10.3.6 Netherlands
- 10.4 Asia Pacific
- 10.4.1 China
- 10.4.2 Japan
- 10.4.3 India
- 10.4.4 Australia
- 10.4.5 South Korea
- 10.5 Latin America
- 10.5.1 Brazil
- 10.5.2 Mexico
- 10.5.3 Argentina
- 10.6 MEA
- 10.6.1 South Africa
- 10.6.2 Saudi Arabia
- 10.6.3 UAE
Chapter 11 Company Profiles
- 11.1 Belimo
- 11.2 Caleffi
- 11.3 Emerson (Fisher)
- 11.4 Flowserve
- 11.5 Honeywell
- 11.6 Johnson Controls
- 11.7 KITZ Corporation
- 11.8 KSB
- 11.9 Neway Valve
- 11.10 Oventrop
- 11.11 Samson
- 11.12 Schneider Electric
- 11.13 Siemens Building Technologies
- 11.14 Taco Comfort Solutions
- 11.15 Watts Water Technologies

