
PUBLISHER: Global Market Insights Inc. | PRODUCT CODE: 2038289

PUBLISHER: Global Market Insights Inc. | PRODUCT CODE: 2038289
North America Pressure Control Equipment Market Opportunity, Growth Drivers, Industry Trend Analysis, and Forecast 2026 - 2035
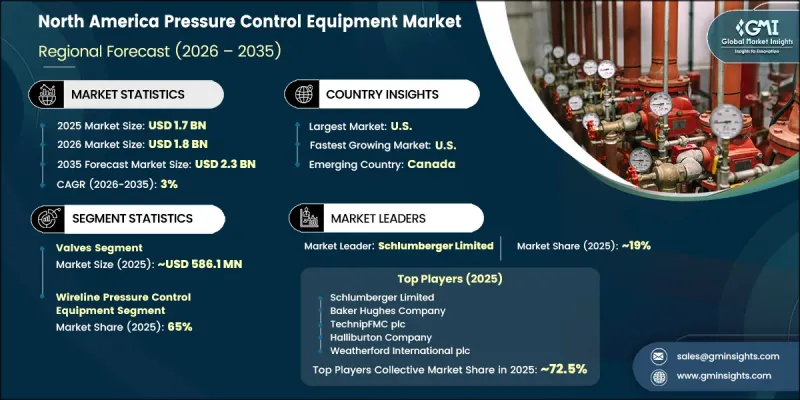
North America Pressure Control Equipment Market was valued at USD 1.7 billion in 2025 and is estimated to grow at a CAGR of 3% to reach USD 2.3 billion by 2035.
Market growth is closely linked to expanding oil and gas exploration activities across shale and offshore regions, where continuous drilling operations require highly reliable pressure management systems to maintain operational safety. Increasing shale development activity in the U.S. has significantly elevated demand for blowout preventers, valve systems, and manifold assemblies. Operators are placing strong emphasis on equipment that ensures well control, reduces operational risks, and supports safe drilling and production activities under high-pressure conditions. Rising investment in exploration projects is further supporting the procurement of advanced, high-performance pressure control solutions across the region.
| Market Scope | |
|---|---|
| Start Year | 2025 |
| Forecast Year | 2026-2035 |
| Start Value | $1.7 Billion |
| Forecast Value | $2.3 Billion |
| CAGR | 3% |
The market is also supported by the presence of advanced industrial and manufacturing ecosystems across North America. The region hosts large-scale operations in oil and gas, chemicals, power generation, and heavy equipment manufacturing, all of which require accurate pressure regulation systems to maintain process safety and efficiency. Increasing automation adoption and process optimization initiatives are further strengthening the dependence on technologically advanced pressure control equipment, ensuring improved operational reliability and system performance across multiple industries.
The valves segment generated USD 586.1 million in 2025 and is projected to grow at a CAGR of 2.8% from 2026 to 2035. Valves lead the North America pressure control equipment market due to their essential function in regulating fluid flow and managing pressure across oil and gas, chemical processing, and power generation applications. These systems play a critical role in ensuring safety, maintaining pipeline integrity, and improving operational efficiency in drilling, transportation, and production environments. Strong emphasis on industrial safety standards and advanced engineering practices continues to drive demand for durable and high-performance valve systems, reinforcing their dominant position across both new installations and maintenance activities.
The wireline pressure control equipment segment accounted for 65% share in 2025 and is expected to grow at a CAGR of 2.8% through 2035. This segment leads due to its vital role in well intervention and maintenance operations, enabling safe access to high-pressure subsurface environments. Wireline systems are widely used for activities such as logging, perforation, and tool deployment, supporting efficient reservoir management. Strong onshore shale development activity combined with frequent well servicing requirements continues to drive steady demand for precise and reliable pressure control solutions in this category.
U.S. Pressure Control Equipment Market reached USD 1.4 billion in 2025 and is forecast to grow at a CAGR of 2.7% from 2026 to 2035. Market growth in the country is driven by large-scale oil and gas production activities, particularly across shale formations and offshore fields. Operators increasingly rely on advanced well control systems, including blowout preventers, valves, and wellhead technologies, to ensure safe operations under high-pressure conditions. The adoption of automation and remote operation technologies is further improving efficiency, reducing downtime, and enhancing precision in drilling and production activities, while manufacturers continue to prioritize regulatory compliance and reliable service support.
Major players operating in the North America Pressure Control Equipment Industry include TechnipFMC plc, Halliburton Company, Weatherford International, Baker Hughes Company, Schlumberger Limited, National Oilwell Varco, Oil States International, Aker Solutions ASA, Cactus Inc., Curtiss-Wright Corporation, Forum Energy Technologies, Hunting PLC, Innovex International, Inc., Schneider Electric SE, and The Weir Group PLC. Key strategies adopted by companies in the North America Pressure Control Equipment Market focus on strengthening product reliability, expanding automation-enabled solutions, and increasing investment in advanced material engineering to withstand high-pressure environments. Firms are prioritizing digitalization through smart monitoring and predictive maintenance technologies to improve operational efficiency and reduce downtime. Strategic collaborations with oilfield operators and EPC contractors are being used to secure long-term supply agreements. Companies are also expanding aftermarket services, including maintenance and refurbishment solutions, to enhance lifecycle value.
Table of Contents
Chapter 1 Methodology & Scope
- 1.1 Market scope and definition
- 1.2 Research design
- 1.2.1 Research approach
- 1.2.2 Data collection methods
- 1.3 Data mining sources
- 1.3.1 Global
- 1.3.2 Country
- 1.4 Base estimates and calculations
- 1.4.1 Base year calculation
- 1.4.2 Key trends for market estimation
- 1.5 Primary research and validation
- 1.5.1 Primary sources
- 1.6 Forecast model
- 1.7 Research assumptions and limitations
Chapter 2 Executive Summary
- 2.1 Industry 360° synopsis
- 2.2 Key market trends
- 2.2.1 Regional
- 2.2.2 Component
- 2.2.3 Category
- 2.2.4 Price Range
- 2.2.5 Application
- 2.2.6 End Use
- 2.2.7 Distribution channel
Chapter 3 Industry Insights
- 3.1 Industry ecosystem analysis
- 3.1.1 Supplier landscape
- 3.1.2 Profit margin
- 3.1.3 Value addition at each stage
- 3.1.4 Factor affecting the value chain
- 3.2 Industry impact forces
- 3.2.1 Growth drivers
- 3.2.1.1 High level of oil and gas exploration, especially shale and offshore activities
- 3.2.1.2 Presence of advanced industrial and manufacturing infrastructure
- 3.2.1.3 Strict safety and environmental regulations in the U.S. and Canada
- 3.2.2 Pitfalls & Challenges
- 3.2.2.1 Fluctuations in crude oil prices affecting upstream investments
- 3.2.2.2 High operational and maintenance costs of advanced equipment
- 3.2.3 Opportunities
- 3.2.3.1 Increasing adoption of digital oilfield technologies and remote monitoring
- 3.2.3.2 Expansion of natural gas infrastructure and LNG projects
- 3.2.1 Growth drivers
- 3.3 Growth potential analysis
- 3.4 Future market trends
- 3.5 Technology and innovation landscape
- 3.5.1 Current technological trends
- 3.5.2 Emerging technologies
- 3.6 Regulatory landscape
- 3.6.1 Standards and compliance requirements
- 3.6.2 Regional regulatory frameworks
- 3.6.3 Certification standards
- 3.7 Porter's analysis
- 3.8 PESTEL analysis
- 3.9 Pricing Analysis (Driven by Primary Research)
- 3.9.1 Historical Price Trend Analysis (Driven by Primary Research)
- 3.9.2 Pricing Strategy by Player Type (Premium / Value / Cost-plus) (Driven by Primary Research)
- 3.9.3 Impact of Raw Material Costs on Equipment Pricing
- 3.10 Trade Data Analysis (Driven by paid database)
- 3.10.1 Import/Export Volume & Value Trends (Driven by paid database)
- 3.10.2 Key Trade Corridors & Tariff Impact (Driven by paid database)
- 3.10.3 Regional Trade Flow Patterns & Export Competitiveness
- 3.11 Impact of AI & Generative AI on the Market
- 3.11.1 AI-Driven Disruption of Traditional Control Systems & Operations
- 3.11.2 GenAI Use Cases & Adoption Roadmap by Industry Segment
- 3.11.3 Risks, Limitations & Regulatory Considerations
- 3.12 Manufacturing Capacity & Production Infrastructure Landscape (Driven by Primary Research)
- 3.13 Installed Manufacturing Capacity by Region & Key Producer (Driven by Primary Research)
- 3.14 Capacity Utilization Rates & Expansion Pipelines (Driven by Primary Research)
Chapter 4 Competitive Landscape, 2025
- 4.1 Introduction
- 4.2 Company market share analysis
- 4.2.1 By Country
- 4.2.1.1 U.S
- 4.2.1.2 Canada
- 4.2.1 By Country
- 4.3 Company matrix analysis
- 4.4 Competitive analysis of major market players
- 4.5 Competitive positioning matrix
- 4.6 Key developments
- 4.6.1 Mergers & acquisitions
- 4.6.2 Partnerships & collaborations
- 4.6.3 New product launches
- 4.6.4 Expansion plans
Chapter 5 Market Estimates & Forecast, By Component, 2022 - 2035, (USD Billion) (Thousand Units)
- 5.1 Key trends
- 5.2 Valves
- 5.3 Control Head
- 5.4 Wellhead Flange
- 5.5 Adapter Flange
- 5.6 Quick Unions
- 5.7 Flexible Hoses
- 5.8 Others
Chapter 6 Market Estimates & Forecast, By Category, 2022 - 2035, (USD Billion) (Thousand Units)
- 6.1 Key trends
- 6.2 Wireline Pressure Control Equipment
- 6.3 Coiled Tubing Pressure Control Equipment
Chapter 7 Market Estimates & Forecast, By Price Range, 2022 - 2035, (USD Billion) (Thousand Units)
- 7.1 Key trends
- 7.2 Low
- 7.3 Medium
- 7.4 High
Chapter 8 Market Estimates & Forecast, By Application, 2022 - 2035, (USD Billion) (Thousand Units)
- 8.1 Key trends
- 8.2 Offshore
- 8.3 Onshore
Chapter 9 Market Estimates & Forecast, By End-Use, 2022 - 2035, (USD Billion) (Thousand Units)
- 9.1 Key trends
- 9.2 Oil & Gas
- 9.3 Chemicals
- 9.4 Energy & Utilities
- 9.5 Manufacturing
- 9.6 Mining
- 9.7 Pulp & Paper
- 9.8 Others
Chapter 10 Market Estimates & Forecast, By Distribution Channel, 2022 - 2035, (USD Billion) (Thousand Units)
- 10.1 Key trends
- 10.2 Direct
- 10.3 Indirect
Chapter 11 Market Estimates & Forecast, By Country, 2022 - 2035, (USD Billion) (Thousand Units)
- 11.1 Key trends
- 11.2 North America
- 11.2.1 U.S.
- 11.2.2 Canada
Chapter 12 Company Profiles
- 12.1 Schlumberger Limited
- 12.2 Baker Hughes Company
- 12.3 TechnipFMC plc
- 12.4 Halliburton Company
- 12.5 National Oilwell Varco
- 12.6 Weatherford International
- 12.7 Aker Solutions ASA
- 12.8 The Weir Group PLC
- 12.9 Innovex International, Inc.
- 12.10 Curtiss-Wright Corporation
- 12.11 Hunting PLC
- 12.12 Cactus Inc.
- 12.13 Forum Energy Technologies
- 12.14 Oil States International
- 12.15 Schneider Electric SE

