PUBLISHER: Global Market Insights Inc. | PRODUCT CODE: 2038301

PUBLISHER: Global Market Insights Inc. | PRODUCT CODE: 2038301
E-Paper Display Controller Market Opportunity, Growth Drivers, Industry Trend Analysis, and Forecast 2026 - 2035
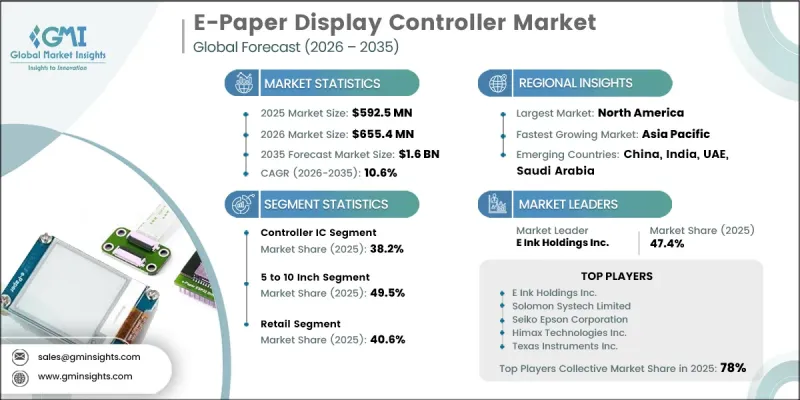
The Global E-Paper Display Controller Market was valued at USD 592.5 million in 2025 and is estimated to grow at a CAGR of 10.6% to reach USD 1.6 billion by 2035.
Growth is supported by the widespread integration of electronic paper displays across multiple sectors, alongside a rising preference for energy-saving solutions that extend device lifespan. The expansion of connected ecosystems and the growing reliance on intelligent devices are further strengthening demand for advanced controller components capable of efficient performance. Continuous improvements in controller IC architecture and display management technologies are also contributing to market expansion. In addition, the rising need for reliable, readable, and low-maintenance display systems is encouraging adoption across diverse use cases, reinforcing long-term growth prospects for the e-paper display controller industry.
| Market Scope | |
|---|---|
| Start Year | 2025 |
| Forecast Year | 2026-2035 |
| Start Value | $592.5 Million |
| Forecast Value | $1.6 Billion |
| CAGR | 10.6% |
The market's upward trajectory is supported by the growing deployment of digital display systems and labeling technologies across key global regions, including Europe, Asia Pacific, and North America. Businesses are increasingly prioritizing operational accuracy, automation, and efficiency, which is accelerating the implementation of e-paper-based solutions. At the same time, expanding use cases in sectors such as transportation and healthcare are strengthening demand, as these environments require displays that offer clarity while consuming minimal power. The continued rise of IoT-enabled devices is also driving the need for controller ICs that can handle frequent updates without increasing energy consumption.
The controller ICs segment held a 38.2% share in 2025. This dominance is attributed to their essential role in managing key display functions, including image rendering, refresh cycles, and power optimization. Their growing adoption across a wide range of applications is being fueled by increasing investments in digital infrastructure and the need for efficient display performance.
The retail segment held a 40.6% share in 2025, driven by the rapid adoption of automated display technologies designed to enhance operational workflows and improve pricing accuracy. Businesses are leveraging these systems to streamline processes, reduce manual intervention, and improve overall efficiency, which is significantly boosting demand within the segment.
North America E-Paper Display Controller Market held a 31.2% share in 2025. The region's growth is being supported by strong technological adoption, increased investments in automation, and the widespread implementation of smart infrastructure. Organizations are focusing on improving operational visibility and efficiency through advanced display technologies, while ongoing advancements in connected systems continue to strengthen regional market expansion.
Key companies operating in the Global E-Paper Display Controller Market include Amcor, Biomass Packaging, Biopak, DS Smith, Elopak, Genpak, Huhtamaki, International Paper, Karl Knauer, Mondi, Nordic Paper, PacknWood, Smurfit Kappa, Sonoco Products, Stora Enso, Sulapac, Tetra Pak, TIPA, Vegware, and WestRock. Companies in the e-paper display controller market are actively adopting strategies focused on innovation, partnerships, and geographic expansion to strengthen their market position. They are investing heavily in research and development to enhance controller efficiency, reduce power consumption, and improve display performance. Strategic collaborations with technology providers and system integrators are helping firms expand their product capabilities and reach new customer segments. Many players are also focusing on expanding their presence in emerging markets to tap into growing demand. Additionally, companies are emphasizing product differentiation through advanced features and customized solutions, while optimizing supply chains and production processes to maintain competitiveness and improve profit margins.
Table of Contents
Chapter 1 Methodology and Scope
- 1.1 Market scope and definition
- 1.2 Research design
- 1.2.1 Research approach
- 1.2.2 Data collection methods
- 1.3 Data mining sources
- 1.3.1 Global
- 1.3.2 Regional/Country
- 1.4 Base estimates and calculations
- 1.4.1 Base year calculation
- 1.4.2 Key trends for market estimation
- 1.5 Primary research and validation
- 1.5.1 Primary sources
- 1.6 Forecast model
- 1.7 Research assumptions and limitations
Chapter 2 Executive Summary
- 2.1 Industry 360° synopsis, 2022 - 2035
- 2.2 Key market trends
- 2.2.1 IC Type trends
- 2.2.2 Panel Size trends
- 2.2.3 Application trends
- 2.2.4 End-user Industry trends
- 2.2.5 Regional trends
- 2.3 TAM Analysis, 2026-2035
- 2.4 CXO perspectives: Strategic imperatives
Chapter 3 Industry Insights
- 3.1 Industry ecosystem analysis
- 3.1.1 Supplier Landscape
- 3.1.2 Profit Margin
- 3.1.3 Cost structure
- 3.1.4 Value addition at each stage
- 3.1.5 Factor affecting the value chain
- 3.1.6 Disruptions
- 3.2 Industry impact forces
- 3.2.1 Growth drivers
- 3.2.1.1 Rising adoption of electronic shelf labels (ESLs) in retail automation
- 3.2.1.2 Increasing demand for ultra-low power display technologies in IoT devices
- 3.2.1.3 Expansion of smart logistics and supply chain digitization
- 3.2.1.4 Growing integration of e-paper displays in consumer electronics and wearables
- 3.2.1.5 Advancements in display driver ICs and controller integration technologies
- 3.2.2 Industry pitfalls and challenges
- 3.2.2.1 High initial cost of e-paper display ecosystems and integration
- 3.2.2.2 Limited refresh rate and performance constraints compared to LCD/LED displays
- 3.2.3 Market opportunities
- 3.2.3.1 Expansion of Smart Transportation and Public Information Systems
- 3.2.3.2 Adoption of E-Paper in Healthcare and Industrial Monitoring Systems
- 3.2.1 Growth drivers
- 3.3 Growth potential analysis
- 3.4 Regulatory landscape
- 3.4.1 North America
- 3.4.2 Europe
- 3.4.3 Asia Pacific
- 3.4.4 Latin America
- 3.4.5 Middle East & Africa
- 3.5 Porter's analysis
- 3.6 PESTEL analysis
- 3.7 Technology and Innovation landscape
- 3.7.1 Current technological trends
- 3.7.2 Emerging technologies
- 3.8 Price trends
- 3.8.1 By region
- 3.8.2 By product
- 3.9 Pricing Strategies
- 3.10 Emerging Business Models
- 3.11 Compliance Requirements
- 3.12 Patent and IP analysis
Chapter 4 Competitive Landscape, 2025
- 4.1 Introduction
- 4.2 Company market share analysis
- 4.2.1 By region
- 4.2.1.1 North America
- 4.2.1.2 Europe
- 4.2.1.3 Asia Pacific
- 4.2.1.4 Latin America
- 4.2.1.5 Middle East & Africa
- 4.2.2 Market concentration analysis
- 4.2.1 By region
- 4.3 Competitive benchmarking of key players
- 4.3.1 Financial performance comparison
- 4.3.1.1 Revenue
- 4.3.1.2 Profit margin
- 4.3.1.3 R&D
- 4.3.2 Product portfolio comparison
- 4.3.2.1 Product range breadth
- 4.3.2.2 Technology
- 4.3.2.3 Innovation
- 4.3.3 Geographic presence comparison
- 4.3.3.1 Global footprint analysis
- 4.3.3.2 Service network coverage
- 4.3.3.3 Market penetration by region
- 4.3.4 Competitive positioning matrix
- 4.3.4.1 Leaders
- 4.3.4.2 Challengers
- 4.3.4.3 Followers
- 4.3.4.4 Niche players
- 4.3.5 Strategic outlook matrix
- 4.3.1 Financial performance comparison
- 4.4 Key developments
- 4.4.1 Mergers and acquisitions
- 4.4.2 Partnerships and collaborations
- 4.4.3 Technological advancements
- 4.4.4 Expansion and investment strategies
- 4.4.5 Digital transformation initiatives
- 4.5 Emerging/ startup competitors landscape
Chapter 5 Market Estimates and Forecast, By IC Type, 2022 - 2035 (USD Million)
- 5.1 Key trends
- 5.2 Controller IC
- 5.3 Gate driver IC
- 5.4 Source driver IC
- 5.5 System-on-Chip (SoC)
Chapter 6 Market Estimates and Forecast, By Panel Size, 2022 - 2035 (USD Million)
- 6.1 Key trends
- 6.2 Less than 5 inch
- 6.3 5 to 10 inch
- 6.4 Greater than 10 inch
Chapter 7 Market Estimates and Forecast, By End-use Industry, 2022 - 2035 (USD Million)
- 7.1 Key trends
- 7.2 Consumer electronics
- 7.2.1 Personal reading devices
- 7.2.2 Home automation & smart home displays
- 7.2.3 Consumer wearables
- 7.2.4 Others
- 7.3 Retail
- 7.3.1 In-store electronic shelf labels
- 7.3.2 Point-of-sale displays
- 7.3.3 Retail advertising & promotion
- 7.3.4 Others
- 7.4 Healthcare
- 7.4.1 Diagnostic equipment displays
- 7.4.2 Patient monitoring devices
- 7.4.3 Hospital information systems
- 7.4.4 Others
- 7.5 Transportation
- 7.6 Government & defense
- 7.7 Industrial applications
- 7.8 Media & entertainment
- 7.9 Others
Chapter 8 Market Estimates and Forecast, By Region, 2022 - 2035 (USD Million)
- 8.1 Key trends
- 8.2 North America
- 8.2.1 U.S.
- 8.2.2 Canada
- 8.3 Europe
- 8.3.1 Germany
- 8.3.2 UK
- 8.3.3 France
- 8.3.4 Spain
- 8.3.5 Italy
- 8.3.6 Netherlands
- 8.4 Asia Pacific
- 8.4.1 China
- 8.4.2 India
- 8.4.3 Japan
- 8.4.4 Australia
- 8.4.5 South Korea
- 8.5 Latin America
- 8.5.1 Brazil
- 8.5.2 Mexico
- 8.5.3 Argentina
- 8.6 Middle East and Africa
- 8.6.1 South Africa
- 8.6.2 Saudi Arabia
- 8.6.3 UAE
Chapter 9 Company Profiles
- 9.1 Global Key Players
- 9.1.1 E Ink Holdings Inc.
- 9.1.2 Seiko Epson Corporation
- 9.1.3 Texas Instruments Inc.
- 9.1.4 MediaTek Inc.
- 9.1.5 NXP Semiconductors N.V.
- 9.1.6 STMicroelectronics N.V.
- 9.1.7 Silicon Labs
- 9.1.8 ROHM Semiconductor
- 9.2 Regional Players
- 9.2.1 Solomon Systech Limited
- 9.2.2 Himax Technologies Inc.
- 9.2.3 UltraChip Inc.
- 9.2.4 ITE Tech Inc.
- 9.2.5 Novatek Microelectronics Corp.
- 9.2.6 FITIPOWER Integrated Technology Inc.
- 9.3 Local Players
- 9.3.1 DAVICOM Semiconductor Inc.
- 9.3.2 Jadard Technology Inc.
- 9.3.3 Geniatech Inc.

