PUBLISHER: Global Market Insights Inc. | PRODUCT CODE: 2038373

PUBLISHER: Global Market Insights Inc. | PRODUCT CODE: 2038373
Controllable Pitch Marine Propeller Market Opportunity, Growth Drivers, Industry Trend Analysis, and Forecast 2026 - 2035
The Global Controllable Pitch Marine Propeller Market was valued at USD 795.9 million in 2025 and is estimated to grow at a CAGR of 6.7% to reach USD 1.5 billion by 2035.
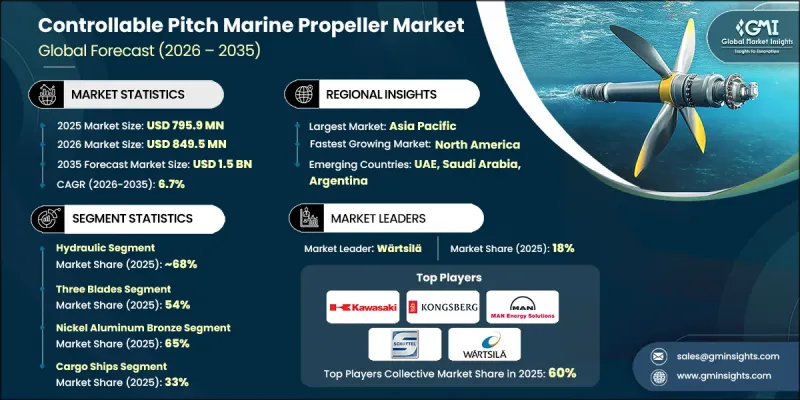
Demand is driven by the need for advanced propulsion systems that offer improved maneuverability, optimized fuel consumption, and precise thrust control. These propellers enable vessels to adjust blade angles based on varying load and sea conditions, enhancing propulsion efficiency while reducing engine strain. Increasing regulatory pressure to improve energy efficiency and reduce emissions is further encouraging adoption across global fleets. Regions with strong maritime infrastructure are investing in modern vessel technologies and retrofit solutions to upgrade existing fleets. At the same time, expanding global trade and shipping activities are reinforcing the importance of high-performance propulsion systems. Continuous advancements in marine engineering and system integration are also supporting market growth, making controllable pitch propellers an essential component in modern vessel operations worldwide.
| Market Scope | |
|---|---|
| Start Year | 2025 |
| Forecast Year | 2026-2035 |
| Start Value | $ 795.9 Million |
| Forecast Value | $1.5 Billion |
| CAGR | 6.7% |
The Asia Pacific region holds the largest share of the controllable pitch marine propeller market, supported by its strong shipbuilding capabilities and high vessel production output. The region's growing fleet size and ongoing port infrastructure development are contributing to increased installations of advanced propulsion systems. Meanwhile, Europe is experiencing rising demand due to the adoption of modern marine technologies and fleet upgrades, along with a focus on improving operational efficiency and reducing environmental impact.
The hydraulic segment accounted for 68% share in 2025 and is expected to grow at a CAGR of 6% from 2026 to 2035. This segment is gaining traction due to its ability to deliver precise blade control under demanding operating conditions. Its reliability and efficient torque transmission make it a preferred choice for vessels requiring consistent performance. The capability to support rapid thrust adjustments also enhances its suitability for applications where maneuverability is critical.
The three-blade segment held a 54% share in 2025 and is projected to grow at a CAGR of 5% through 2035. Its popularity is driven by a balanced combination of efficiency, cost-effectiveness, and operational simplicity. This design offers reduced resistance while maintaining adequate propulsion performance, making it a practical option for a wide range of marine vessels. Increasing demand for cost-efficient propulsion solutions is further supporting segment growth.
China Controllable Pitch Marine Propeller Market held 45% share, generating USD 178.3 million in 2025. The country's strong shipbuilding industry continues to drive consistent demand for advanced propulsion systems. Ongoing expansion of the commercial fleet and increased maritime activities are contributing to the adoption of efficient propeller technologies. The need for improved operational performance and fuel efficiency is further supporting market growth in the region.
Key companies operating in the Controllable Pitch Marine Propeller Market include Wartsila, Kongsberg Maritime, MAN Energy Solutions, Hyundai Heavy Industries, Kawasaki Heavy Industries, Schottel, Brunvoll, Nakashima Propeller, Berg Propulsion, and Eneria. Companies in the Controllable Pitch Marine Propeller Market are strengthening their competitive position through continuous innovation and strategic expansion. They are investing in advanced propulsion technologies to improve efficiency, durability, and environmental performance. Partnerships with shipbuilders and marine operators are helping expand market reach and enhance product integration. Many firms are focusing on retrofit solutions to upgrade existing fleets and meet evolving regulatory requirements. In addition, companies are expanding their global presence by entering emerging maritime markets and strengthening service networks. Mergers and acquisitions are also being used to enhance technical capabilities and diversify product portfolios, while ongoing investments in research and development support long-term growth and innovation.
Table of Contents
Chapter 1 Methodology
- 1.1 Research approach
- 1.2 Quality Commitments
- 1.2.1 GMI AI policy & data integrity commitment
- 1.2.1.1 Source consistency protocol
- 1.2.1 GMI AI policy & data integrity commitment
- 1.3 Research Trail & Confidence Scoring
- 1.3.1 Research Trail Components
- 1.3.2 Scoring Components
- 1.4 Data Collection
- 1.4.1 Partial list of primary sources
- 1.5 Data mining sources
- 1.5.1 Paid sources
- 1.5.2 Sources, by region
- 1.6 Base estimates and calculations
- 1.6.1 Base year calculation
- 1.7 Forecast model
- 1.7.1 Quantified market impact analysis
- 1.7.1.1 Mathematical impact of growth parameters on forecast
- 1.7.1 Quantified market impact analysis
- 1.8 Research transparency addendum
- 1.8.1 Source attribution framework
- 1.8.2 Quality assurance metrics
- 1.8.3 Our commitment to trust
Chapter 2 Executive Summary
- 2.1 Industry 360° synopsis, 2022 - 2035
- 2.2 Key market trends
- 2.2.1 Regional
- 2.2.2 Propeller
- 2.2.3 Number of Blades
- 2.2.4 Material
- 2.2.5 Vessel
- 2.2.6 End Use
- 2.3 TAM Analysis, 2026-2035
- 2.4 CXO perspectives: Strategic imperatives
Chapter 3 Industry Insights
- 3.1 Industry ecosystem analysis
- 3.1.1 Supplier landscape
- 3.1.2 Profit margin analysis
- 3.1.3 Cost structure
- 3.1.4 Value addition at each stage
- 3.1.5 Factor affecting the value chain
- 3.1.6 Disruptions
- 3.2 Industry impact forces
- 3.2.1 Growth drivers
- 3.2.1.1 Growth in global shipbuilding activities
- 3.2.1.2 Rising focus on fuel efficiency
- 3.2.1.3 Expansion of offshore energy sector
- 3.2.1.4 Demand for vessel maneuverability
- 3.2.2 Industry pitfalls and challenges
- 3.2.2.1 High installation and maintenance cost
- 3.2.2.2 Technical complexity
- 3.2.2.3 Raw material price volatility
- 3.2.2.4 Downtime risk during repairs
- 3.2.3 Market opportunities
- 3.2.3.1 Fleet decarbonization initiatives
- 3.2.3.2 Growth in naval modernization programs
- 3.2.3.3 Smart digital monitoring systems
- 3.2.3.4 Emerging maritime economies
- 3.2.1 Growth drivers
- 3.3 Growth potential analysis
- 3.4 Regulatory landscape
- 3.4.1 North America
- 3.4.1.1 U.S. Coast Guard (USCG) Marine Equipment Regulations
- 3.4.1.2 Environmental Protection Agency (EPA) Marine Emissions Standards
- 3.4.1.3 U.S. Department of Transportation (DOT) Maritime Safety Regulations
- 3.4.1.4 Occupational Safety and Health Administration (OSHA) Marine Workplace Safety Rules
- 3.4.1.5 Transport Canada Marine Safety Regulations
- 3.4.2 Europe
- 3.4.2.1 EU Marine Equipment Directive (MED)
- 3.4.2.2 EU Ship Recycling Regulation
- 3.4.2.3 REACH Regulation for Marine Materials
- 3.4.2.4 IMO MARPOL Compliance (European Enforcement)
- 3.4.2.5 Classification Society Rules (DNV, Lloyd’s Register, Bureau Veritas)
- 3.4.3 Asia Pacific
- 3.4.3.1 China Classification Society (CCS) Marine Standards
- 3.4.3.2 Indian Directorate General of Shipping (DGS) Regulations
- 3.4.3.3 Japanese Ship Safety Act & JG Marine Standards
- 3.4.3.4 Korean Register (KR) Classification Rules
- 3.4.3.5 ASEAN Maritime Transport Safety Framework
- 3.4.4 Latin America
- 3.4.4.1 Brazilian Directorate of Ports and Coasts (DPC) Regulations
- 3.4.4.2 Brazilian Navy Maritime Authority Rules
- 3.4.4.3 Mexican Maritime Authority (SEMAR) Vessel Standards
- 3.4.4.4 Panama Maritime Authority Regulations
- 3.4.4.5 Regional Classification Society Compliance Requirements
- 3.4.5 Middle East & Africa
- 3.4.5.1 Saudi Ports Authority Maritime Equipment Regulations
- 3.4.5.2 UAE Federal Transport Authority Maritime Standards
- 3.4.5.3 GCC Marine Safety and Equipment Guidelines
- 3.4.5.4 South African Maritime Safety Authority (SAMSA) Rules
- 3.4.5.5 Egyptian Authority for Maritime Safety Regulations
- 3.4.1 North America
- 3.5 Porter's analysis
- 3.6 PESTEL analysis
- 3.7 Technology and innovation landscape
- 3.7.1 Current technological trends
- 3.7.2 Emerging technologies
- 3.8 Price analysis (Driven by Primary Research)
- 3.8.1 Historical Price Trend Analysis
- 3.8.2 Pricing Strategy by Player Type (Premium / Value / Cost-plus)
- 3.9 Trade data analysis (Driven by Paid Research)
- 3.9.1 Import/export volume & value trends
- 3.9.2 Key trade corridors & tariff impact
- 3.10 Cost breakdown analysis
- 3.11 Patent analysis (Driven by Primary Research)
- 3.12 Impact of AI & generative AI on the market
- 3.12.1 AI-driven disruption of existing business models
- 3.12.2 GenAI use cases & adoption roadmap by segment
- 3.12.3 Risks, limitations & regulatory considerations
- 3.13 Capacity & production landscape (Driven by Primary Research)
- 3.13.1 Installed capacity by region & key producer
- 3.13.2 Capacity utilization rates & expansion pipelines
- 3.14 Sustainability and environmental aspects
- 3.14.1 Sustainable practices
- 3.14.2 Waste reduction strategies
- 3.14.3 Energy efficiency in production
- 3.14.4 Eco-friendly Initiatives
- 3.14.5 Carbon footprint considerations
- 3.15 Forecast assumptions & scenario analysis (Driven by Primary Research)
- 3.15.1 Base Case - key macro & industry variables driving CAGR
- 3.15.2 Optimistic Scenarios - Favorable macro and industry tailwinds
- 3.15.3 Pessimistic Scenario - Macroeconomic slowdown or industry headwinds
Chapter 4 Competitive Landscape, 2025
- 4.1 Introduction
- 4.2 Company market share analysis
- 4.2.1 North America
- 4.2.2 Europe
- 4.2.3 Asia Pacific
- 4.2.4 LATAM
- 4.2.5 MEA
- 4.3 Competitive analysis of major market players
- 4.4 Competitive positioning matrix
- 4.5 Key developments
- 4.5.1 Mergers & acquisitions
- 4.5.2 Partnerships & collaborations
- 4.5.3 New Product Launches
- 4.5.4 Expansion Plans and funding
- 4.6 Company tier benchmarking
- 4.6.1 Tier classification criteria & qualifying thresholds
- 4.6.2 Tier positioning matrix by revenue, geography & innovation
Chapter 5 Market Estimates & Forecast, By Propeller, 2022 - 2035 ($Mn, Units)
- 5.1 Key trends
- 5.2 Hydraulic
- 5.3 Electric
- 5.4 Hybrid
Chapter 6 Market Estimates & Forecast, By Number of Blades, 2022 - 2035 ($Mn, Units)
- 6.1 Key trends
- 6.2 Three Blades
- 6.3 Four Blades
- 6.4 Five Blades
Chapter 7 Market Estimates & Forecast, By Material, 2022 - 2035 ($Mn, Units)
- 7.1 Key trends
- 7.2 Nickel Aluminum Bronze
- 7.3 Stainless Steel
- 7.4 Composite Materials
- 7.5 Others
Chapter 8 Market Estimates & Forecast, By Vessel, 2022 - 2035 ($Mn, Units)
- 8.1 Key trends
- 8.2 Cargo ships
- 8.3 Tankers
- 8.4 Offshore vessels
- 8.5 Naval ships
- 8.6 Passenger ships
- 8.7 Others
Chapter 9 Market Estimates & Forecast, By End Use, 2022 - 2035 ($Mn, Units)
- 9.1 Key trends
- 9.2 New Build Installations
- 9.3 Retrofit Installations
- 9.4 Replacement Market
Chapter 10 Market Estimates & Forecast, By Region, 2022 - 2035 ($Mn, Units)
- 10.1 Key trends
- 10.2 North America
- 10.2.1 US
- 10.2.2 Canada
- 10.3 Europe
- 10.3.1 UK
- 10.3.2 Germany
- 10.3.3 France
- 10.3.4 Italy
- 10.3.5 Spain
- 10.3.6 Russia
- 10.3.7 Nordics
- 10.4 Asia Pacific
- 10.4.1 China
- 10.4.2 India
- 10.4.3 Japan
- 10.4.4 South Korea
- 10.4.5 Southeast Asia
- 10.4.6 ANZ
- 10.5 Latin America
- 10.5.1 Brazil
- 10.5.2 Argentina
- 10.5.3 Mexico
- 10.6 MEA
- 10.6.1 UAE
- 10.6.2 Saudi Arabia
- 10.6.3 South Africa
Chapter 11 Company Profiles
- 11.1 Global Players
- 11.1.1 Berg Propulsion
- 11.1.2 Brunvoll
- 11.1.3 Hyundai Heavy Industries
- 11.1.4 Kawasaki Heavy Industries
- 11.1.5 Kongsberg Maritime
- 11.1.6 MAN Energy Solutions
- 11.1.7 Nakashima Propeller
- 11.1.8 Schottel
- 11.1.9 Wartsila
- 11.2 Regional Players
- 11.2.1 Andritz Hydro
- 11.2.2 Eneria
- 11.2.3 Hundested Propeller
- 11.2.4 Kamome
- 11.2.5 Masson Marine
- 11.2.6 Servogear
- 11.2.7 Zavamarine
- 11.3 Emerging Players
- 11.3.1 Deyuan Marine
- 11.3.2 Fountom Marine
- 11.3.3 JC Navalips
- 11.3.4 Zamech-Marine

