
PUBLISHER: Global Market Insights Inc. | PRODUCT CODE: 2038407

PUBLISHER: Global Market Insights Inc. | PRODUCT CODE: 2038407
Handheld 3D Scanners Market Opportunity, Growth Drivers, Industry Trend Analysis, and Forecast 2026 - 2035
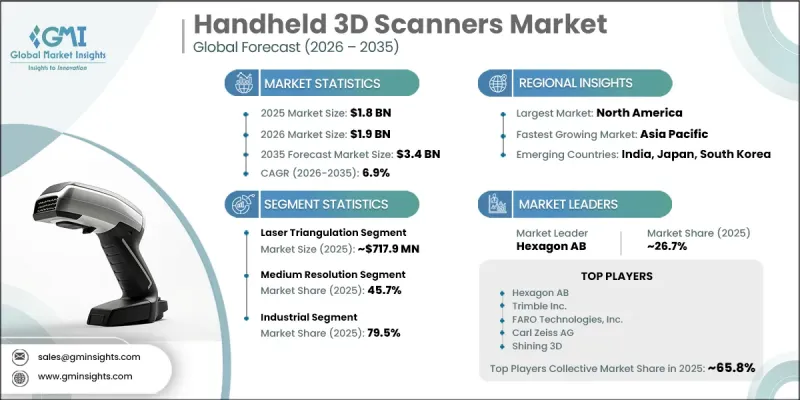
The Global Handheld 3D Scanners Market was valued at USD 1.8 billion in 2025 and is estimated to grow at a CAGR of 6.9% to reach USD 3.4 billion by 2035.
Growth in this market is supported by the increasing integration of 3D scanning technologies into manufacturing workflows, especially for precision measurement and quality assurance applications. Handheld 3D scanners are increasingly used to improve production accuracy by enabling real-time inspection and reducing dependency on traditional manual measurement techniques. Industries such as automotive, aerospace, and electronics are steadily incorporating these devices into inspection and compliance processes to meet strict quality standards. Their portability, flexibility, and ease of operation allow efficient scanning of complex geometries directly on-site, which improves operational efficiency. Rising demand for faster product development cycles is further accelerating adoption, as digital scanning helps engineers create precise models for design validation and prototyping. This reduces development time and overall costs while improving product performance. Increasing focus on innovation, customization, and digital transformation across industrial sectors is also strengthening market expansion, as businesses prioritize advanced scanning solutions to enhance competitiveness and streamline workflows.
| Market Scope | |
|---|---|
| Start Year | 2025 |
| Forecast Year | 2026-2035 |
| Start Value | $1.8 Billion |
| Forecast Value | $3.4 Billion |
| CAGR | 6.9% |
The laser triangulation segment generated USD 717.9 million in 2025 and is expected to grow at a CAGR of 6.2% from 2026 to 2035. This segment leads the market due to its strong capability to capture highly accurate 3D measurements and detailed surface geometry. The technology works by projecting a laser onto an object and capturing reflected light data to construct precise digital models. It is widely adopted in industrial environments where dimensional precision is essential. Its ability to efficiently scan small, intricate, and complex components makes it highly valuable for quality inspection, reverse engineering, and manufacturing applications. The combination of speed, accuracy, and reliability continues to reinforce the strong market position of laser triangulation technology.
The medium resolution segment accounted for 45.7% share in 2025 and is projected to grow at a CAGR of 9.6% from 2026 to 2035. This segment dominates because it provides an optimal balance between scanning accuracy, processing speed, and data size, making it suitable for a wide range of industrial and professional applications. Medium-resolution scanners are widely used in inspection, product development, and design validation processes where consistent accuracy is required without excessive data complexity. Their efficiency and cost-effectiveness make them highly attractive to engineers and manufacturers seeking dependable performance and streamlined workflows. These advantages continue to support strong adoption across multiple industries.
U.S. Handheld 3D Scanners Market captured USD 563.8 million in 2025 and is projected to grow at a CAGR of 5.6% from 2026 to 2035. Market growth in the country is driven by strong adoption across manufacturing, healthcare, aerospace, and automotive industries. Handheld 3D scanners are widely used for applications such as reverse engineering, rapid prototyping, quality inspection, and customized component design. Demand is increasing for compact, high-accuracy devices that combine portability with precision performance. Manufacturers are focusing on developing systems with improved usability, wireless connectivity, and seamless integration with CAD platforms to enhance workflow efficiency. Distribution channels include direct enterprise procurement, industrial suppliers, and digital sales platforms, ensuring broad market accessibility.
Key companies operating in the Global Handheld 3D Scanners Market include Artec 3D, FARO Technologies, Inc., Hexagon AB, Trimble Inc., and Carl Zeiss AG. Other prominent players are Creaform, Shining 3D Tech Co., Ltd., Revopoint 3D Technologies Inc., Scantech (Hangzhou) Co., Ltd., Nikon Corporation, Kreon Technologies, Polyga Inc., Peel 3D, 3DMakerpro, and Einstar. Companies in the Handheld 3D Scanners Market are actively strengthening their position through continuous product innovation focused on improving scanning speed, resolution accuracy, and device portability. Manufacturers are investing in advanced software integration, especially CAD compatibility and AI-powered processing tools, to enhance usability and workflow efficiency. Strategic collaborations with industrial sectors such as automotive and aerospace are helping expand application areas. Firms are also prioritizing wireless and cloud-enabled solutions to support real-time data sharing and remote operations. Cost optimization and scalable production strategies are being used to improve global competitiveness. Additionally, companies are expanding distribution networks through direct enterprise sales, digital platforms, and industrial partnerships.
Table of Contents
Chapter 1 Methodology & Scope
- 1.1 Market scope and definition
- 1.2 Research design
- 1.2.1 Research approach
- 1.2.2 Data collection methods
- 1.3 Data mining sources
- 1.3.1 Global
- 1.3.2 Regional/Country
- 1.4 Base estimates and calculations
- 1.4.1 Base year calculation
- 1.4.2 Key trends for market estimation
- 1.5 Primary research and validation
- 1.5.1 Primary sources
- 1.6 Forecast model
- 1.7 Research assumptions and limitations
Chapter 2 Executive Summary
- 2.1 Industry 360° synopsis
- 2.2 Key market trends
- 2.2.1 Regional
- 2.2.2 Type
- 2.2.3 Resolution
- 2.2.4 Scanning Range
- 2.2.5 Color Capture
- 2.2.6 Portability
- 2.2.7 Connectivity
- 2.2.8 Application
- 2.2.9 Distribution channel
Chapter 3 Industry Insights
- 3.1 Industry ecosystem analysis
- 3.1.1 Supplier landscape
- 3.1.2 Profit margin
- 3.1.3 Value addition at each stage
- 3.1.4 Factor affecting the value chain
- 3.2 Industry impact forces
- 3.2.1 Growth drivers
- 3.2.1.1 Increasing adoption of 3D scanning in manufacturing and quality inspection
- 3.2.1.2 Increasing adoption of 3D scanning in manufacturing and quality inspection
- 3.2.1.3 Rising demand for rapid prototyping and product development
- 3.2.2 Pitfalls & Challenges
- 3.2.2.1 High cost of advanced handheld 3D scanning devices
- 3.2.2.2 Complexity in data processing and software integration
- 3.2.3 Opportunities
- 3.2.3.1 Growing adoption in cultural heritage preservation and archaeology
- 3.2.3.2 Integration with augmented reality (AR) and virtual reality (VR) platforms
- 3.2.1 Growth drivers
- 3.3 Growth potential analysis
- 3.4 Future market trends
- 3.5 Technology and innovation landscape
- 3.5.1 Current technological trends
- 3.5.2 Emerging technologies
- 3.6 Regulatory landscape
- 3.6.1 Standards and compliance requirements
- 3.6.2 Regional regulatory frameworks
- 3.6.3 Certification standards
- 3.7 Porter's analysis
- 3.8 PESTEL analysis
- 3.9 Pricing analysis (driven by primary research)
- 3.9.1 Historical price trend analysis (driven by primary research)
- 3.9.2 Pricing strategy by player type (premium / value / cost-plus) (driven by primary research)
- 3.9.3 Regional price variations and determinants
- 3.9.4 Total cost of ownership analysis
- 3.10 Trade data analysis (HS Code 9031.49) (driven by primary research)
- 3.10.1 Import/export volume and value trends (driven by primary research)
- 3.10.2 Key trade corridors and tariff impact (driven by primary research)
- 3.10.3 Regional trade dynamics and cross-border flows
- 3.11 Impact of AI and generative AI on the market
- 3.11.1 AI-driven disruption of existing business models
- 3.11.2 GenAI use cases and adoption roadmap by segment
- 3.11.3 Risks, limitations, and regulatory considerations
- 3.12 Infrastructure and deployment landscape (driven by primary research)
- 3.12.1 Deployment penetration by region and buyer segment (driven by primary research)
- 3.12.2 Scalability constraints and infrastructure investment trends (driven by primary research)
Chapter 4 Competitive Landscape, 2025
- 4.1 Introduction
- 4.2 Company market share analysis
- 4.2.1 By Region
- 4.2.1.1 North America
- 4.2.1.2 Europe
- 4.2.1.3 Asia Pacific
- 4.2.1.4 Latin America
- 4.2.1.5 Middle East & Africa
- 4.2.1 By Region
- 4.3 Company matrix analysis
- 4.4 Competitive analysis of major market players
- 4.5 Competitive positioning matrix
- 4.6 Key developments
- 4.6.1 Mergers & acquisitions
- 4.6.2 Partnerships & collaborations
- 4.6.3 New product launches
- 4.6.4 Expansion plans
Chapter 5 Market Estimates & Forecast, By Product Type, 2022 - 2035, (USD Billion) (Thousand Units)
- 5.1 Key trends
- 5.2 Laser triangulation
- 5.3 Structured light
- 5.4 Photogrammetry
- 5.5 Time-of-flight (ToF)
Chapter 6 Market Estimates & Forecast, By Resolution, 2022 - 2035, (USD Billion) (Thousand Units)
- 6.1 Key trends
- 6.2 Low resolution
- 6.3 Medium resolution
- 6.4 High-resolution
Chapter 7 Market Estimates & Forecast, By Scanning Range, 2022 - 2035, (USD Billion) (Thousand Units)
- 7.1 Key trends
- 7.2 Short-range (up to 1 meter)
- 7.3 Medium-range (1-3 meters)
- 7.4 Long-range (3+ meters)
Chapter 8 Market Estimates & Forecast, By Color Capture, 2022 - 2035, (USD Billion) (Thousand Units)
- 8.1 Key trends
- 8.2 Geometry-only scanners
- 8.3 Color-capable scanners
Chapter 9 Market Estimates & Forecast, By Portability, 2022 - 2035, (USD Billion) (Thousand Units)
- 9.1 Key trends
- 9.2 Battery-powered
- 9.3 Power source
Chapter 10 Market Estimates & Forecast, By Connectivity, 2022 - 2035, (USD Billion) (Thousand Units)
- 10.1 Key trends
- 10.2 Wireless
- 10.3 Wired
Chapter 11 Market Estimates & Forecast, By Application, 2022 - 2035, (USD Billion) (Thousand Units)
- 11.1 Key trends
- 11.2 Residential
- 11.3 Commercial
- 11.4 Industrial
Chapter 12 Market Estimates & Forecast, By Distribution Channel, 2022 - 2035, (USD Billion) (Thousand Units)
- 12.1 Key trends
- 12.2 Offline
- 12.3 Online
Chapter 13 Market Estimates & Forecast, By Region, 2022 - 2035, (USD Billion) (Thousand Units)
- 13.1 Key trends
- 13.2 North America
- 13.2.1 U.S.
- 13.2.2 Canada
- 13.3 Europe
- 13.3.1 Germany
- 13.3.2 UK
- 13.3.3 France
- 13.3.4 Italy
- 13.3.5 Spain
- 13.4 Asia Pacific
- 13.4.1 China
- 13.4.2 India
- 13.4.3 Japan
- 13.4.4 South Korea
- 13.4.5 Australia
- 13.5 Latin America
- 13.5.1 Brazil
- 13.5.2 Mexico
- 13.5.3 Argentina
- 13.6 MEA
- 13.6.1 Saudi Arabia
- 13.6.2 UAE
- 13.6.3 South Africa
Chapter 14 Company Profiles
- 14.1 3DMakerpro
- 14.2 Artec 3D
- 14.3 Carl Zeiss AG
- 14.4 Creaform
- 14.5 Einstar
- 14.6 FARO Technologies, Inc.
- 14.7 Hexagon AB
- 14.8 Kreon Technologies
- 14.9 Nikon Corporation
- 14.10 Peel 3D
- 14.11 Polyga Inc.
- 14.12 Revopoint 3D Technologies Inc.
- 14.13 Scantech (Hangzhou) Co., Ltd.
- 14.14 Shining 3D Tech Co., Ltd.
- 14.15 Trimble Inc.

