
PUBLISHER: Global Market Insights Inc. | PRODUCT CODE: 2038433

PUBLISHER: Global Market Insights Inc. | PRODUCT CODE: 2038433
Flavored Yogurt Market Opportunity, Growth Drivers, Industry Trend Analysis, and Forecast 2026 - 2035
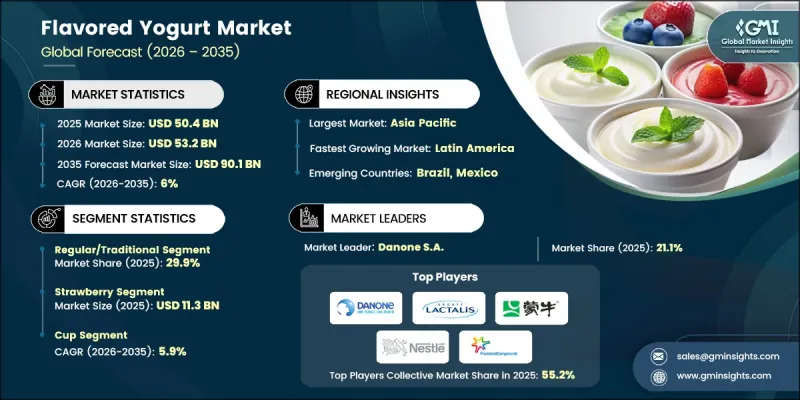
The Global Flavored Yogurt Market was valued at USD 50.4 billion in 2025 and is estimated to grow at a CAGR of 6% to reach USD 90.1 billion by 2035.
The market is evolving rapidly, shaped by shifting dietary habits, rising health consciousness, and continuous product innovation across dairy and non-dairy segments. Consumer demand is increasingly influenced by preferences for healthier, functional, and more diverse food options. Plant-based yogurt alternatives are gaining strong momentum as consumers shift toward vegan diets and seek lactose-free options, supported by growing sustainability awareness. Manufacturers are enhancing product formulations to improve taste and texture, making non-dairy alternatives more competitive with traditional dairy yogurt. At the same time, premium product offerings with innovative flavor combinations and functional benefits are expanding the market's value proposition. The integration of health-enhancing ingredients such as probiotics, vitamins, and protein is further strengthening product positioning. While traditional yogurt continues to maintain strong demand due to affordability and familiarity, non-dairy variants are witnessing faster growth. Packaging innovation and diversification in product formats are also influencing consumer purchasing behavior, supporting broader market expansion across global regions.
| Market Scope | |
|---|---|
| Start Year | 2025 |
| Forecast Year | 2026-2035 |
| Start Value | $50.4 Billion |
| Forecast Value | $90.1 Billion |
| CAGR | 6% |
The regular and traditional yogurt segment accounted for 29.9% share in 2025 and is projected to grow at a CAGR of 5% through 2035. This segment maintains a strong position due to its cost-effectiveness and widespread consumer familiarity. Its consistent demand base continues to support stable growth across both retail and foodservice channels, reinforcing its importance in the overall market structure.
The supermarkets and hypermarkets segment held a 51.8% share in 2025 and is expected to grow at a CAGR of 4.2% by 2035. These retail outlets lead distribution due to their extensive product availability and strong customer footfall. Their ability to offer multiple brands and product varieties in one location continues to make them a preferred purchasing channel for consumers.
North America Flavored Yogurt Market is projected to grow at a CAGR of 5.9% during 2026-2035. The region benefits from a well-established yogurt consumption culture, particularly in Greek and functional yogurt categories. Rising consumer focus on protein-rich and health-oriented diets is supporting market growth. Increasing demand for low-sugar, clean-label, and plant-based yogurt products is also shaping product innovation and expanding consumer reach across the region.
Key companies operating in the Global Flavored Yogurt Market include Danone S.A., Chobani, LLC, Nestle S.A., General Mills, Inc., Lactalis Group, FrieslandCampina, Arla Foods, China Mengniu Dairy Company Limited, FAGE International S.A., Fonterra Co-operative Group Limited, Saputo Inc., The Hain Celestial Group, Stonyfield Farm (Lactalis), Yakult Honsha Co., Ltd., Noosa Yoghurt, and Tata Consumer Products. Companies in the flavored yogurt market are focusing on product innovation, portfolio expansion, and health-oriented reformulations to strengthen their competitive position. Many players are investing in plant-based alternatives and functional ingredients to meet evolving consumer preferences for healthier and sustainable options. Strategic branding and premium product development are being used to capture higher-value consumer segments. Expansion of distribution networks across retail and online platforms is enhancing market accessibility. Firms are also focusing on clean-label formulations and reduced sugar content to align with health trends.
Table of Contents
Chapter 1 Methodology & Scope
- 1.1 Research approach
- 1.2 Quality Commitments
- 1.2.1 GMI AI policy & data integrity commitment
- 1.2.1.1 Source consistency protocol
- 1.2.1 GMI AI policy & data integrity commitment
- 1.3 Research Trail & Confidence Scoring
- 1.3.1 Research Trail Components
- 1.3.2 Scoring Components
- 1.4 Data Collection
- 1.4.1 Partial list of primary sources
- 1.5 Data mining sources
- 1.5.1 Paid sources
- 1.5.1.1 Sources, by region
- 1.5.1 Paid sources
- 1.6 Base estimates and calculations
- 1.6.1 Base year calculation for any one approach
- 1.7 Forecast model
- 1.7.1 Quantified market impact analysis
- 1.7.1.1 Mathematical impact of growth parameters on forecast
- 1.7.1 Quantified market impact analysis
- 1.8 Research transparency addendum
- 1.8.1 Source attribution framework
- 1.8.2 Quality assurance metrics
- 1.8.3 Our commitment to trust
Chapter 2 Executive Summary
- 2.1 Industry 360° synopsis
- 2.2 Key market trends
- 2.2.1 Regional
- 2.2.2 Product Type
- 2.2.3 Flavor Category
- 2.2.4 Packaging Type
- 2.2.5 Distribution Channel
- 2.2.6 Consumer Age Group
- 2.3 TAM Analysis, 2025-2035
- 2.4 CXO perspectives: Strategic imperatives
Chapter 3 Industry Insights
- 3.1 Industry ecosystem analysis
- 3.1.1 Supplier landscape
- 3.1.2 Profit margin
- 3.1.3 Value addition at each stage
- 3.1.4 Factor affecting the value chain
- 3.1.5 Disruptions
- 3.2 Industry impact forces
- 3.2.1 Growth drivers
- 3.2.2 Industry pitfalls and challenges
- 3.2.3 Market opportunities
- 3.3 Growth potential analysis
- 3.4 Regulatory landscape
- 3.4.1 North America
- 3.4.2 Europe
- 3.4.3 Asia Pacific
- 3.4.4 Latin America
- 3.4.5 Middle East & Africa
- 3.5 Porter's analysis
- 3.6 PESTEL analysis
- 3.7 Price trends
- 3.7.1 By region
- 3.7.2 By product type
- 3.8 Future market trends
- 3.9 Technology and Innovation landscape
- 3.9.1 Current technological trends
- 3.9.2 Emerging technologies
- 3.10 Patent Landscape
- 3.11 Trade statistics (HS code)
- 3.11.1 Major importing countries
- 3.11.2 Major exporting countries
- 3.12 Sustainability and environmental aspects
- 3.12.1 Sustainable practices
- 3.12.2 Waste reduction strategies
- 3.12.3 Energy efficiency in production
- 3.12.4 Eco-friendly initiatives
Chapter 4 Competitive Landscape, 2025
- 4.1 Introduction
- 4.2 Company market share analysis
- 4.2.1 By region
- 4.2.2 North America
- 4.2.3 Europe
- 4.2.4 Asia Pacific
- 4.2.5 LATAM
- 4.2.6 MEA
- 4.3 Company matrix analysis
- 4.4 Competitive analysis of major market players
- 4.5 Competitive positioning matrix
- 4.6 Key developments
- 4.6.1 Mergers & acquisitions
- 4.6.2 Partnerships & collaborations
- 4.6.3 New Product Launches
- 4.6.4 Expansion Plans
Chapter 5 Market Estimates and Forecast, By Product Type, 2022-2035 (USD Billion) (Kilo Tons)
- 5.1 Key trends
- 5.2 Greek Yogurt
- 5.2.1 Full-Fat Greek Yogurt
- 5.2.2 Low-Fat Greek Yogurt
- 5.2.3 Non-Fat Greek Yogurt
- 5.3 Low-Fat Yogurt
- 5.3.1 1% Milk Fat
- 5.3.2 2% Milk Fat
- 5.4 Non-Fat Yogurt
- 5.4.1 Skim Milk Based
- 5.4.2 Fat-Free Formulations
- 5.5 Regular/Traditional Yogurt
- 5.5.1 Full-Fat Traditional
- 5.5.2 Custard-Style Yogurt
- 5.6 Non-Dairy Yogurt
- 5.6.1 Almond Milk Based
- 5.6.2 Soy Milk Based
- 5.6.3 Coconut Milk Based
- 5.6.4 Oat Milk Based
- 5.6.5 Cashew & Other Nut-Based
Chapter 6 Market Estimates and Forecast, By Flavor Category, 2022-2035 (USD Billion) (Kilo Tons)
- 6.1 Key trends
- 6.2 Strawberry
- 6.3 Vanilla
- 6.4 Blueberry
- 6.5 Mixed Berry
- 6.6 Peach
- 6.7 Chocolate
- 6.8 Raspberry
- 6.9 Exotic & Others
Chapter 7 Market Estimates and Forecast, By Packaging Type, 2022-2035 (USD Billion) (Kilo Tons)
- 7.1 Key trends
- 7.2 Cup
- 7.3 Drinkable/Bottle
- 7.4 Multi-Pack
- 7.5 Pouch
- 7.6 Tube
Chapter 8 Market Estimates and Forecast, By Distribution Channel, 2022-2035 (USD Billion) (Kilo Tons)
- 8.1 Key trends
- 8.2 Supermarkets/Hypermarkets
- 8.2.1 National Supermarket Chains
- 8.2.2 Regional Hypermarkets
- 8.2.3 Warehouse Clubs
- 8.3 Convenience Stores
- 8.3.1 Urban Convenience Stores
- 8.3.2 Gas Station Convenience
- 8.3.3 Neighborhood Stores
- 8.4 Online Retail
- 8.4.1 E-commerce Platforms
- 8.4.2 Direct-to-Consumer (D2C)
- 8.4.3 Quick Commerce/Instant Delivery
- 8.5 Drugstores/Pharmacies
- 8.5.1 Chain Drugstores
- 8.5.2 Independent Pharmacies
- 8.6 Others
- 8.6.1 Specialty Health Food Stores
- 8.6.2 Foodservice/HoReCa
- 8.6.3 Vending Machines
Chapter 9 Market Estimates and Forecast, By Consumer Age Group, 2022-2035 (USD Billion) (Kilo Tons)
- 9.1 Key trends
- 9.2 Kids (0-12 years)
- 9.2.1 Toddlers (0-3 years)
- 9.2.2 Preschool (4-5 years)
- 9.2.3 School-Age Children (6-12 years)
- 9.3 Adults (13-64 years)
- 9.3.1 Teens (13-19 years)
- 9.3.2 Young Adults (20-35 years)
- 9.3.3 Middle-Age Adults (36-64 years)
- 9.4 Seniors (65+ years)
- 9.4.1 Active Seniors (65-75 years)
- 9.4.2 Elderly (76+ years)
Chapter 10 Market Estimates and Forecast, By Region, 2022-2035 (USD Billion) (Kilo Tons)
- 10.1 Key trends
- 10.2 North America
- 10.2.1 U.S.
- 10.2.2 Canada
- 10.3 Europe
- 10.3.1 Germany
- 10.3.2 UK
- 10.3.3 France
- 10.3.4 Spain
- 10.3.5 Italy
- 10.3.6 Rest of Europe
- 10.4 Asia Pacific
- 10.4.1 China
- 10.4.2 India
- 10.4.3 Japan
- 10.4.4 Australia
- 10.4.5 South Korea
- 10.4.6 Rest of Asia Pacific
- 10.5 Latin America
- 10.5.1 Brazil
- 10.5.2 Mexico
- 10.5.3 Argentina
- 10.5.4 Rest of Latin America
- 10.6 Middle East and Africa
- 10.6.1 Saudi Arabia
- 10.6.2 South Africa
- 10.6.3 UAE
- 10.6.4 Rest of Middle East and Africa
Chapter 11 Company Profiles
- 11.1 Arla Foods
- 11.2 China Mengniu Dairy Company Limited
- 11.3 Chobani, LLC
- 11.4 Danone S.A.
- 11.5 FAGE International S.A.
- 11.6 Fonterra Co-operative Group Limited
- 11.7 Friesland Campina
- 11.8 General Mills, Inc.
- 11.9 Lactalis Group
- 11.10 Nestle S.A.
- 11.11 Noosa Yoghurt
- 11.12 Saputo Inc.
- 11.13 The Hain Celestial Group
- 11.14 Stonyfield Farm (Lactalis)
- 11.15 Yakult Honsha Co., Ltd.

