
PUBLISHER: Global Market Insights Inc. | PRODUCT CODE: 2038724

PUBLISHER: Global Market Insights Inc. | PRODUCT CODE: 2038724
Electronic Paper Display Market Opportunity, Growth Drivers, Industry Trend Analysis, and Forecast 2026 - 2035
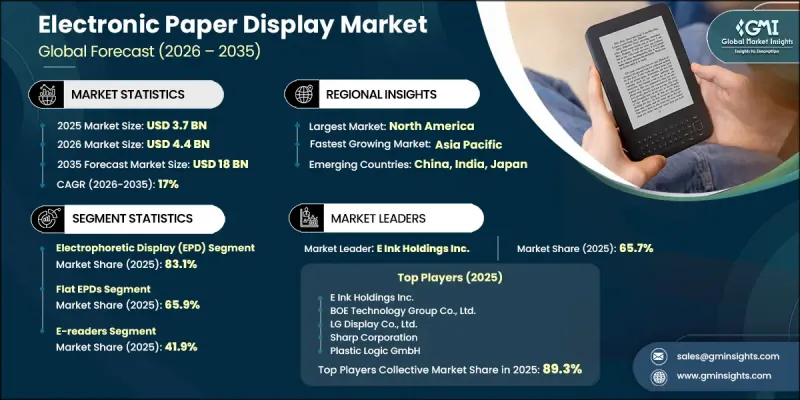
The Global Electronic Paper Display Market was valued at USD 3.7 billion in 2025 and is estimated to grow at a CAGR of 17% to reach USD 18 billion by 2035.
The electronic paper display industry is experiencing strong growth momentum, driven by rising demand for energy-efficient display solutions and increasing deployment across connected devices. Growing adoption of digital reading platforms and low-power display technologies is accelerating market expansion. The market is also benefiting from the proliferation of IoT-enabled ecosystems, where low energy consumption and extended battery life are critical requirements. Continuous advancements in flexible and color e-paper technologies are further enhancing product capabilities and broadening application areas. Additionally, increasing focus on sustainability and reduced energy consumption is encouraging the adoption of these displays across industries. Regulatory support for energy-efficient electronics and ongoing innovation in material science are strengthening the overall market outlook. Expanding commercial applications and the push toward smarter, connected infrastructure continue to support long-term growth across global regions.
| Market Scope | |
|---|---|
| Start Year | 2025 |
| Forecast Year | 2026-2035 |
| Start Value | $3.7 Billion |
| Forecast Value | $18 Billion |
| CAGR | 17% |
The growth of the electronic paper display market is further supported by rising emphasis on sustainability and energy conservation across major regions. Regulatory frameworks are encouraging the use of low-power electronic solutions, which aligns with the operational advantages of electronic paper displays. Ongoing innovation in electronic ink and flexible display technologies is enhancing product performance and enabling wider adoption across various applications. Continuous technological development is strengthening the competitiveness of electronic paper solutions in modern display ecosystems.
The electrophoretic display segment reached 83.1% share in 2025. This segment maintains leadership due to its minimal power consumption, high visibility in different lighting conditions, and strong adoption across multiple applications. Its ability to deliver a paper-like viewing experience while maintaining energy efficiency continues to drive demand.
The flat panel segment held a 65.9% share in 2025, supported by widespread commercialization, cost advantages at scale, and extensive deployment across multiple industries. These displays are widely adopted due to their durability, clarity, and low energy requirements, making them suitable for a range of applications.
North America Electronic Paper Display Market accounted for 31.3% share in 2025. Growth in the region is driven by increasing adoption of digital display solutions, strong investment in smart infrastructure, and rising demand for energy-efficient technologies. The expansion of connected systems and advanced retail technologies continues to support market growth across the region.
Key players operating in the Global Electronic Paper Display Industry include E Ink Holdings Inc., BOE Technology Group Co., Ltd., LG Display Co., Ltd., Sharp Corporation, Plastic Logic GmbH, Pervasive Displays Inc., OED Technologies Co., Ltd., DKE Co., Ltd., Tianma Microelectronics Co., Ltd., Visionect, CLEARink Displays Inc., AUO Display Plus, SOLUM, Hanshow Technology, and NEWFACE Optoelectronics Co., Ltd. Companies in the electronic paper display market are focusing on innovation, partnerships, and expansion strategies to strengthen their competitive position. Significant investments in research and development are driving advancements in flexible, color, and high-performance display technologies. Strategic collaborations with technology providers and device manufacturers are enabling broader product integration and market reach. Firms are also expanding their manufacturing capabilities to meet growing demand while optimizing production costs. Geographic expansion into emerging markets and diversification of application areas are further supporting growth.
Table of Contents
Chapter 1 Methodology and Scope
- 1.1 Market scope and definition
- 1.2 Research design
- 1.2.1 Research approach
- 1.2.2 Data collection methods
- 1.3 Data mining sources
- 1.3.1 Global
- 1.3.2 Regional/Country
- 1.4 Base estimates and calculations
- 1.4.1 Base year calculation
- 1.4.2 Key trends for market estimation
- 1.5 Primary research and validation
- 1.5.1 Primary sources
- 1.6 Forecast model
- 1.7 Research assumptions and limitations
Chapter 2 Executive Summary
- 2.1 Industry 360° synopsis, 2022 - 2035
- 2.2 Key market trends
- 2.2.1 Technology trends
- 2.2.2 Display Type trends
- 2.2.3 Application trends
- 2.2.4 End-user Industry trends
- 2.2.5 Regional trends
- 2.3 TAM Analysis, 2026-2035
- 2.4 CXO perspectives: Strategic imperatives
Chapter 3 Industry Insights
- 3.1 Industry ecosystem analysis
- 3.1.1 Supplier Landscape
- 3.1.2 Profit Margin
- 3.1.3 Cost structure
- 3.1.4 Value addition at each stage
- 3.1.5 Factor affecting the value chain
- 3.1.6 Disruptions
- 3.2 Industry impact forces
- 3.2.1 Growth drivers
- 3.2.1.1 Increasing demand for energy-efficient and low-power display technologies
- 3.2.1.2 Rising adoption of e-readers and digital reading devices
- 3.2.1.3 Growing deployment of electronic shelf labels (ESLs) in retail
- 3.2.1.4 Expansion of IoT-enabled smart devices and applications
- 3.2.1.5 Advancements in flexible and color electronic paper display technologies
- 3.2.2 Industry pitfalls and challenges
- 3.2.2.1 High refresh latency and limited video capability
- 3.2.2.2 Higher initial costs compared to LCD and OLED technologies
- 3.2.3 Market opportunities
- 3.2.3.1 Integration of e-paper displays in smart packaging and labeling
- 3.2.3.2 Emergence of e-paper in public information and transportation systems
- 3.2.1 Growth drivers
- 3.3 Growth potential analysis
- 3.4 Regulatory landscape
- 3.4.1 North America
- 3.4.2 Europe
- 3.4.3 Asia Pacific
- 3.4.4 Latin America
- 3.4.5 Middle East & Africa
- 3.5 Porter's analysis
- 3.6 PESTEL analysis
- 3.7 Technology and Innovation landscape
- 3.7.1 Current technological trends
- 3.7.2 Emerging technologies
- 3.8 Price trends (Based on paid Database)
- 3.8.1 Historical Price Analysis (2022-2025)
- 3.8.2 Price Trend Drivers
- 3.8.3 Regional Price Variations
- 3.8.4 Price Forecast (2026-2035)
- 3.9 Trade Data Analysis (Driven by Primary Research)
- 3.9.1 Import/Export Volume & Value Trends
- 3.9.2 Key Trade Corridors & Tariff Impact
- 3.10 Impact of AI & Generative AI on the Market
- 3.10.1 AI-Driven Disruption of Existing Business Models
- 3.10.2 GenAI Use Cases & Adoption Roadmap by Segment
- 3.10.3 Risks, Limitations & Regulatory Considerations
- 3.11 Capacity & Production Landscape (Driven by Primary Research)
- 3.11.1 Installed Capacity by Region & Key Producer
- 3.11.2 Capacity Utilization Rates & Expansion Pipelines
Chapter 4 Competitive Landscape, 2025
- 4.1 Introduction
- 4.2 Company market share analysis
- 4.2.1 By region
- 4.2.1.1 North America
- 4.2.1.2 Europe
- 4.2.1.3 Asia Pacific
- 4.2.1.4 Latin America
- 4.2.1.5 Middle East & Africa
- 4.2.2 Market concentration analysis
- 4.2.1 By region
- 4.3 Competitive analysis of major market players
- 4.4 Competitive positioning matrix
- 4.5 Key developments
- 4.5.1 Mergers & acquisitions
- 4.5.2 Partnerships & collaborations
- 4.5.3 New product launches
- 4.5.4 Expansion plans and funding
- 4.6 Company tier benchmarking
- 4.6.1 Tier classification criteria & qualifying thresholds
- 4.6.2 Tier positioning matrix by revenue, geography & innovation
Chapter 5 Market Estimates and Forecast, By Technology, 2022 - 2035 (USD Million & Units)
- 5.1 Key trends
- 5.2 Electrophoretic Display (EPD)
- 5.3 Electrowetting display
- 5.4 Electrochromic display
- 5.5 Cholesteric LCD
- 5.6 Electro-fluidic display
- 5.7 Others
Chapter 6 Market Estimates and Forecast, By Display Type, 2022 - 2035 (USD Million & Units)
- 6.1 Key trends
- 6.2 Flat EPDs
- 6.3 Curved EPDs
- 6.4 Flexible EPDs
- 6.4.1 Rollable displays
- 6.4.2 Bendable displays
- 6.5 Foldable EPDs
- 6.5.1 Single-fold displays
- 6.5.2 Multi-fold displays
Chapter 7 Market Estimates and Forecast, By Application, 2022 - 2035 (USD Million & Units)
- 7.1 Key trends
- 7.2 E-Readers
- 7.3 Electronic Shelf Labels (ESL)
- 7.4 Digital signage
- 7.5 Smart labels & cards
- 7.6 Wearable devices
- 7.7 Auxiliary/secondary PC displays
- 7.8 Others
Chapter 8 Market Estimates and Forecast, By End-use Industry, 2022 - 2035 (USD Million & Units)
- 8.1 Key trends
- 8.2 Consumer electronics
- 8.2.1 Personal reading devices
- 8.2.2 Home automation & smart home displays
- 8.2.3 Consumer wearables
- 8.2.4 Others
- 8.3 Retail
- 8.3.1 In-store electronic shelf labels
- 8.3.2 Point-of-sale displays
- 8.3.3 Retail advertising & promotion
- 8.3.4 Others
- 8.4 Healthcare
- 8.4.1 Diagnostic equipment displays
- 8.4.2 Patient monitoring devices
- 8.4.3 Hospital information systems
- 8.4.4 Others
- 8.5 Transportation
- 8.6 Government & defense
- 8.7 Industrial
- 8.8 Media & entertainment
- 8.9 Others
Chapter 9 Market Estimates and Forecast, By Region, 2022 - 2035 (USD Million & Units)
- 9.1 Key trends
- 9.2 North America
- 9.2.1 U.S.
- 9.2.2 Canada
- 9.3 Europe
- 9.3.1 Germany
- 9.3.2 UK
- 9.3.3 France
- 9.3.4 Spain
- 9.3.5 Italy
- 9.3.6 Netherlands
- 9.4 Asia Pacific
- 9.4.1 China
- 9.4.2 India
- 9.4.3 Japan
- 9.4.4 Australia
- 9.4.5 South Korea
- 9.5 Latin America
- 9.5.1 Brazil
- 9.5.2 Mexico
- 9.5.3 Argentina
- 9.6 Middle East and Africa
- 9.6.1 South Africa
- 9.6.2 Saudi Arabia
- 9.6.3 UAE
Chapter 10 Company Profiles
- 10.1 Global Players
- 10.1.1 E Ink Holdings Inc.
- 10.1.2 BOE Technology Group Co., Ltd.
- 10.1.3 LG Display Co., Ltd.
- 10.1.4 Sharp Corporation
- 10.1.5 AUO Display Plus
- 10.1.6 Visionect
- 10.1.7 CLEARink Displays Inc.
- 10.2 Regional Players
- 10.2.1 Plastic Logic GmbH
- 10.2.2 Pervasive Displays Inc.
- 10.2.3 OED Technologies Co., Ltd.
- 10.2.4 Tianma Microelectronics Co., Ltd.
- 10.2.5 SOLUM (Samsung Spin-off)
- 10.2.6 Hanshow Technology
- 10.2.7 NEWFACE Optoelectronics Co., Ltd.
- 10.3 Local Players
- 10.3.1 DKE Co., Ltd.

