
PUBLISHER: Global Market Insights Inc. | PRODUCT CODE: 2038796

PUBLISHER: Global Market Insights Inc. | PRODUCT CODE: 2038796
Data Center Switch Market Opportunity, Growth Drivers, Industry Trend Analysis, and Forecast 2026 - 2035
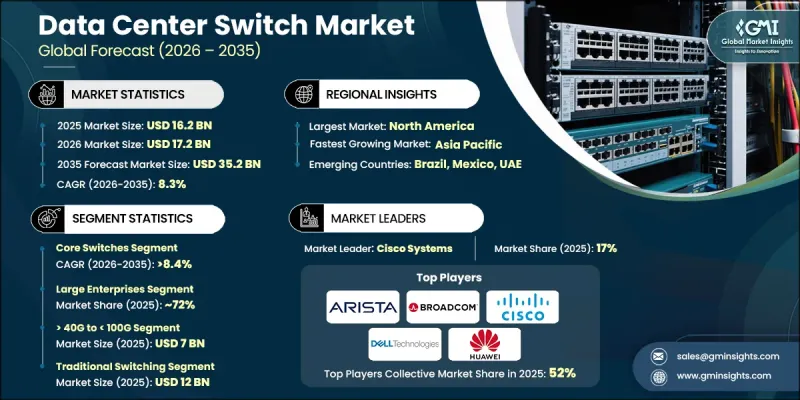
The Global Data Center Switch Market was valued at USD 16.2 billion in 2025 and is estimated to grow at a CAGR of 8.3% to reach USD 35.2 billion by 2035.
The market is witnessing momentum due to the rapid expansion of hyperscale and colocation facilities, rising enterprise adoption of cloud-based infrastructure, and increasing deployment of artificial intelligence and machine learning workloads that require high-speed, low-latency data transfer. Growing demand for scalable and efficient networking solutions across cloud service providers, telecom operators, government organizations, and large enterprises is further strengthening industry growth. Enterprises are increasingly prioritizing advanced switching infrastructure to handle exponential data growth, improve bandwidth utilization, and ensure uninterrupted application performance. This shift is accelerating the replacement of legacy networking systems with software-driven and intelligent switching architectures. Modern solutions enable centralized traffic management, automated network orchestration, and real-time monitoring, which enhance operational efficiency while reducing downtime and improving system responsiveness. The rising focus on hybrid cloud environments, distributed computing models, and data-intensive applications is also driving sustained demand for next-generation data center switching technologies across global markets.
| Market Scope | |
|---|---|
| Start Year | 2025 |
| Forecast Year | 2026-2035 |
| Start Value | $16.2 Billion |
| Forecast Value | $35.2 Billion |
| CAGR | 8.3% |
The core switches segment accounted for 59% share in 2025 and is projected to grow at a CAGR of 8.4% from 2026 to 2035. This segment continues to lead due to its essential role in managing high-volume traffic, enabling ultra-low latency communication, and supporting backbone connectivity within hyperscale, enterprise, and colocation data center ecosystems. Core switching infrastructure remains fundamental for ensuring high-speed data exchange and efficient workload distribution across complex network environments.
The large enterprises segment held 72% share in 2025 and is expected to expand at a CAGR of 7.9% through 2035. Strong adoption of advanced networking frameworks, private cloud deployments, and hyperscale data infrastructure across sectors such as BFSI, healthcare, retail, manufacturing, IT services, and telecommunications is driving this segment. Increasing demand for high-performance connectivity, secure multi-cloud integration, and AI-ready processing capabilities is accelerating deployment of advanced switching systems across large-scale organizations.
U.S. Data Center Switch Market held an 83% share in 2025, generating USD 5.4 billion. The country continues to lead due to its strong concentration of hyperscale data center operators, cloud service providers, and technology enterprises. High-density digital infrastructure and ongoing expansion of advanced networking ecosystems are supporting widespread adoption of high-speed switching technologies across enterprise and cloud environments.
Prominent companies operating in the Data Center Switch Industry include Cisco Systems, Arista Networks, Juniper Networks, Broadcom, Dell Technologies, Hewlett Packard Enterprise, Extreme Networks, Huawei Technologies, Nokia, and NEC. Companies in the Data Center Switch Market are focusing on strengthening their competitive position through continuous innovation in high-speed networking solutions and software-defined architectures. They are investing heavily in AI-driven network automation, advanced telemetry systems, and intelligent traffic management capabilities to enhance performance and scalability. Expansion of product portfolios with high-capacity Ethernet switches and low-latency solutions is helping address growing data demands. Strategic collaborations with cloud providers and enterprise customers are enabling wider market penetration. Firms are also enhancing R&D capabilities to support next-generation cloud-native infrastructure and multi-cloud environments.
Table of Contents
Chapter 1 Methodology & Scope
- 1.1 Research approach
- 1.2 Quality Commitments
- 1.2.1 GMI AI policy & data integrity commitment
- 1.2.1.1 Source consistency protocol
- 1.2.1 GMI AI policy & data integrity commitment
- 1.3 Research Trail & Confidence Scoring
- 1.3.1 Research Trail Components
- 1.3.2 Scoring Components
- 1.4 Data Collection
- 1.4.1 Partial list of primary sources
- 1.5 Data mining sources
- 1.5.1 Paid sources
- 1.5.1.1 Sources, by region
- 1.5.1 Paid sources
- 1.6 Base estimates and calculations
- 1.6.1 Base year calculation
- 1.7 Forecast model
- 1.7.1 Quantified market impact analysis
- 1.7.1.1 Mathematical impact of growth parameters on forecast
- 1.7.1 Quantified market impact analysis
- 1.8 Research transparency addendum
- 1.8.1 Source attribution framework
- 1.8.2 Quality assurance metrics
- 1.8.3 Our commitment to trust
Chapter 2 Executive Summary
- 2.1 Industry 360° synopsis
- 2.2 Key market trends
- 2.2.1 Regional
- 2.2.2 Type
- 2.2.3 Port Speed
- 2.2.4 Technology
- 2.2.5 Organization Size
- 2.2.6 End Use
- 2.3 TAM Analysis, 2026-2035
- 2.4 CXO perspectives: Strategic imperatives
Chapter 3 Industry Insights
- 3.1 Industry ecosystem analysis
- 3.1.1 Supplier Landscape
- 3.1.2 Profit Margin
- 3.1.3 Cost structure
- 3.1.4 Value addition at each stage
- 3.1.5 Factor affecting the value chain
- 3.1.6 Disruptions
- 3.2 Industry impact forces
- 3.2.1 Growth drivers
- 3.2.1.1 Rapid expansion of hyperscale and colocation data centers
- 3.2.1.2 Rising enterprise cloud migration and digital transformation
- 3.2.1.3 Growing AI, ML, and high-performance computing workloads
- 3.2.1.4 Telecom infrastructure modernization and 5G rollout
- 3.2.2 Industry pitfalls & challenges
- 3.2.2.1 High deployment and infrastructure costs
- 3.2.2.2 Power consumption and grid capacity constraints
- 3.2.3 Market opportunities
- 3.2.3.1 Expansion of edge data centers and regional hubs
- 3.2.3.2 Rising demand for AI-ready and >100G switching solutions
- 3.2.3.3 Integration with cloud and multi-cloud ecosystems
- 3.2.3.4 Sustainability and energy-efficient switch deployment
- 3.2.1 Growth drivers
- 3.3 Growth potential analysis
- 3.4 Regulatory landscape
- 3.4.1 North America
- 3.4.1.1 U.S. - Regulatory Standards for Data Center Networking Equipment, Cybersecurity, and Energy Efficiency Compliance
- 3.4.1.2 Canada - National Policies on Data Center Infrastructure, Network Security, and Environmental Standards
- 3.4.2 Europe
- 3.4.2.1 UK - Data Center Network Regulations under Data Protection, Cybersecurity, and Sustainability Frameworks
- 3.4.2.2 Germany - EU-Driven Compliance for Data Center Switches Focused on Energy Efficiency and Data Security
- 3.4.2.3 France - Regulatory Guidelines for Data Center Networking Equipment and Green Data Center Initiatives
- 3.4.3 Asia Pacific
- 3.4.3.1 India - Emerging Regulations for Data Center Infrastructure, Data Localization, and Network Security Standards
- 3.4.3.2 China - State Regulations for Data Center Networking, Cybersecurity, and Domestic Technology Standards
- 3.4.3.3 Japan - National Standards for Data Center Networking Equipment and Energy-Efficient Infrastructure
- 3.4.4 Latin America
- 3.4.4.1 Brazil - Data Protection and Infrastructure Regulations Impacting Data Center Network Equipment
- 3.4.5 Middle East & Africa
- 3.4.5.1 UAE - Data Center Network Regulations under Digital Transformation and Smart Infrastructure Policies
- 3.4.1 North America
- 3.5 Technology and Innovation Landscape
- 3.5.1 Current technological trends
- 3.5.2 Emerging technologies
- 3.6 Pricing Analysis (Driven by Primary Research)
- 3.6.1 Historical Price Trend Analysis
- 3.6.2 Pricing Strategy by Player Type
- 3.7 Porter's analysis
- 3.8 PESTEL analysis
- 3.9 Patent analysis (Driven by Primary Research)
- 3.10 Trade Data Analysis (Based on Paid Database)
- 3.10.1 Import/Export Volume & Value Trends
- 3.10.2 Key Trade Corridors & Tariff Impact
- 3.11 Impact of AI & Generative AI on the Market (Driven by Primary Research)
- 3.11.1 AI-Driven Disruption of Existing Business Models
- 3.11.2 GenAI Use Cases & Adoption Roadmap by Segment
- 3.11.3 Risks, Limitations & Regulatory Considerations
- 3.12 Capacity & Production Landscape (Driven by Primary Research)
- 3.12.1 Production Capacity by Region & Key Producer
- 3.12.2 Capacity Utilization Rates & Expansion Pipelines
- 3.13 Sustainability and environmental aspects
- 3.13.1 Sustainable practices
- 3.13.2 Waste reduction strategies
- 3.13.3 Energy efficiency in production
- 3.13.4 Eco-friendly initiatives
- 3.13.5 Carbon footprint considerations
- 3.14 Forecast assumptions & scenario analysis (Driven by Primary Research)
- 3.14.1 Base Case - Key Macro & Industry Variables Driving CAGR
- 3.14.2 Optimistic Scenarios - Favorable macro and industry tailwinds
- 3.14.3 Pessimistic Scenario - Macroeconomic slowdown or industry headwinds
Chapter 4 Competitive Landscape, 2025
- 4.1 Introduction
- 4.2 Company market share analysis
- 4.2.1 North America
- 4.2.2 Europe
- 4.2.3 Asia Pacific
- 4.2.4 Latin America
- 4.2.5 Middle East & Africa
- 4.3 Competitive analysis of major market players
- 4.4 Competitive positioning matrix
- 4.5 Strategic outlook matrix
- 4.6 Key developments
- 4.6.1 Mergers & acquisitions
- 4.6.2 Partnerships & collaborations
- 4.6.3 New product launches
- 4.6.4 Expansion plans and funding
- 4.7 Company Tier Benchmarking
- 4.7.1 Tier Classification Criteria & Qualifying Thresholds
- 4.7.2 Tier Positioning Matrix by Revenue, Geography & Innovation
Chapter 5 Market Estimates & Forecast, By Type, 2022 - 2035 ($Bn, Units)
- 5.1 Key trends
- 5.2 Core Switches
- 5.3 Access Switches
- 5.4 Distribution Switches
Chapter 6 Market Estimates & Forecast, By Port Speed, 2022 - 2035 ($Bn, Units)
- 6.1 Key trends
- 6.2 > 40G to < 100G
- 6.3 > 100G
- 6.4 >10G to < 40G
- 6.5 Less than 10G
Chapter 7 Market Estimates & Forecast, By Technology, 2022 - 2035 ($Bn, Units)
- 7.1 Key trends
- 7.2 Traditional Switching
- 7.3 Software-Defined Networking (SDN)
Chapter 8 Market Estimates & Forecast, By Organization Size, 2022 - 2035 ($Bn, Units)
- 8.1 Key trends
- 8.2 Large Enterprises
- 8.3 SMEs
Chapter 9 Market Estimates & Forecast, By End Use, 2022 - 2035 ($Bn, Units)
- 9.1 Key trends
- 9.2 Cloud Service Providers
- 9.3 Enterprises
- 9.4 Telecommunications
- 9.5 Government
Chapter 10 Market Estimates & Forecast, By Region, 2022 - 2035 ($Bn, Units)
- 10.1 Key trends
- 10.2 North America
- 10.2.1 US
- 10.2.2 Canada
- 10.3 Europe
- 10.3.1 UK
- 10.3.2 Germany
- 10.3.3 France
- 10.3.4 Italy
- 10.3.5 Spain
- 10.3.6 Belgium
- 10.3.7 Netherlands
- 10.3.8 Sweden
- 10.4 Asia Pacific
- 10.4.1 China
- 10.4.2 India
- 10.4.3 Japan
- 10.4.4 Australia
- 10.4.5 Singapore
- 10.4.6 South Korea
- 10.4.7 Vietnam
- 10.4.8 Indonesia
- 10.5 Latin America
- 10.5.1 Brazil
- 10.5.2 Mexico
- 10.5.3 Argentina
- 10.6 MEA
- 10.6.1 UAE
- 10.6.2 South Africa
- 10.6.3 Saudi Arabia
Chapter 11 Company Profiles
- 11.1 Global Player
- 11.1.1 Arista Networks
- 11.1.2 Broadcom
- 11.1.3 Cisco Systems
- 11.1.4 Dell Technologies
- 11.1.5 Extreme Networks
- 11.1.6 Hewlett Packard Enterprise
- 11.1.7 Huawei Technologies
- 11.1.8 Juniper Networks
- 11.1.9 NEC
- 11.1.10 Nokia
- 11.2 Regional Player
- 11.2.1 Amper
- 11.2.2 Atos
- 11.2.3 Cellnex Telecom
- 11.2.4 Colt Technology Services
- 11.2.5 Ericsson
- 11.2.6 Indra Sistemas
- 11.2.7 Orange Business
- 11.2.8 Schneider Electric
- 11.2.9 Siemens
- 11.2.10 Telefonica

