
PUBLISHER: Global Market Insights Inc. | PRODUCT CODE: 2045690

PUBLISHER: Global Market Insights Inc. | PRODUCT CODE: 2045690
Vacuum Salt Market Opportunity, Growth Drivers, Industry Trend Analysis, and Forecast 2026 - 2035
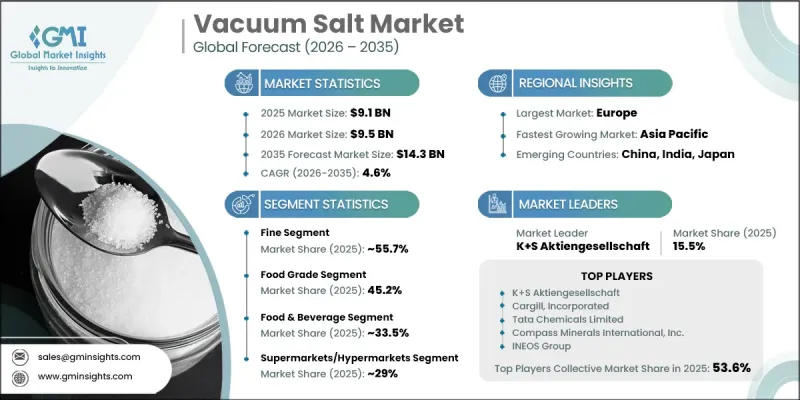
The Global Vacuum Salt Market was valued at USD 9.1 billion in 2025 and is estimated to grow at a CAGR of 4.6% to reach USD 14.3 billion by 2035.
Expansion is driven by the growing requirement for high-purity salt products that meet strict quality and safety standards. Vacuum salt, produced through the evaporation of brine under controlled vacuum conditions, is widely recognized for its high purity, uniform grain structure, and low impurity levels. These characteristics make it highly suitable for food processing, pharmaceutical formulations, and industrial chemical production. Its applications extend across food preservation, flavor enhancement, chlorine production, caustic soda manufacturing, water treatment, and softening processes. Rising consumer awareness regarding product purity and health considerations is further supporting demand for additive-free salt solutions. Industrial growth and urban development are also contributing to consistent consumption across end-use sectors. As industries continue to prioritize quality and efficiency, the global vacuum salt market is expected to maintain stable growth momentum driven by expanding applications and technological improvements in production processes.
| Market Scope | |
|---|---|
| Start Year | 2025 |
| Forecast Year | 2026-2035 |
| Start Value | $9.1 Billion |
| Forecast Value | $14.3 Billion |
| CAGR | 4.6% |
The fine salt segment accounted for 55.7% share in 2025 and is expected to grow at a CAGR of 4.9% through 2035. This segment remains widely preferred due to its high purity and consistent particle size, making it suitable for applications requiring precision and quality. Fine salt is increasingly used in food processing and pharmaceutical applications where controlled formulation is essential. Its uniform structure supports accurate blending and improved product consistency, strengthening its adoption across multiple industries.
The food grade segment held a 45.2% share in 2025 and is projected to grow at a CAGR of 4.7% from 2026 to 2035. Demand in this segment is driven by increasing consumption of processed and packaged foods along with rising emphasis on safety and quality standards. Manufacturers are increasingly adopting high-purity salt to meet stringent regulatory requirements and consumer expectations. Industrial-grade salt continues to support chemical processing and water treatment applications, maintaining steady demand across infrastructure-driven sectors.
North America Vacuum Salt Market accounted for 20.1% share in 2025. Regional demand is supported by expanding applications across food processing, water treatment, and industrial manufacturing. The presence of advanced production systems and strict quality standards contributes to high adoption of purified salt products. Increasing focus on environmental sustainability and water purification is also strengthening demand, making the region a key contributor to global market growth.
Key companies operating in the Global Vacuum Salt Industry include ACI Limited, Cargill, Incorporated, Cheetham Salt, Compass Minerals International, Inc., Dominion Salt Limited, INEOS Group, Infosa, K+S Aktiengesellschaft, Nirma Limited, Nobian, Salins Group, Sudwestdeutsche Salzwerke AG, Tata Chemicals Limited, and WA Salt Group. Companies in the vacuum salt market are strengthening their position through capacity expansion, technological upgrades, and product quality enhancement strategies. Manufacturers are investing in advanced production technologies to improve purity levels, consistency, and operational efficiency. Strategic partnerships and distribution network expansion are helping companies reach a broader customer base across industrial and consumer segments. Many players are also focusing on sustainability initiatives, including energy-efficient production processes and reduced environmental impact. Product diversification is being adopted to cater to specialized applications in food, pharmaceuticals, and industrial processing.
Table of Contents
Chapter 1 Methodology & Scope
- 1.1 Market scope and definition
- 1.2 Research design
- 1.2.1 Research approach
- 1.2.2 Data collection methods
- 1.3 Data mining sources
- 1.3.1 Global
- 1.3.2 Regional/Country
- 1.4 Base estimates and calculations
- 1.4.1 Base year calculation
- 1.4.2 Key trends for market estimation
- 1.5 Primary research and validation
- 1.5.1 Primary sources
- 1.6 Forecast model
- 1.7 Research assumptions and limitations
Chapter 2 Executive Summary
- 2.1 Industry 360° synopsis
- 2.2 Key market trends
- 2.2.1 Regional
- 2.2.2 Product type
- 2.2.3 Grade
- 2.2.4 Application
- 2.2.5 Distribution channel
- 2.3 TAM Analysis, 2026-2035
- 2.4 CXO perspectives: Strategic imperatives
- 2.4.1 Executive decision points
Chapter 3 Industry Insights
- 3.1 Industry ecosystem analysis
- 3.1.1 Supplier landscape
- 3.1.2 Profit margin
- 3.1.3 Value addition at each stage
- 3.1.4 Factor affecting the value chain
- 3.1.5 Disruptions
- 3.2 Industry impact forces
- 3.2.1 Growth drivers
- 3.2.2 Industry pitfalls and challenges
- 3.2.3 Market opportunities
- 3.3 Growth potential analysis
- 3.4 Regulatory landscape
- 3.4.1 North America
- 3.4.2 Europe
- 3.4.3 Asia Pacific
- 3.4.4 Latin America
- 3.4.5 Middle East & Africa
- 3.5 Porter's analysis
- 3.6 PESTEL analysis
- 3.7 Price trends
- 3.7.1 By region
- 3.7.2 By type
- 3.8 Future market trends
- 3.9 Technology and Innovation landscape
- 3.9.1 Current technological trends
- 3.9.2 Emerging technologies
- 3.10 Patent Landscape
- 3.11 Trade statistics (HS code)
- 3.11.1 Major importing countries
- 3.11.2 Major exporting countries
- 3.12 Sustainability and environmental aspects
- 3.12.1 Sustainable practices
- 3.12.2 Waste reduction strategies
- 3.12.3 Energy efficiency in production
- 3.12.4 Eco-friendly initiatives
- 3.13 Carbon footprint consideration
Chapter 4 Competitive Landscape, 2025
- 4.1 Introduction
- 4.2 Company market share analysis
- 4.2.1 By region
- 4.2.1.1 North America
- 4.2.1.2 Europe
- 4.2.1.3 Asia Pacific
- 4.2.1.4 LATAM
- 4.2.1.5 MEA
- 4.2.1 By region
- 4.3 Company matrix analysis
- 4.4 Competitive analysis of major market players
- 4.5 Competitive positioning matrix
- 4.6 Key developments
- 4.6.1 Mergers & acquisitions
- 4.6.2 Partnerships & collaborations
- 4.6.3 New Product Launches
- 4.6.4 Expansion Plans
Chapter 5 Market Estimates and Forecast, By Product Type, 2022-2035 (USD Billion) (Kilo Tons)
- 5.1 Key trends
- 5.2 Granular
- 5.3 Fine
Chapter 6 Market Estimates and Forecast, By Grade, 2022-2035 (USD Billion) (Kilo Tons)
- 6.1 Key trends
- 6.2 Food grade
- 6.3 Industrial grade
- 6.4 Pharmaceutical grade
Chapter 7 Market Estimates and Forecast, By Application, 2022-2035 (USD Billion) (Kilo Tons)
- 7.1 Key trends
- 7.2 Food and beverage
- 7.3 Chemical industry
- 7.4 Water treatment
- 7.5 Pharmaceuticals
- 7.6 Others
Chapter 8 Market Estimates and Forecast, By Distribution channel, 2022-2035 (USD Billion) (Kilo Tons)
- 8.1 Key trends
- 8.2 Online retail
- 8.3 Supermarkets/hypermarkets
- 8.4 Specialty stores
- 8.5 Direct sales
- 8.6 Others
Chapter 9 Market Estimates and Forecast, By Region, 2022-2035 (USD Billion) (Kilo Tons)
- 9.1 Key trends
- 9.2 North America
- 9.2.1 U.S.
- 9.2.2 Canada
- 9.3 Europe
- 9.3.1 Germany
- 9.3.2 UK
- 9.3.3 France
- 9.3.4 Spain
- 9.3.5 Italy
- 9.3.6 Rest of Europe
- 9.4 Asia Pacific
- 9.4.1 China
- 9.4.2 India
- 9.4.3 Japan
- 9.4.4 Australia
- 9.4.5 South Korea
- 9.4.6 Rest of Asia Pacific
- 9.5 Latin America
- 9.5.1 Brazil
- 9.5.2 Mexico
- 9.5.3 Argentina
- 9.5.4 Rest of Latin America
- 9.6 Middle East and Africa
- 9.6.1 Saudi Arabia
- 9.6.2 South Africa
- 9.6.3 UAE
- 9.6.4 Rest of Middle East and Africa
Chapter 10 Company Profiles
- 10.1 K+S Aktiengesellschaft
- 10.2 Tata Chemicals Limited
- 10.3 INEOS Group
- 10.4 Nobian
- 10.5 Compass Minerals International, Inc.
- 10.6 Cargill, Incorporated
- 10.7 Sudwestdeutsche Salzwerke AG
- 10.8 Dominion Salt Limited
- 10.9 Cheetham Salt
- 10.10 WA Salt Group
- 10.11 Salins Group
- 10.12 ACI Limited
- 10.13 Infosa
- 10.14 Nirma Limited

