
PUBLISHER: Global Market Insights Inc. | PRODUCT CODE: 2045751

PUBLISHER: Global Market Insights Inc. | PRODUCT CODE: 2045751
Green Methanol Market Opportunity, Growth Drivers, Industry Trend Analysis, and Forecast 2026 - 2035
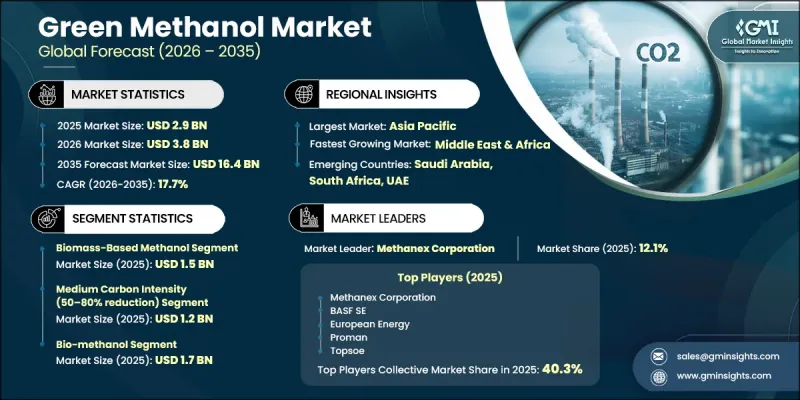
The Global Green Methanol Market was valued at USD 2.9 billion in 2025 and is estimated to grow at a CAGR of 17.7% to reach USD 16.4 billion by 2035.
Green methanol is produced using low-carbon and renewable inputs rather than conventional fossil-based sources. Production pathways primarily involve generating hydrogen via renewable-powered electrolysis and combining it with captured carbon dioxide, along with biomass gasification techniques. These approaches lower emissions while supporting the shift toward sustainable chemical production. The material is gaining traction as a cleaner substitute due to its versatility as a fuel, energy carrier, and chemical input. Its compatibility with existing infrastructure allows industries to adopt it without major operational changes, increasing its usability across transportation, power generation, and manufacturing. Demand continues to rise as organizations pursue emission reduction goals, respond to tightening environmental regulations, and transition toward circular and renewable supply chains. Interest is accelerating across multiple industries seeking sustainable solutions. Market expansion is influenced by renewable energy availability, advancements in carbon capture technologies, and the economic feasibility of biomass-based production systems.
| Market Scope | |
|---|---|
| Start Year | 2025 |
| Forecast Year | 2026-2035 |
| Start Value | $2.9 Billion |
| Forecast Value | $16.4 Billion |
| CAGR | 17.7% |
The biomass-derived methanol segment accounted for USD 1.5 billion in 2025. Industrial players are increasingly exploring this option as a renewable feedstock to support circular production models. Advancements in carbon capture technologies are also enabling the development of methanol synthesized from captured emissions, promoting the reuse of industrial carbon outputs. At the same time, the growing deployment of renewable electricity is driving interest in electrolysis-based hydrogen routes for methanol production, supporting continued technological progress.
The bio-methanol segment reached USD 1.7 billion in 2025, reflecting strong industry attention toward renewable feedstocks derived from waste streams and biomass. E-methanol is advancing alongside improved access to renewable energy, enabling production through hydrogen electrolysis combined with carbon capture. Market participants are also examining hybrid production pathways and alternative processing techniques to suit regional resource availability. These flexible approaches are broadening the technological landscape and unlocking new growth opportunities for stakeholders.
North America Green Methanol Market is anticipated to grow from USD 309.2 million in 2025 to USD 1.7 billion by 2035. Industries across the region are prioritizing renewable chemical solutions to reduce emissions while evaluating alternative feedstocks. Supportive energy policies in the United States, along with growing interest in low-carbon synthetic fuels for industrial and chemical applications, are driving market momentum.
Key players in the Global Green Methanol Market include Methanex Corporation, Topsoe, BASF SE, Sodra, Proman, Alberta-Pacific Forest Industries Inc., KAPSOM plc, Avaada, European Energy, HIF GLOBAL, Perpetual Next, Clariant AG, Avina Inc., C1 Green Chemicals AG, HaiQI Inc., Singapore Methanol, Toyo Engineering Corporation, and Enerkem. Companies operating in the green methanol market are focusing on expanding production capacity through investments in renewable energy integration and advanced processing technologies. Strategic partnerships and collaborations are being formed to strengthen supply chains and accelerate technology deployment. Many players are prioritizing research and development to improve efficiency in electrolysis and carbon capture processes. Geographic expansion into regions with abundant renewable resources is another key approach. Firms are also securing long-term agreements with industrial end users to ensure stable demand. Additionally, companies are diversifying feedstock sources, including biomass and captured carbon, to enhance flexibility and reduce dependency on a single production route. These combined strategies are helping businesses reinforce their competitive positioning and drive market growth.
Table of Contents
Chapter 1 Methodology & Scope
- 1.1 Market scope and definition
- 1.2 Research design
- 1.2.1 Research approach
- 1.2.2 Data collection methods
- 1.3 Data mining sources
- 1.3.1 Global
- 1.3.2 Regional/Country
- 1.4 Base estimates and calculations
- 1.4.1 Base year calculation
- 1.4.2 Key trends for market estimation
- 1.5 Primary research and validation
- 1.5.1 Primary sources
- 1.6 Forecast model
- 1.7 Research assumptions and limitations
Chapter 2 Executive Summary
- 2.1 Industry 360° synopsis
- 2.2 Key market trends
- 2.2.1 Feedstock
- 2.2.2 Carbon Intensity
- 2.2.3 Product by End Use
- 2.2.4 Regional
- 2.3 TAM Analysis, 2026-2035
- 2.4 CXO perspectives: Strategic imperatives
- 2.5 Future outlook and strategic recommendations
Chapter 3 Industry Insights
- 3.1 Industry ecosystem analysis
- 3.1.1 Supplier landscape
- 3.1.2 Profit margin
- 3.1.3 Value addition at each stage
- 3.1.4 Factor affecting the value chain
- 3.1.5 Disruptions
- 3.2 Industry impact forces
- 3.2.1 Growth drivers
- 3.2.1.1 Rising interest in low-carbon fuels
- 3.2.1.2 Expanding renewable energy availability
- 3.2.1.3 Increased focus on industrial decarbonization
- 3.2.2 Pitfalls/challenge
- 3.2.2.1 High production and setup costs
- 3.2.2.2 Limited large-scale supply infrastructure
- 3.2.3 Opportunities
- 3.2.3.1 Integration into chemical manufacturing pathways
- 3.2.3.2 Expansion through carbon capture technologies
- 3.2.1 Growth drivers
- 3.3 Growth potential analysis
- 3.4 Regulatory landscape
- 3.4.1 North America
- 3.4.2 Europe
- 3.4.3 Asia Pacific
- 3.4.4 Latin America
- 3.4.5 Middle East & Africa
- 3.5 Porter's analysis
- 3.6 PESTEL analysis
- 3.7 Price trends
- 3.7.1 By region
- 3.7.2 By feedstock
- 3.8 Future market trends
- 3.9 Technology and innovation landscape
- 3.9.1 Current technological trends
- 3.9.2 Emerging technologies
- 3.10 Patent landscape
- 3.11 Trade statistics (HS code)
- 3.11.1 Major importing countries
- 3.11.2 Major exporting countries
- 3.12 Sustainability and environmental aspects
- 3.12.1 Sustainable practices
- 3.12.2 Waste reduction strategies
- 3.12.3 Energy efficiency in production
- 3.12.4 Eco-friendly initiatives
- 3.13 Carbon footprint consideration
Chapter 4 Competitive Landscape, 2025
- 4.1 Introduction
- 4.2 Company market share analysis
- 4.2.1 By region
- 4.2.1.1 North America
- 4.2.1.2 Europe
- 4.2.1.3 Asia Pacific
- 4.2.1.4 LATAM
- 4.2.1.5 MEA
- 4.2.1 By region
- 4.3 Company matrix analysis
- 4.4 Competitive analysis of major market players
- 4.5 Competitive positioning matrix
- 4.6 Key developments
- 4.6.1 Mergers & acquisitions
- 4.6.2 Partnerships & collaborations
- 4.6.3 New product launches
- 4.6.4 Expansion plans
Chapter 5 Market Estimates and Forecast, By Feedstock, 2022-2035 (USD Billion) (Kilo Tons)
- 5.1 Key trends
- 5.2 Biomass-based methanol
- 5.2.1 Agricultural waste
- 5.2.2 Forestry residues
- 5.2.3 Municipal solid waste
- 5.2.4 Others
- 5.3 CO2 emissions-based methanol
- 5.3.1 Industrial CO2 Capture
- 5.3.2 Direct air capture
- 5.3.3 Others
- 5.4 Green hydrogen-based methanol
- 5.4.1 Electrolysis-derived hydrogen
- 5.4.2 Other renewable hydrogen sources
Chapter 6 Market Estimates and Forecast, By Carbon Intensity, 2022-2035 (USD Billion) (Kilo Tons)
- 6.1 Key trends
- 6.2 Low carbon intensity (<50% reduction)
- 6.3 Medium carbon intensity (50-80% reduction)
- 6.4 High carbon intensity (>80% reduction)
- 6.5 Carbon negative
Chapter 7 Market Estimates and Forecast, By Product by End Use, 2022-2035 (USD Billion) (Kilo Tons)
- 7.1 Key trends
- 7.2 Bio-methanol
- 7.2.1 By production process
- 7.2.1.1 Gasification technology
- 7.2.1.2 Fermentation technology
- 7.2.1.3 Others
- 7.2.2 By end use
- 7.2.2.1 Automotive & transportation
- 7.2.2.1.1 Marine fuel
- 7.2.2.1.2 Automotive fuel
- 7.2.2.1.3 Aviation fuel
- 7.2.2.2 Chemical industry
- 7.2.2.2.1 Formaldehyde production
- 7.2.2.2.2 Acetic acid production
- 7.2.2.2.3 Methanol-to-olefins (MTO)
- 7.2.2.2.4 Other Chemical End Uses
- 7.2.2.1 Automotive & transportation
- 7.2.3 Power
- 7.2.4 Others
- 7.2.1 By production process
- 7.3 E-methanol
- 7.3.1 By production process
- 7.3.1.1 Power-to-methanol
- 7.3.1.2 CO2 hydrogenation
- 7.3.1.3 Others
- 7.3.2 By end use
- 7.3.2.1 Automotive & transportation
- 7.3.2.1.1 Marine fuel
- 7.3.2.1.2 Automotive fuel
- 7.3.2.1.3 Aviation fuel
- 7.3.2.2 Chemical industry
- 7.3.2.2.1 Formaldehyde production
- 7.3.2.2.2 Acetic acid production
- 7.3.2.2.3 Methanol-to-olefins (MTO)
- 7.3.2.2.4 Other chemical end uses
- 7.3.2.1 Automotive & transportation
- 7.3.3 Power
- 7.3.4 Others
- 7.3.1 By production process
- 7.4 Others
- 7.4.1 By end use
- 7.4.1.1 Automotive & transportation
- 7.4.1.1.1 Marine fuel
- 7.4.1.1.2 Automotive fuel
- 7.4.1.1.3 Aviation fuel
- 7.4.1.2 Chemical industry
- 7.4.1.2.1 Formaldehyde production
- 7.4.1.2.2 Acetic acid production
- 7.4.1.2.3 Methanol-to-olefins (MTO)
- 7.4.1.2.4 Other chemical end uses
- 7.4.1.1 Automotive & transportation
- 7.4.2 Power
- 7.4.3 Others
- 7.4.1 By end use
Chapter 8 Market Estimates and Forecast, By Region, 2022-2035 (USD Billion) (Kilo Tons)
- 8.1 Key trends
- 8.2 North America
- 8.2.1 U.S.
- 8.2.2 Canada
- 8.3 Europe
- 8.3.1 Germany
- 8.3.2 UK
- 8.3.3 France
- 8.3.4 Spain
- 8.3.5 Italy
- 8.3.6 Rest of Europe
- 8.4 Asia Pacific
- 8.4.1 China
- 8.4.2 India
- 8.4.3 Japan
- 8.4.4 Australia
- 8.4.5 South Korea
- 8.4.6 Rest of Asia Pacific
- 8.5 Latin America
- 8.5.1 Brazil
- 8.5.2 Mexico
- 8.5.3 Argentina
- 8.5.4 Rest of Latin America
- 8.6 Middle East and Africa
- 8.6.1 Saudi Arabia
- 8.6.2 South Africa
- 8.6.3 UAE
- 8.6.4 Rest of Middle East and Africa
Chapter 9 Company Profiles
- 9.1 Methanex Corporation
- 9.2 Topsoe
- 9.3 BASF SE
- 9.4 Sodra
- 9.5 Proman
- 9.6 Alberta-Pacific Forest Industries Inc.
- 9.7 KAPSOM plc
- 9.8 Avaada
- 9.9 European Energy
- 9.10 HIF GLOBAL
- 9.11 Perpetual Next
- 9.12 Clariant AG
- 9.13 Avina Inc.
- 9.14 C1 Green Chemicals AG
- 9.15 HaiQI Inc.
- 9.16 Singapore Methanol
- 9.17 Toyo Engineering Corporation
- 9.18 Enerkem

