
PUBLISHER: Global Market Insights Inc. | PRODUCT CODE: 2045755

PUBLISHER: Global Market Insights Inc. | PRODUCT CODE: 2045755
Calcium Bromide Market Opportunity, Growth Drivers, Industry Trend Analysis, and Forecast 2026 - 2035
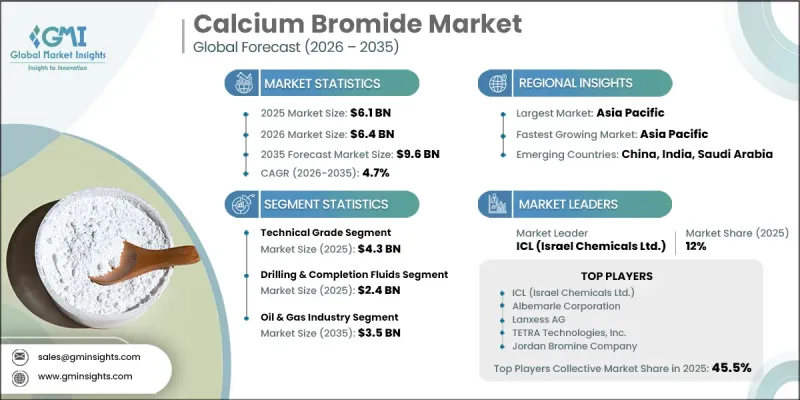
The Global Calcium Bromide Market was valued at USD 6.1 billion in 2025 and is estimated to grow at a CAGR of 4.7% to reach USD 9.6 billion by 2035.
The calcium bromide industry is expanding due to its critical role in specialized industrial operations that require high-density and highly stable chemical solutions. Calcium bromide is recognized as a highly soluble inorganic compound produced through a controlled reaction involving calcium-based materials and hydrobromic acid, resulting in a clear crystalline product with strong hygroscopic properties. Its ability to form dense brines and regulate fluid density makes it highly valuable across industrial applications, particularly in energy-related operations. The compound demonstrates strong thermal stability, corrosion resistance, and consistent performance under extreme operating conditions, which enhances its suitability for demanding environments. Continuous advancements in production technologies, including improved synthesis routes and refined purification techniques, are enabling manufacturers to achieve greater precision in product quality, purity, and concentration. These technological improvements are strengthening the reliability and performance of calcium bromide, supporting its growing adoption across industries that require efficient and stable chemical solutions.
| Market Scope | |
|---|---|
| Start Year | 2025 |
| Forecast Year | 2026-2035 |
| Start Value | $6.1 Billion |
| Forecast Value | $9.6 Billion |
| CAGR | 4.7% |
The technical grade segment generated USD 4.3 billion in 2025. This segment continues to expand due to its cost efficiency and suitability for industrial applications that require consistent density and high purity levels. Ongoing improvements in manufacturing processes have enabled the production of more uniform and reliable technical-grade materials. The segment benefits from increasing demand for dependable and economical solutions that support operational efficiency and performance.
The drilling and completion fluids segment reached USD 2.4 billion in 2025. This segment is gaining strong traction as calcium bromide-based solutions are widely used to maintain operational stability, protect formation integrity, and ensure clarity in fluid systems. The growing need for high-performance fluids capable of operating effectively under challenging conditions is driving adoption. The material's ability to deliver reliable results in complex environments continues to support its increasing use in this segment.
North America Calcium Bromide Market is expected to grow significantly from USD 1.9 billion in 2026 to USD 2.9 billion by 2035. Growth in the region is driven by rising demand for advanced fluid solutions and the continued adoption of modern extraction and processing technologies. Expanding industrial activities and the increasing focus on efficiency and performance optimization are further supporting market development.
Key companies operating in the Global Calcium Bromide Market include Albemarle Corporation, ICL (Israel Chemicals Ltd.), Lanxess AG, TETRA Technologies, Inc., Jordan Bromine Company, Tata Chemicals Limited, Neogen Chemicals Limited, Weifang Rixing Chemical, Qingdao Win Chemistry, and Gulf Resources Inc. Companies in the calcium bromide market are implementing a range of strategic initiatives to strengthen their market position. Organizations are focusing on enhancing production capabilities through advanced manufacturing technologies and process optimization to improve product quality and consistency. Investment in research and development is enabling innovation in formulation and application performance. Strategic partnerships and long-term supply agreements are being used to secure raw material availability and expand market reach. Companies are also prioritizing geographic expansion to tap into emerging demand and strengthen distribution networks. Additionally, there is a growing emphasis on sustainability and operational efficiency, with firms adopting environmentally responsible practices and improving cost structures to remain competitive in a dynamic market environment.
Table of Contents
Chapter 1 Methodology & Scope
- 1.1 Market scope and definition
- 1.2 Research design
- 1.2.1 Research approach
- 1.2.2 Data collection methods
- 1.3 Data mining sources
- 1.3.1 Global
- 1.3.2 Regional/Country
- 1.4 Base estimates and calculations
- 1.4.1 Base year calculation
- 1.4.2 Key trends for market estimation
- 1.5 Primary research and validation
- 1.5.1 Primary sources
- 1.6 Forecast model
- 1.7 Research assumptions and limitations
Chapter 2 Executive Summary
- 2.1 Industry 360° synopsis
- 2.2 Key market trends
- 2.2.1 Grade
- 2.2.2 Application
- 2.2.3 End Use
- 2.2.4 Regional
- 2.3 TAM Analysis, 2026-2035
- 2.4 CXO perspectives: Strategic imperatives
Chapter 3 Industry Insights
- 3.1 Industry ecosystem analysis
- 3.1.1 Supplier landscape
- 3.1.2 Profit margin
- 3.1.3 Value addition at each stage
- 3.1.4 Factor affecting the value chain
- 3.1.5 Disruptions
- 3.2 Industry impact forces
- 3.2.1 Growth drivers
- 3.2.2 Industry pitfalls and challenges
- 3.2.3 Market opportunities
- 3.3 Growth potential analysis
- 3.4 Regulatory landscape
- 3.4.1 North America
- 3.4.2 Europe
- 3.4.3 Asia Pacific
- 3.4.4 Latin America
- 3.4.5 Middle East & Africa
- 3.5 Porter's analysis
- 3.6 PESTEL analysis
- 3.7 Price trends
- 3.7.1 By region
- 3.7.2 By product type
- 3.8 Future market trends
- 3.9 Technology and Innovation landscape
- 3.9.1 Current technological trends
- 3.9.2 Emerging technologies
- 3.10 Patent Landscape
- 3.11 Trade statistics (HS code)
- 3.11.1 Major importing countries
- 3.11.2 Major exporting countries
- 3.12 Sustainability and environmental aspects
- 3.12.1 Sustainable practices
- 3.12.2 Waste reduction strategies
- 3.12.3 Energy efficiency in production
- 3.12.4 Eco-friendly initiatives
- 3.13 Carbon footprint consideration
Chapter 4 Competitive Landscape, 2025
- 4.1 Introduction
- 4.2 Company market share analysis
- 4.2.1 By region
- 4.2.1.1 North America
- 4.2.1.2 Europe
- 4.2.1.3 Asia Pacific
- 4.2.1.4 LATAM
- 4.2.1.5 MEA
- 4.2.1 By region
- 4.3 Competitive analysis of major market players
- 4.4 Competitive positioning matrix
- 4.5 Key developments
- 4.5.1 Mergers & acquisitions
- 4.5.2 Partnerships & collaborations
- 4.5.3 New Product Launches
- 4.5.4 Expansion Plans
Chapter 5 Market Estimates and Forecast, By Grade, 2022-2035 (USD Billion) (Kilo Tons)
- 5.1 Key trends
- 5.2 Technical grade
- 5.3 Reagent grade
- 5.4 Food grade
Chapter 6 Market Estimates and Forecast, By Application, 2022-2035 (USD Million) (Kilo Tons)
- 6.1 Key trends
- 6.2 Drilling & Completion Fluids
- 6.3 Enhanced Oil Recovery
- 6.4 Fluids and brines
- 6.5 Oil Well Cementing
- 6.6 Others (water treatment and fire retardants)
Chapter 7 Market Estimates and Forecast, By End Use, 2022-2035 (USD Million) (Kilo Tons)
- 7.1 Key trends
- 7.2 Oil & Gas Industry
- 7.3 Chemical Industry
- 7.4 Construction Industry
- 7.5 Pharmaceutical Industry
- 7.6 Food & Beverage Industry
- 7.7 Others
Chapter 8 Market Estimates and Forecast, By Region, 2022-2035 (USD Million) (Kilo Tons)
- 8.1 Key trends
- 8.2 North America
- 8.2.1 U.S.
- 8.2.2 Canada
- 8.3 Europe
- 8.3.1 Germany
- 8.3.2 UK
- 8.3.3 France
- 8.3.4 Spain
- 8.3.5 Italy
- 8.3.6 Rest of Europe
- 8.4 Asia Pacific
- 8.4.1 China
- 8.4.2 India
- 8.4.3 Japan
- 8.4.4 Australia
- 8.4.5 South Korea
- 8.4.6 Rest of Asia Pacific
- 8.5 Latin America
- 8.5.1 Brazil
- 8.5.2 Mexico
- 8.5.3 Argentina
- 8.5.4 Rest of Latin America
- 8.6 Middle East and Africa
- 8.6.1 Saudi Arabia
- 8.6.2 South Africa
- 8.6.3 UAE
- 8.6.4 Rest of Middle East and Africa
Chapter 9 Company Profiles
- 9.1 ICL (Israel Chemicals Ltd.)
- 9.2 Albemarle Corporation
- 9.3 Lanxess AG
- 9.4 TETRA Technologies, Inc.
- 9.5 Jordan Bromine Company
- 9.6 Tata Chemicals Limited
- 9.7 Neogen Chemicals Limited
- 9.8 Weifang Rixing Chemical
- 9.9 Qingdao Win Chemistry
- 9.10 Gulf Resources Inc.

