
PUBLISHER: Global Market Insights Inc. | PRODUCT CODE: 2045874

PUBLISHER: Global Market Insights Inc. | PRODUCT CODE: 2045874
Recloser Market Opportunity, Growth Drivers, Industry Trend Analysis, and Forecast 2026 - 2035
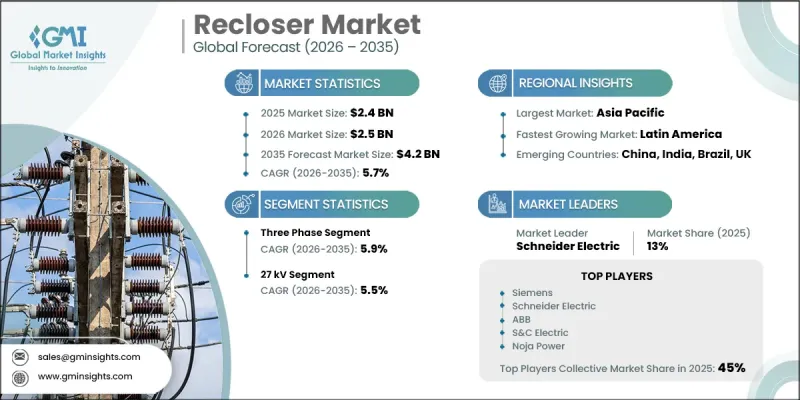
The Global Recloser Market was valued at USD 2.4 billion in 2025 and is estimated to grow at a CAGR of 5.7% to reach USD 4.2 billion by 2035.
The recloser industry is experiencing steady growth due to increasing investments in modernizing aging electrical infrastructure across developed economies. Utilities and grid operators are prioritizing upgrades to enhance system reliability, reduce downtime, and improve fault management capabilities. Rising electricity demand, driven by rapid urbanization, industrial expansion, and population growth, is further intensifying pressure on power distribution networks. Reclosers play a critical role in maintaining grid stability by automatically detecting and isolating faults, which helps restore power quickly and efficiently. Their ability to manage both temporary and permanent faults makes them essential for improving service continuity. The adoption of smart grid technologies is further accelerating demand, as utilities focus on automation, remote monitoring, and advanced protection systems. Continuous investments in power distribution upgrades and increasing emphasis on grid resilience are shaping market growth. Additionally, evolving regulatory frameworks and the global push toward reliable and efficient electricity delivery are reinforcing the importance of advanced recloser systems in modern energy infrastructure.
| Market Scope | |
|---|---|
| Start Year | 2025 |
| Forecast Year | 2026-2035 |
| Start Value | $2.4 Billion |
| Forecast Value | $4.2 Billion |
| CAGR | 5.7% |
The three-phase recloser segment is projected to grow at a CAGR of 5.9% through 2035. This segment is gaining traction due to its ability to simultaneously manage all phases of electrical systems, which helps maintain load balance and prevents system instability. Its automatic fault detection and isolation capabilities improve operational efficiency and reduce outage duration. Increasing deployment across distribution networks is supporting the adoption of these systems in advanced grid applications.
The 15 kV recloser segment is expected to grow at a CAGR of 5% by 2035. Growth in this segment is driven by the rising need for compact and efficient distribution equipment suitable for evolving power infrastructure. Expanding urban areas and ongoing infrastructure development are contributing to increased deployment. The shift toward environmentally responsible manufacturing processes and improved system efficiency is also supporting broader adoption of these reclosers.
U.S. Recloser Market was valued at USD 259.1 million in 2025, driven by increasing demand for reliable electricity distribution and enhanced grid performance. Expanding urban development and rising industrial activity are placing greater pressure on existing power systems, requiring advanced fault management solutions. Utilities are increasingly investing in recloser systems to reduce outage duration, improve operational efficiency, and enhance grid resilience, particularly in response to infrastructure aging and extreme weather-related disruptions.
Key companies operating in the Global Recloser Market include ABB, Eaton, Schneider Electric, Siemens, S&C Electric, G&W Electric, Hubbell, Tavrida Electric, Arteche, Ensto, Noja Power, Hughes Power System, Wenzhou Rockwill Electric, SUN-WA TECHNOS America Inc., Entec, Rade Koncar, Rymel, and Shinsung. Companies in the recloser market are adopting several strategic approaches to strengthen their market position and expand operational reach. Organizations are heavily investing in advanced research and development to enhance product performance, automation capabilities, and fault detection accuracy. Integration of digital technologies and smart grid compatibility is becoming a key focus area to improve system efficiency and remote monitoring capabilities. Companies are also expanding manufacturing capacities and optimizing supply chains to meet rising demand from utilities and infrastructure projects. Strategic partnerships with power distribution companies are supporting long-term contracts and wider market penetration.
Table of Contents
Chapter 1 Methodology & Scope
- 1.1 Research approach
- 1.2 Quality commitments
- 1.2.1 GMI AI policy & data integrity commitment
- 1.2.1.1 Source consistency protocol
- 1.2.1 GMI AI policy & data integrity commitment
- 1.3 Research trail & confidence scoring
- 1.3.1 Research trail components
- 1.3.2 Scoring components
- 1.4 Data collection
- 1.4.1 Partial list of primary sources
- 1.5 Data mining sources
- 1.5.1 Paid sources
- 1.5.1.1 Sources, by region
- 1.5.1 Paid sources
- 1.6 Base estimates and calculations
- 1.6.1 Base year calculation for any one approach
- 1.7 Market estimates & forecasts parameters
- 1.8 Forecast model
- 1.8.1 Quantified market impact analysis
- 1.8.1.1 Mathematical impact of growth parameters on forecast
- 1.8.1 Quantified market impact analysis
- 1.9 Research transparency addendum
- 1.9.1 Source attribution framework
- 1.9.2 Quality assurance metrics
- 1.9.3 Our commitment to trust
- 1.10 Market definitions
Chapter 2 Executive Summary
- 2.1 Industry synopsis, 2022 - 2035
- 2.1.1 Business trends
- 2.1.2 Phase trends
- 2.1.3 Control trends
- 2.1.4 Interruption trends
- 2.1.5 Voltage rating trends
- 2.1.6 Regional trends
Chapter 3 Industry Insights
- 3.1 Industry ecosystem analysis
- 3.1.1 Raw material availability & sourcing analysis
- 3.1.2 Supply chain resilience & risk factors
- 3.1.3 Distribution network analysis
- 3.2 Regulatory landscape
- 3.3 Industry impact forces
- 3.3.1 Growth drivers
- 3.3.2 Industry pitfalls & challenges
- 3.4 Growth potential analysis
- 3.5 Porter's Analysis
- 3.5.1 Bargaining power of suppliers
- 3.5.2 Bargaining power of buyers
- 3.5.3 Threat of new entrants
- 3.5.4 Threat of substitutes
- 3.6 PESTEL Analysis
- 3.6.1 Political factors
- 3.6.2 Economic factors
- 3.6.3 Social factors
- 3.6.4 Technological factors
- 3.6.5 Environmental factors
- 3.6.6 Legal factors
- 3.7 Cost structure analysis of recloser
- 3.8 Emerging opportunities & trends
- 3.9 Digitalization & IoT integration
- 3.10 Investment analysis & future prospects
- 3.11 Price trend analysis (Driven by Primary Research)
- 3.11.1 By phase, (USD/Unit)
- 3.12 Impact of AI & Generative AI on the market (Solution Core)
- 3.12.1 AI-driven production optimization
- 3.12.2 Predictive maintenance & fault detection
- 3.13 Trade data analysis (Driven by Primary Research)
- 3.13.1 Import/export volume & value trends
- 3.13.2 Key trade corridors & tariff impact
Chapter 4 Competitive Landscape, 2026
- 4.1 Introduction
- 4.2 Company market share analysis, 2025
- 4.2.1 By region
- 4.2.1.1 North America
- 4.2.1.2 Europe
- 4.2.1.3 Asia Pacific
- 4.2.1.4 Middle East & Africa
- 4.2.1.5 Latin America
- 4.2.2 Market concentration analysis
- 4.2.1 By region
- 4.3 Competitive analysis of major market players
- 4.4 Competitive positioning matrix
- 4.5 key developments
- 4.5.1 Merger & acquisition
- 4.5.2 Partnership & collaboration
- 4.5.3 New product launched
- 4.5.4 Expansion plans & funding
- 4.6 Company tier benchmarking
- 4.6.1 Tier classification criteria & qualifying thresholds
- 4.6.2 Tier positioning matrix by revenue, geography & innovation
Chapter 5 Market Size and Forecast, By Phase, 2022 - 2035 (Units, USD Million)
- 5.1 Key trends
- 5.2 Single phase
- 5.3 Three phase
Chapter 6 Market Size and Forecast, By Control, 2022 - 2035 (Units, USD Million)
- 6.1 Key trends
- 6.2 Electronic
- 6.3 Hydraulic
Chapter 7 Market Size and Forecast, By Interruption, 2022 - 2035 (Units, USD Million)
- 7.1 Key trends
- 7.2 Oil
- 7.3 Vacuum
Chapter 8 Market Size and Forecast, By Voltage, 2022 - 2035 (Units, USD Million)
- 8.1 Key trends
- 8.2 15 kV
- 8.3 27 kV
- 8.4 38 kV
Chapter 9 Market Size and Forecast, By Region, 2022 - 2035 (Units, USD Million)
- 9.1 Key trends
- 9.2 North America
- 9.2.1 U.S.
- 9.2.2 Canada
- 9.2.3 Mexico
- 9.3 Europe
- 9.3.1 UK
- 9.3.2 Germany
- 9.3.3 France
- 9.3.4 Russia
- 9.3.5 Italy
- 9.4 Asia Pacific
- 9.4.1 China
- 9.4.2 Japan
- 9.4.3 India
- 9.4.4 South Korea
- 9.4.5 Australia
- 9.5 Middle East & Africa
- 9.5.1 Saudi Arabia
- 9.5.2 UAE
- 9.5.3 South Africa
- 9.6 Latin America
- 9.6.1 Brazil
- 9.6.2 Argentina
- 9.6.3 Chile
Chapter 10 Company Profiles
- 10.1 ABB
- 10.2 Arteche
- 10.3 Eaton
- 10.4 Entec
- 10.5 Ensto
- 10.6 G&W Electric
- 10.7 Hubbell
- 10.8 Hughes Power System
- 10.9 Noja Power
- 10.10 Rade Koncar
- 10.11 Rymel
- 10.12 S&C Electric
- 10.13 Schneider Electric
- 10.14 Shinsung
- 10.15 Siemens
- 10.16 SUN-WA TECHNOS America Inc.
- 10.17 Tavrida Electric
- 10.18 Wenzhou Rockwill Electric

