
PUBLISHER: Global Market Insights Inc. | PRODUCT CODE: 2061356

PUBLISHER: Global Market Insights Inc. | PRODUCT CODE: 2061356
AI in Government and Public Services Market Opportunity, Growth Drivers, Industry Trend Analysis, and Forecast 2026 - 2035
The Global AI In Government and Public Services Market was valued at USD 19.7 billion in 2025 and is estimated to grow at a CAGR of 19.4% to reach USD 115.3 billion by 2035.
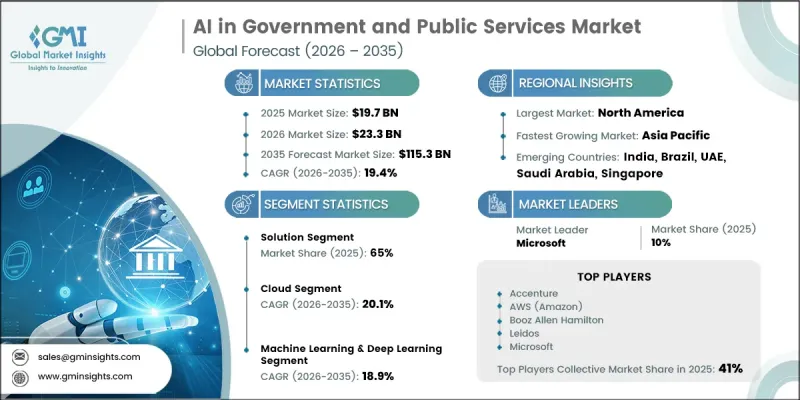
The rapid advancement of digital transformation initiatives across government agencies is playing a major role in accelerating market growth as public institutions continue replacing traditional systems with cloud-enabled and automated technologies. The increasing integration of artificial intelligence into administrative operations is improving efficiency, reducing operational costs, and strengthening transparency across public service functions. Governments are increasingly relying on AI-powered technologies to support large-scale data management and improve strategic planning through data-driven insights. The rising availability of public sector data is further encouraging the adoption of AI platforms that assist with decision-making processes related to infrastructure development, public administration, and resource allocation. In addition, the expansion of smart city programs is creating significant opportunities for AI deployment across urban management systems. AI-enabled technologies are improving operational efficiency in connected city environments by supporting real-time monitoring capabilities, optimizing energy consumption, and enhancing traffic management systems, contributing to improved urban living standards and more efficient public infrastructure.
| Market Scope | |
|---|---|
| Start Year | 2025 |
| Forecast Year | 2026-2035 |
| Start Value | $19.7 Billion |
| Forecast Value | $115.3 Billion |
| CAGR | 19.4% |
The solutions segment accounted for 65% share in 2025 and is anticipated to grow at a CAGR of 18.8% from 2026 to 2035. The market is witnessing a steady transition toward subscription-based AI platforms, replacing conventional licensing structures. Government agencies are increasingly selecting scalable and secure AI solutions that offer continuous software updates, regulatory compliance support, and seamless deployment capabilities. The growing demand for cloud-based infrastructure and integrated AI ecosystems across federal, regional, and municipal institutions is further supporting expansion within the solutions segment. Public organizations are also prioritizing flexible deployment models that can support long-term digital modernization initiatives.
The cloud segment held a 50.8% share in 2025 and is forecast to register a CAGR of 20.1% during 2035. Governments worldwide are increasingly adopting sovereign cloud frameworks to maintain stronger control over data protection, cybersecurity standards, and regulatory compliance requirements while continuing to benefit from advanced cloud-based AI capabilities. The increasing focus on national security and stricter regulations surrounding public sector data management is encouraging service providers to establish localized cloud infrastructure environments specifically designed for government operations. Cloud ecosystems are also evolving into comprehensive AI service platforms that provide access to machine learning tools, advanced analytics, and generative AI capabilities tailored to public sector requirements.
U.S. AI in Government and Public Services Market generated USD 6.5 billion in 2025 and is expected to grow at a CAGR of 20.1% from 2026 to 2035. The country is increasingly implementing structured AI governance frameworks supported by federal-level oversight policies, dedicated AI leadership roles, and governance committees to ensure accountability and consistency in AI deployment across public institutions. AI adoption is accelerating across government departments to improve operational accuracy, strengthen fraud detection capabilities, and enhance financial oversight through advanced predictive technologies and intelligent analytics systems. Public agencies are also expanding the use of AI-powered automation tools to streamline citizen engagement and improve service delivery efficiency. In addition, artificial intelligence technologies are gaining wider adoption in cybersecurity infrastructure and national security operations as government organizations continue modernizing digital defense capabilities.
Leading companies operating in the Global AI in Government and Public Services Market include Accenture, AWS (Amazon), Booz Allen Hamilton, Google (Alphabet), IBM, Leidos, Microsoft, OpenAI, Palantir, and SAIC. Companies participating in the AI in government and public services industry are focusing on multiple strategic initiatives to strengthen their market position and expand long-term growth opportunities. Major players are increasing investments in secure cloud infrastructure, AI-powered analytics platforms, and advanced automation technologies designed specifically for government operations. Organizations are also forming strategic partnerships with public agencies to support large-scale digital transformation programs and accelerate AI deployment across critical administrative functions. In addition, companies are prioritizing compliance-driven product development to meet evolving regulatory and cybersecurity requirements within government environments. Market participants are further expanding research and development activities to improve AI governance capabilities, data security frameworks, and scalable public sector solutions.
Table of Contents
Chapter 1 Methodology
- 1.1 Research approach
- 1.2 Quality Commitments
- 1.2.1 GMI AI policy & data integrity commitment
- 1.2.1.1 Source consistency protocol
- 1.2.1 GMI AI policy & data integrity commitment
- 1.3 Research Trail & Confidence Scoring
- 1.3.1 Research Trail Components
- 1.3.2 Scoring Components
- 1.4 Data Collection
- 1.4.1 Partial list of primary sources
- 1.5 Data mining sources
- 1.5.1 Paid sources
- 1.5.1.1 Sources, by region
- 1.5.1 Paid sources
- 1.6 Base estimates and calculations
- 1.6.1 Base year calculation
- 1.7 Forecast model
- 1.7.1 Quantified market impact analysis
- 1.7.1.1 Mathematical impact of growth parameters on forecast
- 1.7.1 Quantified market impact analysis
- 1.8 Research transparency addendum
- 1.8.1 Source attribution framework
- 1.8.2 Quality assurance metrics
- 1.8.3 Our commitment to trust
Chapter 2 Executive Summary
- 2.1 Industry 360° synopsis
- 2.2 Key market trends
- 2.2.1 Regional
- 2.2.2 Offering
- 2.2.3 Technology
- 2.2.4 Deployment mode
- 2.2.5 Application
- 2.2.6 End use
- 2.3 TAM analysis, 2026-2035
- 2.4 CXO perspectives: Strategic imperatives
Chapter 3 Industry Insights
- 3.1 Industry ecosystem analysis
- 3.1.1 Supplier landscape
- 3.1.2 Profit margin
- 3.1.3 Cost structure
- 3.1.4 Value addition at each stage
- 3.1.5 Factor affecting the value chain
- 3.1.6 Disruptions
- 3.2 Industry impact forces
- 3.2.1 Growth drivers
- 3.2.1.1 Government digital transformation initiatives
- 3.2.1.2 Rising demand for data-driven decision-making
- 3.2.1.3 Increasing need for public safety and security enhancement
- 3.2.1.4 Growing adoption of smart city programs
- 3.2.2 Industry pitfalls and challenges
- 3.2.2.1 Data privacy and ethical concerns
- 3.2.2.2 Legacy infrastructure and integration challenges
- 3.2.3 Market opportunities
- 3.2.3.1 Expansion of generative AI for citizen services
- 3.2.3.2 AI-powered fraud detection and compliance monitoring
- 3.2.3.3 Predictive analytics for resource allocation and policy planning
- 3.2.3.4 Autonomous systems for defense and emergency response
- 3.2.1 Growth drivers
- 3.3 Growth potential analysis
- 3.4 Technology and innovation landscape
- 3.4.1 Current technological trends
- 3.4.2 Emerging technologies
- 3.5 Pricing analysis (Driven by Primary Research)
- 3.5.1 Historical price trend analysis
- 3.5.2 Pricing strategy by player type (premium / value / cost-plus)
- 3.6 Regulatory landscape
- 3.6.1 North America
- 3.6.1.1 National Highway Traffic Safety Administration (NHTSA)
- 3.6.1.2 Environmental Protection Agency (EPA)
- 3.6.2 Europe
- 3.6.2.1 European Commission
- 3.6.2.2 United Nations Economic Commission for Europe
- 3.6.3 Asia Pacific
- 3.6.3.1 Ministry of Industry and Information Technology
- 3.6.3.2 Ministry of Road Transport and Highways
- 3.6.4 Latin America
- 3.6.4.1 Agencia Nacional de Transportes Terrestres
- 3.6.4.2 Secretaria de Infraestructura, Comunicaciones y Transportes
- 3.6.5 Middle East & Africa
- 3.6.5.1 Saudi Standards, Metrology and Quality Organization
- 3.6.5.2 National Regulator for Compulsory Specifications
- 3.6.1 North America
- 3.7 Porter’s analysis
- 3.8 PESTEL analysis
- 3.9 Cost breakdown analysis
- 3.10 Patent analysis (Driven by Primary Research)
- 3.11 Impact of AI & Generative AI on the Market
- 3.11.1 AI-driven disruption of existing business models
- 3.11.2 Gen AI use cases & adoption roadmap by segment
- 3.11.3 Risks, limitations & regulatory considerations
- 3.12 Sustainability and environmental aspects
- 3.12.1 Sustainable practices
- 3.12.2 Waste reduction strategies
- 3.12.3 Energy efficiency in production
- 3.12.4 Eco-friendly initiatives
- 3.12.5 Carbon footprint considerations
- 3.13 Forecast assumptions & scenario analysis (Driven by primary research)
- 3.13.1 Base Case - key macro & industry variables driving CAGR
- 3.13.2 Optimistic Scenarios - Favorable macro and industry tailwinds
- 3.13.3 Pessimistic Scenario - Macroeconomic slowdown or industry headwinds
Chapter 4 Competitive Landscape, 2025
- 4.1 Introduction
- 4.2 Company market share analysis
- 4.2.1 North America
- 4.2.2 Europe
- 4.2.3 Asia Pacific
- 4.2.4 LATAM
- 4.2.5 MEA
- 4.3 Competitive analysis of major market players
- 4.4 Competitive positioning matrix
- 4.5 Key developments
- 4.5.1 Mergers & acquisitions
- 4.5.2 Partnerships & collaborations
- 4.5.3 New product launches
- 4.5.4 Expansion plans and funding
Chapter 5 Market Estimates & Forecast, By Offering, 2022 - 2035 ($Bn)
- 5.1 Key trends
- 5.2 Solution
- 5.2.1 AI Software Platforms
- 5.2.2 Embedded Intelligence Systems
- 5.2.3 Packaged Government AI Solutions
- 5.3 Services
- 5.3.1 Consulting & Advisory
- 5.3.2 System Integration & Deployment
- 5.3.3 Training & Education
- 5.3.4 Support & Maintenance
Chapter 6 Market Estimates & Forecast, By Technology, 2022 - 2035 ($Bn)
- 6.1 Key trends
- 6.2 Machine Learning & Deep Learning
- 6.3 Natural Language Processing (NLP)
- 6.4 Image & Video
- 6.5 Robotic Process Automation (RPA)
- 6.6 Others
Chapter 7 Market Estimates & Forecast, By Deployment Mode, 2022 - 2035 ($Bn)
- 7.1 Key trends
- 7.2 Cloud
- 7.3 On-premises
- 7.4 Hybrid
Chapter 8 Market Estimates & Forecast, By Application, 2022 - 2035 ($Bn)
- 8.1 Key trends
- 8.2 Citizen Services & Engagement
- 8.2.1 Digital Assistants & Chatbots for Public Queries
- 8.2.2 Multilingual Translation for Public Communication
- 8.2.3 Personalized Government Portals
- 8.3 Public Safety & Security
- 8.3.1 Surveillance & Monitoring
- 8.3.2 Crime Prediction & Analysis
- 8.3.3 Emergency Response Systems
- 8.4 Healthcare & Social Services
- 8.4.1 Disease Prediction & Outbreak Control
- 8.4.2 Smart Resource Allocation (hospitals, clinics)
- 8.4.3 Benefits & Welfare Distribution Monitoring
- 8.5 Defense & National Security
- 8.5.1 Threat Detection & Analysis
- 8.5.2 AI-driven Cybersecurity Systems
- 8.5.3 Military Decision Support Systems
- 8.6 Administrative Efficiency
- 8.7 Smart Cities & Urban Management
- 8.8 Others
Chapter 9 Market Estimates & Forecast, By End use, 2022 - 2035 ($Bn)
- 9.1 Key trends
- 9.2 Government Agencies
- 9.2.1 Federal/National Government
- 9.2.2 State/Provincial Government
- 9.2.3 Local/Municipal Government
- 9.3 Public Services Organizations
- 9.3.1 Transportation Authorities
- 9.3.2 Social Welfare Organizations
- 9.3.3 Public Healthcare Systems
- 9.3.4 Utilities Providers
Chapter 10 Market Estimates & Forecast, By Region, 2022 - 2035 ($Bn)
- 10.1 Key trends
- 10.2 North America
- 10.2.1 U.S.
- 10.2.2 Canada
- 10.3 Europe
- 10.3.1 Germany
- 10.3.2 UK
- 10.3.3 France
- 10.3.4 Italy
- 10.3.5 Spain
- 10.3.6 Nordics
- 10.3.7 Russia
- 10.3.8 Poland
- 10.3.9 Romania
- 10.4 Asia Pacific
- 10.4.1 China
- 10.4.2 India
- 10.4.3 Japan
- 10.4.4 South Korea
- 10.4.5 ANZ
- 10.4.6 Singapore
- 10.4.7 Indonesia
- 10.4.8 Philippines
- 10.5 Latin America
- 10.5.1 Brazil
- 10.5.2 Mexico
- 10.5.3 Argentina
- 10.6 MEA
- 10.6.1 South Africa
- 10.6.2 Saudi Arabia
- 10.6.3 UAE
Chapter 11 Company Profiles
- 11.1 Global players
- 11.1.1 Amazon Web Services (AWS)
- 11.1.2 Accenture
- 11.1.3 Google
- 11.1.4 IBM
- 11.1.5 Microsoft
- 11.1.6 Oracle
- 11.1.7 Palantir
- 11.1.8 Salesforce
- 11.1.9 SAP
- 11.1.10 Thales
- 11.2 Regional players
- 11.2.1 Booz Allen Hamilton
- 11.2.2 Cellebrite
- 11.2.3 Granicus
- 11.2.4 Lockheed Martin
- 11.2.5 Leidos
- 11.2.6 Northrop Grumman
- 11.2.7 SAIC
- 11.3 Emerging players
- 11.3.1 OpenAI
- 11.3.2 Scale AI
- 11.3.3 Shield AI

