
PUBLISHER: Global Market Insights Inc. | PRODUCT CODE: 2071189

PUBLISHER: Global Market Insights Inc. | PRODUCT CODE: 2071189
Full Truckload Market Opportunity, Growth Drivers, Industry Trend Analysis, and Forecast 2026 - 2035
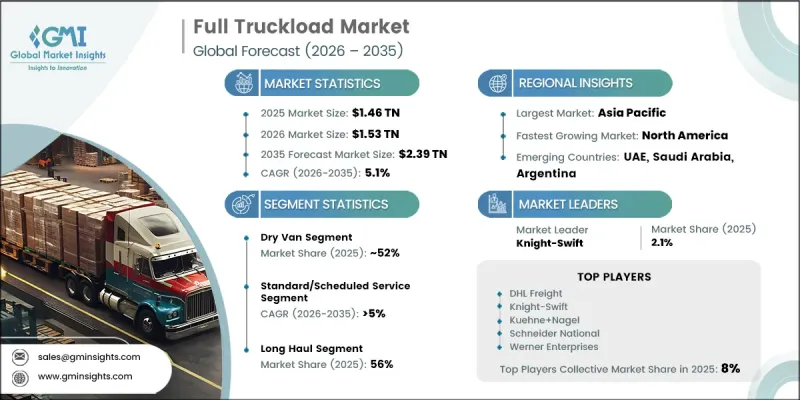
The Global Full Truckload Market was valued at USD 1.46 trillion in 2025 and is estimated to grow at a CAGR of 5.1% to reach USD 2.39 trillion by 2035.
Growth in the full truckload market is driven by evolving freight transportation requirements, increasing supply chain complexity, and the rising need for reliable, dedicated shipping solutions. The rapid expansion of e-commerce activities has significantly transformed freight movement patterns, leading to greater demand for scheduled truckload transportation between logistics facilities and distribution networks. As delivery expectations continue to accelerate, shippers are increasingly relying on dedicated transportation services that provide greater efficiency, predictability, and transit speed. This trend is reducing dependence on consolidated freight models and creating stronger revenue opportunities for carriers and logistics providers. In addition, ongoing supply chain realignment initiatives are reshaping freight corridors and strengthening demand for domestic and regional trucking services. Businesses are increasingly prioritizing supply chain resilience, operational flexibility, and proximity to end markets, contributing to sustained truckload transportation demand. These factors, combined with continued investment in logistics infrastructure and freight optimization strategies, are expected to support long-term expansion across the global full truckload industry.
| Market Scope | |
|---|---|
| Start Year | 2025 |
| Forecast Year | 2026-2035 |
| Start Value | $1.46 Trillion |
| Forecast Value | $2.39 Trillion |
| CAGR | 5.1% |
The restructuring of global supply chains continues to create favorable conditions for the full truckload market. Companies are increasingly adopting sourcing and manufacturing strategies that emphasize geographic diversification and improved supply chain responsiveness. This shift is generating additional demand for dedicated freight capacity across domestic and cross-border transportation routes. As organizations seek greater control over inventory movement and distribution efficiency, full truckload services are becoming an increasingly important component of modern logistics operations. The growing preference for regionalized supply networks is expected to further strengthen freight volumes and transportation activity throughout the forecast period.
The dry van segment accounted for 52% share in 2025 and is anticipated to grow at a CAGR of 4.5% through 2035. The segment's leading position is supported by its versatility and ability to transport a broad range of freight categories. Enclosed trailers remain widely utilized for the movement of packaged goods, industrial products, consumer merchandise, and various types of general cargo that require protection during transit. The flexibility and operational efficiency offered by dry van transportation continue to make it the preferred equipment type across numerous industries and shipping applications.
The long-haul segment represented 56% share in 2025. Growth in long-haul transportation continues to be supported by increasing freight movement between major production centers, distribution hubs, and end-user markets. Manufacturers, retailers, and logistics service providers rely heavily on long-distance trucking solutions to connect supply chains across broad geographic areas. Rising trade activity, expanding logistics networks, and increasing freight demand are expected to sustain strong utilization of long-haul transportation services throughout the forecast period.
North America Full Truckload Market generated USD 475.6 billion in 2025 and is projected to grow at a CAGR of 6.3% through 2035. The region continues to play a central role in global market expansion, supported by advanced transportation infrastructure, strong freight activity, and growing logistics investments. Continued growth in freight transportation demand, expanding fulfillment and distribution capabilities, and large-scale infrastructure investments are strengthening trucking activity throughout the country. These factors are expected to maintain North America's position as a major contributor to the growth of the global full truckload market.
Leading companies operating in the global full truckload market include DHL Freight, Kuehne+Nagel, CEVA, GEODIS, Knight-Swift, Schneider National, and Werner Enterprises. Companies operating in the full truckload market are adopting a variety of strategies to strengthen their market presence and enhance competitive positioning. Major industry participants are investing in fleet modernization, transportation management technologies, and digital freight platforms to improve operational efficiency and service quality. Many carriers are expanding their geographic coverage and strengthening logistics networks to better serve evolving customer requirements. Strategic acquisitions, partnerships, and capacity expansion initiatives enable companies to increase market share and improve service capabilities. Organizations are also leveraging advanced analytics, route optimization software, and real-time visibility tools to enhance fleet utilization and reduce operating costs.
Table of Contents
Chapter 1 Methodology
- 1.1 Research approach
- 1.2 Quality Commitments
- 1.2.1 GMI AI policy & data integrity commitment
- 1.2.1.1 Source consistency protocol
- 1.2.1 GMI AI policy & data integrity commitment
- 1.3 Research Trail & Confidence Scoring
- 1.3.1 Research Trail Components
- 1.3.2 Scoring Components
- 1.4 Data Collection
- 1.4.1 Partial list of primary sources
- 1.5 Data mining sources
- 1.5.1 Paid sources
- 1.5.2 Sources, by region
- 1.6 Base estimates and calculations
- 1.6.1 Base year calculation
- 1.7 Forecast model
- 1.7.1 Quantified market impact analysis
- 1.7.1.1 Mathematical impact of growth parameters on forecast
- 1.7.1 Quantified market impact analysis
- 1.8 Research transparency addendum
- 1.8.1 Source attribution framework
- 1.8.2 Quality assurance metrics
- 1.8.3 Our commitment to trust
Chapter 2 Executive Summary
- 2.1 Industry 360° synopsis, 2022 - 2035
- 2.2 Key market trends
- 2.2.1 Regional
- 2.2.2 Vehicle
- 2.2.3 Service
- 2.2.4 Haul Distance
- 2.2.5 End Use
- 2.2.6 Fuel
- 2.3 TAM Analysis, 2026-2035
- 2.4 CXO perspectives: Strategic imperatives
Chapter 3 Industry Insights
- 3.1 Industry ecosystem analysis
- 3.1.1 Supplier landscape
- 3.1.2 Profit margin analysis
- 3.1.3 Cost structure
- 3.1.4 Value addition at each stage
- 3.1.5 Factor affecting the value chain
- 3.1.6 Disruptions
- 3.2 Industry impact forces
- 3.2.1 Growth drivers
- 3.2.1.1 Growth of e-commerce & last-mile distribution networks
- 3.2.1.2 Near-shoring & supply chain regionalization boosting domestic freight
- 3.2.1.3 Rising demand for dedicated & contracted capacity solutions
- 3.2.1.4 Infrastructure investment programs driving construction freight
- 3.2.2 Industry pitfalls and challenges
- 3.2.2.1 Structural driver shortage & high turnover rates
- 3.2.2.2 Overcapacity & prolonged spot rate depression
- 3.2.2.3 Rising insurance, fuel & maintenance cost burden
- 3.2.2.4 Regulatory compliance costs
- 3.2.3 Market opportunities
- 3.2.3.1 Digital Freight Brokerage & Load Matching Platform Adoption
- 3.2.3.2 Cold Chain Expansion for Pharma & Perishable Goods
- 3.2.3.3 Autonomous Trucking Commercialization Reducing Driver Dependency
- 3.2.3.4 Emerging Market Logistics Infrastructure Build-Out
- 3.2.1 Growth drivers
- 3.3 Growth potential analysis
- 3.4 Regulatory landscape
- 3.4.1 North America
- 3.4.1.1 Federal Motor Carrier Safety Regulations (FMCSRs)
- 3.4.1.2 Federal Motor Carrier Safety Administration (FMCSA)
- 3.4.1.3 U.S. Department of Transportation (DOT)
- 3.4.1.4 Electronic Logging Device (ELD) Mandate
- 3.4.1.5 National Safety Code (NSC) for Motor Carriers - Canada
- 3.4.2 Europe
- 3.4.2.1 EU Mobility Package
- 3.4.2.2 Drivers' Hours and Tachograph Regulation
- 3.4.2.3 Combined Transport Directive
- 3.4.2.4 EU Road Freight Transport Regulations
- 3.4.2.5 ADR Regulations for Dangerous Goods Transport
- 3.4.3 Asia Pacific
- 3.4.3.1 China Road Transport Regulations
- 3.4.3.2 Indian Motor Vehicles Act & Central Motor Vehicle Rules (CMVR)
- 3.4.3.3 National Heavy Vehicle Law (NHVL) - Australia
- 3.4.3.4 Japanese Road Transport Vehicle Act
- 3.4.3.5 ASEAN Framework Agreement on the Facilitation of Goods in Transit (AFAFGIT)
- 3.4.4 Latin America
- 3.4.4.1 Brazilian National Land Transport Agency (ANTT) Freight Regulations
- 3.4.4.2 Brazilian Road Cargo Transport Registry (RNTRC)
- 3.4.4.3 Mexican Federal Motor Carrier Regulations
- 3.4.4.4 Mercosur Road Transport Agreement
- 3.4.4.5 Regional Customs and Cross-Border Freight Transport Regulations
- 3.4.5 Middle East & Africa
- 3.4.5.1 GCC Unified Customs Law
- 3.4.5.2 Saudi Transport General Authority (TGA) Road Freight Regulations
- 3.4.5.3 UAE Federal Transport Authority Freight Transport Regulations
- 3.4.5.4 South African National Road Traffic Act (NRTA)
- 3.4.5.5 African Continental Free Trade Area (AfCFTA) Trade & Transport Protocols
- 3.4.1 North America
- 3.5 Porter's analysis
- 3.6 PESTEL analysis
- 3.7 Technology and innovation landscape
- 3.7.1 Current technological trends
- 3.7.2 Emerging technologies
- 3.8 Price analysis (Driven by Primary Research)
- 3.8.1 Historical Price Trend Analysis
- 3.8.2 Pricing Strategy by Player Type (Premium / Value / Cost-plus)
- 3.9 Cost breakdown analysis
- 3.10 Patent analysis (Driven by Primary Research)
- 3.11 Impact of AI & generative AI on the market
- 3.11.1 AI-driven disruption of existing business models
- 3.11.2 GenAI use cases & adoption roadmap by segment
- 3.11.3 Risks, limitations & regulatory considerations
- 3.12 Sustainability and environmental aspects
- 3.12.1 Sustainable practices
- 3.12.2 Waste reduction strategies
- 3.12.3 Energy efficiency in production
- 3.12.4 Eco-friendly Initiatives
- 3.12.5 Carbon footprint considerations
- 3.13 Forecast assumptions & scenario analysis (Driven by Primary Research)
- 3.13.1 Base Case - key macro & industry variables driving CAGR
- 3.13.2 Optimistic Scenarios - Favorable macro and industry tailwinds
- 3.13.3 Pessimistic Scenario - Macroeconomic slowdown or industry headwinds
Chapter 4 Competitive Landscape, 2025
- 4.1 Introduction
- 4.2 Company market share analysis
- 4.2.1 North America
- 4.2.2 Europe
- 4.2.3 Asia Pacific
- 4.2.4 LATAM
- 4.2.5 MEA
- 4.3 Competitive analysis of major market players
- 4.4 Competitive positioning matrix
- 4.5 Key developments
- 4.5.1 Mergers & acquisitions
- 4.5.2 Partnerships & collaborations
- 4.5.3 New Product Launches
- 4.5.4 Expansion Plans and funding
- 4.6 Company tier benchmarking
- 4.6.1 Tier classification criteria & qualifying thresholds
- 4.6.2 Tier positioning matrix by revenue, geography & innovation
Chapter 5 Market Estimates & Forecast, By Vehicle, 2022 - 2035 ($Mn, Fleet Size)
- 5.1 Key trends
- 5.2 Dry Van
- 5.3 Refrigerated
- 5.4 Flatbed
- 5.5 Tanker
- 5.6 Others
Chapter 6 Market Estimates & Forecast, By Service, 2022 - 2035 ($Mn)
- 6.1 Key trends
- 6.2 Standard/Scheduled Service
- 6.3 Expedited Service
- 6.4 Dedicated Contract Service
- 6.5 Spot Market Service
Chapter 7 Market Estimates & Forecast, By Haul Distance, 2022 - 2035 ($Mn, Fleet Size)
- 7.1 Key trends
- 7.2 Long Haul
- 7.3 Regional Haul
- 7.4 Short Haul
Chapter 8 Market Estimates & Forecast, By End Use, 2022 - 2035 ($Mn, Fleet Size)
- 8.1 Key trends
- 8.2 Manufacturing
- 8.3 Retail & E-Commerce
- 8.4 Food & Beverage
- 8.5 Construction
- 8.6 Chemicals & Petroleum
- 8.7 Agriculture
- 8.8 Others
Chapter 9 Market Estimates & Forecast, By Fuel, 2022 - 2035 ($Mn, Fleet Size)
- 9.1 Key trends
- 9.2 Diesel
- 9.3 Natural gas
- 9.4 BEV
- 9.5 HEV
- 9.6 FCEV
Chapter 10 Market Estimates & Forecast, By Region, 2022 - 2035 ($Mn, Fleet Size)
- 10.1 Key trends
- 10.2 North America
- 10.2.1 US
- 10.2.2 Canada
- 10.3 Europe
- 10.3.1 UK
- 10.3.2 Germany
- 10.3.3 France
- 10.3.4 Italy
- 10.3.5 Spain
- 10.3.6 Russia
- 10.3.7 Nordics
- 10.4 Asia Pacific
- 10.4.1 China
- 10.4.2 India
- 10.4.3 Japan
- 10.4.4 South Korea
- 10.4.5 Southeast Asia
- 10.4.5.1 Indonesia
- 10.4.5.2 Malaysia
- 10.4.5.3 Singapore
- 10.4.5.4 Thailand
- 10.4.5.5 Vietnam
- 10.4.6 ANZ
- 10.5 Latin America
- 10.5.1 Brazil
- 10.5.2 Argentina
- 10.5.3 Mexico
- 10.6 MEA
- 10.6.1 UAE
- 10.6.2 Saudi Arabia
- 10.6.3 South Africa
Chapter 11 Company Profiles
- 11.1 Global Players
- 11.2 CEVA Logistics
- 11.3 Dachser
- 11.4 Delhivery
- 11.5 DHL Freight
- 11.6 DSV
- 11.7 GEODIS
- 11.8 Kuehne+Nagel
- 11.9 Maersk Logistics
- 11.10 Nippon Express
- 11.11 Rhenus
- 11.12 Sinotrans
- 11.13 Regional Players
- 11.14 Girteka
- 11.15 Knight-Swift
- 11.16 Schneider
- 11.17 SF Express
- 11.18 STEF
- 11.19 TFI International
- 11.20 Waberer's
- 11.21 Werner
- 11.22 Emerging Players
- 11.23 CJ Darcl

