PUBLISHER: Global Market Insights Inc. | PRODUCT CODE: 2071224

PUBLISHER: Global Market Insights Inc. | PRODUCT CODE: 2071224
Asia Pacific Action Figures Market Opportunity, Growth Drivers, Industry Trend Analysis, and Forecast 2026 - 2035
Asia Pacific Action Figures Market was valued at USD 4.8 billion in 2025 and is estimated to grow at a CAGR of 8.1% to reach USD 10.5 billion by 2035.
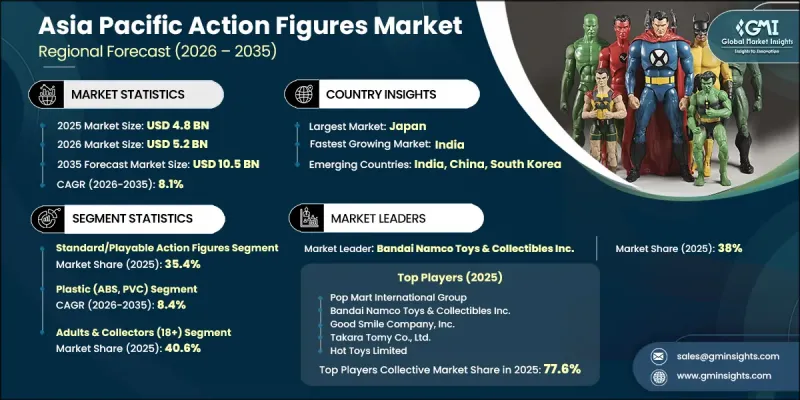
Market expansion is fueled by increasing consumer engagement with entertainment-based intellectual properties, the growing popularity of character-driven merchandise, and the rapid development of collectible toy categories across major regional economies. The widespread consumption of digital entertainment content has significantly expanded awareness of licensed franchises, creating stronger connections between audiences and merchandise products. Rising disposable incomes across several Asia Pacific countries are further supporting spending on collectibles, hobby products, and premium action figures. At the same time, the continued growth of e-commerce platforms is making products more accessible to consumers by providing broader product selection, competitive pricing, and convenient purchasing experiences. The increasing integration of entertainment content and merchandise ecosystems is creating long-term demand that extends beyond traditional toy consumption. As fan communities continue to expand and consumer interest in collectibles grows, the Asia Pacific Action Figures Market is benefiting from a broader customer base and stronger purchasing activity. These factors, combined with improvements in digital retail infrastructure and evolving consumer preferences, continue to support sustained market growth across the region.
| Market Scope | |
|---|---|
| Start Year | 2025 |
| Forecast Year | 2026-2035 |
| Start Value | $4.8 Billion |
| Forecast Value | $10.5 Billion |
| CAGR | 8.1% |
The standard and playable action figures segment held a 35.4% share, generating USD 1.70 billion in 2025. The segment's leadership is supported by its strong presence across mass-market retail channels, broad affordability, and widespread appeal among younger consumers who represent a significant portion of the market's demand base. These products continue to benefit from their accessibility, familiarity, and versatility, making them a preferred choice among households seeking entertainment and play-focused merchandise. Strong retail penetration and consistent consumer demand continue to reinforce the segment's dominant position within the market.
The vinyl segment held a 17.2% share in 2025 and is projected to grow at a CAGR of 13.2% through 2035. Growth is driven by increasing demand for collectible products that emphasize distinctive designs, premium aesthetics, and display appeal. The material's flexibility enables manufacturers to create visually unique products with enhanced detailing and artistic characteristics, making it particularly attractive within the expanding collectibles segment. Rising consumer interest in limited-edition merchandise and designer-inspired collectibles continues to strengthen demand for vinyl-based action figures across the region.
China Action Figures Market reached USD 2 billion in 2025, held 42.4% share. This growth rate ranks among the highest across the region and positions China as the largest contributor to overall market expansion. The country has experienced significant market evolution in recent years, supported by the development of a more diversified competitive environment and increasing consumer demand for licensed merchandise and collectible products. Growing domestic production capabilities, expanding fan communities, and rising acceptance of premium collectibles continue to strengthen China's leadership position within the regional market.
Major companies operating in the Asia Pacific Action Figures Market include Bandai Namco Toys & Collectibles Inc., Pop Mart International Group, Hasbro Inc., Mattel Inc., Funko Inc., Takara Tomy Co. Ltd., Good Smile Company Inc., McFarlane Toys, Kaiyodo Co. Ltd., Kotobukiya Co. Ltd., Hot Toys Limited, Spin Master Corp., Square Enix Co. Ltd. (Play Arts Kai), Playmates Toys Ltd., 52TOYS, Furyu Corporation, ALTER Co. Ltd., Threezero Ltd., Sentinel Co. Ltd., Medicom Toy Corporation, and Storm Collectibles. Companies operating in the Asia Pacific Action Figures Market are implementing a variety of strategies to strengthen their market position and expand their customer base. Product portfolio diversification remains a major focus, with manufacturers introducing new collectible categories, premium product lines, and limited-edition releases to attract both casual buyers and dedicated collectors. Businesses are also investing in licensing agreements and intellectual property partnerships to enhance brand visibility and capitalize on growing consumer engagement with entertainment content. Expansion of e-commerce channels, direct-to-consumer sales platforms, and digital marketing initiatives is helping companies improve accessibility and reach wider audiences.
Table of Contents
Chapter 1 Research Methodology
- 1.1 Research approach
- 1.2 Quality Commitments
- 1.2.1 GMI AI policy & data integrity commitment
- 1.2.1.1 Source consistency protocol
- 1.2.1 GMI AI policy & data integrity commitment
- 1.3 Research Trail & Confidence Scoring
- 1.3.1 Research Trail Components
- 1.3.2 Scoring Components
- 1.4 Data Collection
- 1.4.1 Partial list of primary sources
- 1.5 Data mining sources
- 1.5.1 Paid sources
- 1.5.1.1 Sources, by region
- 1.5.1 Paid sources
- 1.6 Base estimates and calculations
- 1.6.1 Base year calculation for any one approach
- 1.7 Forecast model
- 1.7.1 Quantified market impact analysis
- 1.7.1.1 Mathematical impact of growth parameters on forecast
- 1.7.1 Quantified market impact analysis
- 1.8 Research transparency addendum
- 1.8.1 Source attribution framework
- 1.8.2 Quality assurance metrics
- 1.8.3 Our commitment to trust
Chapter 2 Executive Summary
- 2.1 Industry 360° synopsis, 2022 - 2035
- 2.2 Key market trends
- 2.2.1 Country
- 2.2.2 Product type
- 2.2.3 Material
- 2.2.4 End User
- 2.2.5 Distribution channel
Chapter 3 Industry Insights
- 3.1 Industry ecosystem analysis
- 3.1.1 Factor affecting the value chain
- 3.1.2 Profit margin analysis
- 3.1.3 Disruptions
- 3.1.4 Future outlook
- 3.1.5 Manufacturers
- 3.1.6 Distributors
- 3.2 Supplier landscape
- 3.3 Key news & initiatives
- 3.4 Technology & Innovation Landscape
- 3.5 Regulatory landscape
- 3.6 Impact on forces
- 3.6.1 Growth drivers
- 3.6.2 Industry pitfalls & challenges
- 3.6.3 Opportunities
- 3.7 Porter's analysis
- 3.8 PESTEL analysis
- 3.8.1 Pricing analysis (driven by primary research)
- 3.8.2 Historical price trend analysis (driven by primary research)
- 3.8.3 Pricing strategy by player type (premium / value / cost-plus) (driven by primary research)
- 3.8.4 Price benchmarking by product category (standard vs. collectible vs. premium) (driven by primary research)
- 3.8.5 Licensing royalty cost impact on end-market pricing (driven by primary research)
- 3.9 Trade data analysis (driven by paid database)
- 3.9.1 Import/export volume & value trends by region (driven by paid database)
- 3.9.2 Key trade corridors & tariff impact (China-US, China-EU, Japan-global) (driven by paid database)
- 3.10 Impact of AI & generative AI on the market
- 3.10.1 AI-driven disruption of design, prototyping & customization workflows
- 3.10.2 GenAI use cases & adoption roadmap by segment (collectibles, mass market, licensing)
- 3.10.3 Risks, limitations & regulatory considerations (deepfake likeness, IP infringement)
- 3.11 Distribution infrastructure & channel penetration landscape (driven by primary research)
- 3.11.1 Channel coverage by region & format (modern vs. traditional trade) (driven by primary research)
- 3.11.2 Last-mile infrastructure gaps & emerging channel shifts (D2C, social commerce, live-stream retail) (driven by primary research)
Chapter 4 Competitive Landscape, 2025
- 4.1 Introduction
- 4.2 Company market share analysis
- 4.3 Competitive positioning matrix
- 4.4 Strategic outlook matrix
- 4.5 Competitive analysis of major market players
- 4.6 Key developments
- 4.6.1 Mergers & acquisitions
- 4.6.2 Partnerships & collaborations
- 4.6.3 New product launches
- 4.6.4 Expansion plans
Chapter 5 Market Estimates & Forecast, By Product Type, 2022-2035 (USD Billion) (Million Units)
- 5.1 Key trends
- 5.2 Standard / playable action figures
- 5.3 Collectible action figures
- 5.4 Premium / articulated action figures
- 5.5 Action figure accessories & playsets
Chapter 6 Market Estimates & Forecast, By Material, 2022-2035 (USD Billion) (Million Units)
- 6.1 Key trends
- 6.2 Plastic (ABS, PVC)
- 6.3 Vinyl
- 6.4 Resin
- 6.5 Metal
- 6.6 Hybrid
Chapter 7 Market Estimates & Forecast, By End User, 2022-2035 (USD Billion) (Million Units)
- 7.1 Key trends
- 7.2 Children (3-8 years)
- 7.3 Tweens & teens (9-17 years)
- 7.4 Adults & collectors (18+ years)
Chapter 8 Market Estimates & Forecast, By Distribution Channel, 2022-2035 (USD Billion) (Million Units)
- 8.1 Key trends
- 8.2 Online
- 8.3 Offline
- 8.3.1 Supermarkets & hypermarkets
- 8.3.2 Specialty toy & hobby stores
- 8.3.3 Direct-to-consumer (brand stores)
- 8.3.4 Others
Chapter 9 Market Estimates & Forecast, By Country, 2022 - 2035, (USD Billion) (Million Units)
- 9.1 Key trends
- 9.2 China
- 9.3 India
- 9.4 Japan
- 9.5 South Korea
- 9.6 Australia
- 9.7 Philippines
- 9.8 Thailand
- 9.9 Vietnam
Chapter 10 Company Profiles (Business Overview, Financial Data, Product Landscape, Strategic Outlook, SWOT Analysis)
- 10.1 Global players
- 10.1.1 DMG Mori Co. Ltd.
- 10.1.2 Yamazaki Mazak Corporation
- 10.1.3 FANUC Corporation
- 10.1.4 Haas Automation, Inc.
- 10.1.5 Trumpf GmbH + Co. KG
- 10.1.6 DN Solutions Co., Ltd.
- 10.1.7 Amada Holdings Co., Ltd.
- 10.2 Regional players
- 10.2.1 Okuma Corporation
- 10.2.2 Makino Milling Machine Co., Ltd.
- 10.2.3 Nidec Machine Tool Corporation
- 10.2.4 Maschinenfabrik Berthold Hermle AG
- 10.2.5 Shibaura Machine Co., Ltd.
- 10.2.6 JTEKT Corporation
- 10.2.7 ANDRITZ Schuler
- 10.2.8 Shenyang Machine Tool Co., Ltd.
- 10.2.9 United Machining Solutions
- 10.3 Emerging players
- 10.3.1 EMAG Group
- 10.3.2 INDEX-Werke GmbH & Co. KG
- 10.3.3 Genertec Dalian Machine Tool Co., Ltd. (DMTG)
- 10.3.4 Biesse Group S.p.A.

