
PUBLISHER: Global Market Insights Inc. | PRODUCT CODE: 2071226

PUBLISHER: Global Market Insights Inc. | PRODUCT CODE: 2071226
Clean-Label Preservatives Market Opportunity, Growth Drivers, Industry Trend Analysis, and Forecast 2026 - 2035
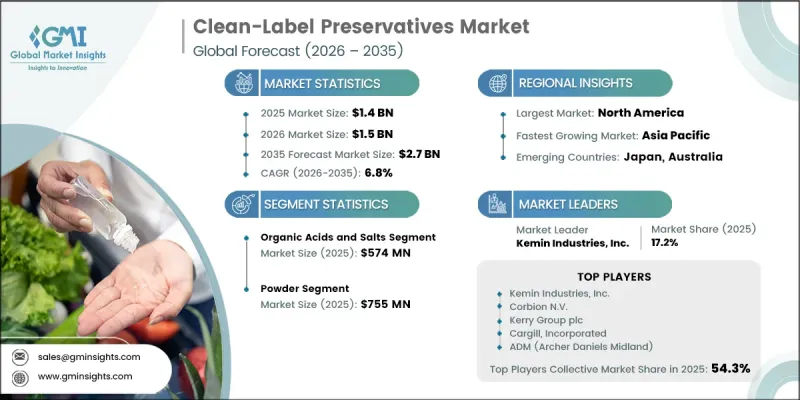
The Global Clean-Label Preservatives Market was valued at USD 1.4 billion in 2025 and is estimated to grow at a CAGR of 6.8% to reach USD 2.7 billion by 2035.
Market growth is driven by the increasing adoption of naturally sourced preservation solutions as food and beverage manufacturers continue to reformulate products to meet evolving consumer preferences for transparency and recognizable ingredients. Rising demand for clean-label products across premium food categories is encouraging manufacturers to replace synthetic additives with natural alternatives that support product quality and shelf-life extension. In addition, regulatory scrutiny surrounding conventional food additives has intensified globally, prompting food producers to accelerate the transition toward naturally derived preservation technologies. Improvements in production economics for fermentation-based and plant-derived solutions are further supporting market expansion. Strong demand from processed food categories continues to provide a solid foundation for market growth, while emerging applications across multiple food and beverage segments are creating new opportunities for clean-label preservative suppliers. The combination of regulatory support, changing consumer expectations, and ongoing innovation in ingredient technologies continues to strengthen the long-term outlook for the clean-label preservatives industry.
| Market Scope | |
|---|---|
| Start Year | 2025 |
| Forecast Year | 2026-2035 |
| Start Value | $1.4 Billion |
| Forecast Value | $2.7 Billion |
| CAGR | 6.8% |
Increasing regulatory oversight of synthetic food ingredients remains a significant factor supporting the growth of the clean-label preservatives market worldwide. Regulatory authorities are implementing stricter evaluation procedures and post-approval monitoring requirements for conventional food additives, creating additional compliance challenges for manufacturers that rely on synthetic preservation systems. At the same time, favorable regulatory environments for naturally derived ingredients are facilitating broader adoption of clean-label solutions. Ongoing reviews of approved additives and evolving food safety standards are encouraging food manufacturers to reformulate products using alternative preservation technologies. As a result, demand for naturally sourced preservatives continues to increase across a wide range of food processing applications.
Among preservative categories, the organic acids and salts segment generated USD 574 million in 2025. The strong market position of organic acids and salts is supported by their ability to enhance product stability and inhibit microbial growth while maintaining compatibility with clean-label product formulations. Continuous advancements in formulation technologies are further improving performance, processing flexibility, and application efficiency across multiple food manufacturing environments.
The powder-based preservatives segment reached USD 755 million in 2025. The segment continues to benefit from advantages such as extended storage stability, precise application control, ease of handling, and compatibility with a broad range of food production processes. Ongoing product innovation within powder formulations is enabling manufacturers to improve ingredient protection, optimize performance, and maintain product integrity throughout processing and storage. These benefits continue to support widespread adoption across numerous food and beverage applications.
North America Clean-Label Preservatives Market accounted for USD 435 million in 2025. The region's market growth is supported by well-established food safety regulations, increasing demand for clean-label products, and strong industry focus on ingredient transparency. Food manufacturers throughout the region are actively incorporating naturally derived preservation technologies to meet consumer expectations while maintaining product quality and shelf stability. Regulatory frameworks and retailer-driven clean-label initiatives continue to influence formulation strategies, supporting sustained demand for innovative preservation solutions across the North American food and beverage sector.
Major companies operating in the global clean-label preservatives market include Kemin Industries, Inc.; Corbion N.V.; Kerry Group plc; Cargill, Incorporated; ADM (Archer Daniels Midland); Galactic S.A.; Jungbunzlauer Suisse AG; Tate & Lyle PLC; IFF (International Flavors & Fragrances); Koninklijke DSM N.V.; Chinova Bioworks; Handary S.A.; Kalsec Inc.; Lallemand Inc.; and Chr. Hansen Holding A/S. Companies operating in the clean-label preservatives market are pursuing a variety of strategies to strengthen their competitive position and expand their global presence. Investment in research and development remains a primary focus, enabling manufacturers to create innovative natural preservation technologies that deliver enhanced functionality and longer shelf life. Product portfolio expansion through fermentation-based, botanical, and naturally sourced ingredient solutions is helping companies address changing customer requirements. Strategic partnerships, acquisitions, and collaborations are also being used to strengthen distribution capabilities and accelerate market penetration. Many companies are investing in advanced production technologies to improve scalability, cost efficiency, and ingredient performance.
Table of Contents
Chapter 1 Methodology & Scope
- 1.1 Research approach
- 1.2 Quality Commitments
- 1.2.1 GMI AI policy & data integrity commitment
- 1.2.1.1 Source consistency protocol
- 1.2.1 GMI AI policy & data integrity commitment
- 1.3 Research Trail & Confidence Scoring
- 1.3.1 Research Trail Components
- 1.3.2 Scoring Components
- 1.4 Data Collection
- 1.4.1 Partial list of primary sources
- 1.5 Data mining sources
- 1.5.1 Paid sources
- 1.5.1.1 Sources, by region
- 1.5.1 Paid sources
- 1.6 Base estimates and calculations
- 1.6.1 Base year calculation for any one approach
- 1.7 Forecast model
- 1.7.1 Quantified market impact analysis
- 1.7.1.1 Mathematical impact of growth parameters on forecast
- 1.7.1 Quantified market impact analysis
- 1.8 Research transparency addendum
- 1.8.1 Source attribution framework
- 1.8.2 Quality assurance metrics
- 1.8.3 Our commitment to trust
Chapter 2 Executive Summary
- 2.1 Industry 360° synopsis
- 2.2 Key market trends
- 2.2.1 Regional
- 2.2.2 Preservative type
- 2.2.3 Form
- 2.2.4 Application
- 2.3 TAM Analysis, 2026-2035
- 2.4 CXO perspectives: Strategic imperatives
Chapter 3 Industry Insights
- 3.1 Industry ecosystem analysis
- 3.1.1 Supplier landscape
- 3.1.2 Profit margin
- 3.1.3 Value addition at each stage
- 3.1.4 Factor affecting the value chain
- 3.1.5 Disruptions
- 3.2 Industry impact forces
- 3.2.1 Growth drivers
- 3.2.2 Industry pitfalls and challenges
- 3.2.3 Market opportunities
- 3.3 Growth potential analysis
- 3.4 Regulatory landscape
- 3.4.1 North America
- 3.4.2 Europe
- 3.4.3 Asia Pacific
- 3.4.4 Latin America
- 3.4.5 Middle East & Africa
- 3.5 Porter's analysis
- 3.6 PESTEL analysis
- 3.7 Price trends
- 3.7.1 By region
- 3.7.2 By preservative type
- 3.8 Future market trends
- 3.9 Technology and Innovation landscape
- 3.9.1 Current technological trends
- 3.9.2 Emerging technologies
- 3.10 Patent Landscape
- 3.11 Trade statistics (HS code)
- 3.11.1 Major importing countries
- 3.11.2 Major exporting countries
- 3.12 Sustainability and environmental aspects
- 3.12.1 Sustainable practices
- 3.12.2 Waste reduction strategies
- 3.12.3 Energy efficiency in production
- 3.12.4 Eco-friendly initiatives
- 3.13 Carbon footprint consideration
Chapter 4 Competitive Landscape, 2025
- 4.1 Introduction
- 4.2 Company market share analysis
- 4.2.1 By region
- 4.2.1.1 North America
- 4.2.1.2 Europe
- 4.2.1.3 Asia Pacific
- 4.2.1.4 LATAM
- 4.2.1.5 MEA
- 4.2.1 By region
- 4.3 Company matrix analysis
- 4.4 Competitive analysis of major market players
- 4.5 Competitive positioning matrix
- 4.6 Key developments
- 4.6.1 Mergers & acquisitions
- 4.6.2 Partnerships & collaborations
- 4.6.3 New Product Launches
- 4.6.4 Expansion Plans
Chapter 5 Market Estimates and Forecast, By Preservative Type, 2022-2035 (USD Billion) (Kilo Tons)
- 5.1 Key trends
- 5.2 Organic acids & salts
- 5.2.1 Citric acid
- 5.2.2 Acetic acid (Vinegar)
- 5.2.3 Lactic acid
- 5.2.4 Sodium benzoate
- 5.2.5 Potassium sorbate
- 5.2.6 Others
- 5.3 Fermentation-derived preservatives
- 5.3.1 Cultured dextrose
- 5.3.2 Cultured sugar
- 5.3.3 Fermented wheat
- 5.3.4 Probiotic-based preservatives
- 5.3.5 Others
- 5.4 Botanical antimicrobials
- 5.4.1 Rosemary extract
- 5.4.2 Green tea extract
- 5.4.3 Citrus extract
- 5.4.4 Essential oil
- 5.5 Natural antioxidants
- 5.6 Others
Chapter 6 Market Estimates and Forecast, By Form, 2022-2035 (USD Billion) (Kilo Tons)
- 6.1 Key trends
- 6.2 Powder
- 6.3 Liquid
- 6.4 Others
Chapter 7 Market Estimates and Forecast, By Application, 2022-2035 (USD Billion) (Kilo Tons)
- 7.1 Key trends
- 7.2 Bakery & confectionery
- 7.2.1 Bread & rolls
- 7.2.2 Cakes & pastries
- 7.2.3 Cookies & biscuits
- 7.2.4 Chocolates & candies
- 7.3 Beverages
- 7.3.1 Juices & nectars
- 7.3.2 Soft drinks & carbonated beverages
- 7.3.3 Functional & sports drinks
- 7.3.4 Alcoholic beverages (beer, wine)
- 7.4 Ready meals & processed foods
- 7.4.1 Frozen foods
- 7.4.2 Refrigerated meals
- 7.4.3 Canned & packaged foods
- 7.5 Dairy & dairy alternatives
- 7.5.1 Milk & cream
- 7.5.2 Cheese
- 7.5.3 Yogurt
- 7.5.4 Plant-based dairy alternatives
- 7.6 Meat & poultry
- 7.6.1 Fresh meat
- 7.6.2 Processed meat products (sausages, deli meats)
- 7.6.3 Poultry products
- 7.7 Others
Chapter 8 Market Estimates and Forecast, By Region, 2022-2035 (USD Billion) (Kilo Tons)
- 8.1 Key trends
- 8.2 North America
- 8.2.1 U.S.
- 8.2.2 Canada
- 8.3 Europe
- 8.3.1 Germany
- 8.3.2 UK
- 8.3.3 France
- 8.3.4 Spain
- 8.3.5 Italy
- 8.3.6 Rest of Europe
- 8.4 Asia Pacific
- 8.4.1 China
- 8.4.2 India
- 8.4.3 Japan
- 8.4.4 Australia
- 8.4.5 South Korea
- 8.4.6 Rest of Asia Pacific
- 8.5 Latin America
- 8.5.1 Brazil
- 8.5.2 Mexico
- 8.5.3 Argentina
- 8.5.4 Rest of Latin America
- 8.6 Middle East and Africa
- 8.6.1 Saudi Arabia
- 8.6.2 South Africa
- 8.6.3 UAE
- 8.6.4 Rest of Middle East and Africa
Chapter 9 Company Profiles
- 9.1 Kemin Industries, Inc.
- 9.2 Corbion N.V.
- 9.3 Kerry Group plc
- 9.4 Cargill, Incorporated
- 9.5 ADM (Archer Daniels Midland)
- 9.6 Galactic S.A.
- 9.7 Jungbunzlauer Suisse AG
- 9.8 Tate & Lyle PLC
- 9.9 IFF (International Flavors & Fragrances)
- 9.10 Koninklijke DSM N.V.
- 9.11 Chinova Bioworks
- 9.12 Handary S.A.
- 9.13 Kalsec Inc.
- 9.14 Lallemand Inc.
- 9.15 Chr. Hansen Holding A/S

