
PUBLISHER: Global Market Insights Inc. | PRODUCT CODE: 2071353

PUBLISHER: Global Market Insights Inc. | PRODUCT CODE: 2071353
Telecom Power Systems Market Opportunity, Growth Drivers, Industry Trend Analysis, and Forecast 2026 - 2035
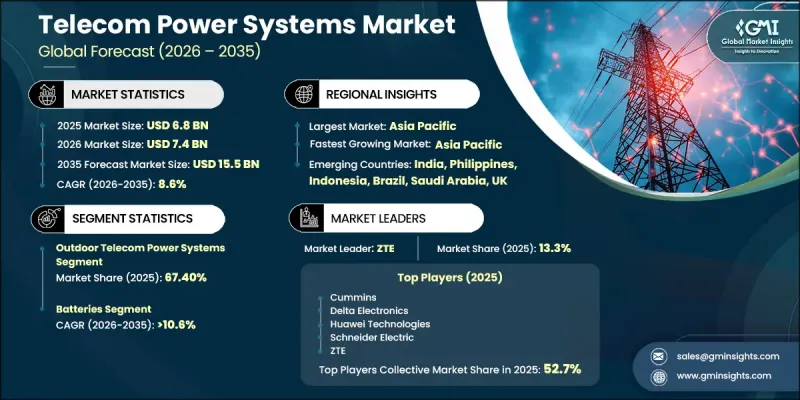
The Global Telecom Power Systems Market was valued at USD 6.8 billion in 2025 and is estimated to grow at a CAGR of 8.6% to reach USD 15.5 billion by 2035.
The telecom power systems market is undergoing a major transformation as telecommunications networks become increasingly data-intensive and energy dependent. Expanding mobile broadband coverage, rapid 5G deployment, growth in edge computing infrastructure, and rising power requirements across telecom networks are creating strong demand for advanced energy solutions. Network operators are placing greater emphasis on maintaining uninterrupted service availability while improving operational efficiency and reducing environmental impact. As a result, telecom power systems are evolving from conventional backup solutions into intelligent energy management platforms capable of supporting modern network architectures. Growing digitalization, increasing data traffic, and the expansion of connected technologies continue to elevate the importance of reliable telecom energy infrastructure. In addition, operators are investing in advanced systems that support energy optimization, remote monitoring, and greater operational resilience. The shift toward sustainable network operations, coupled with the need for continuous uptime and enhanced performance, is encouraging widespread adoption of next-generation telecom power technologies across developed and emerging markets alike.
| Market Scope | |
|---|---|
| Start Year | 2025 |
| Forecast Year | 2026-2035 |
| Start Value | $6.8 Billion |
| Forecast Value | $15.5 Billion |
| CAGR | 8.6% |
The need for uninterrupted connectivity continues to intensify as telecom operators respond to rising data consumption driven by digital services and connected applications. To address these requirements, companies are increasingly deploying hybrid telecom power systems that combine AC and DC architectures, advanced battery technologies, renewable energy integration, and intelligent energy management platforms. These solutions help improve energy efficiency, strengthen network reliability, and reduce dependence on conventional fuel-based power sources, particularly in regions with limited or unstable grid access.
The outdoor telecom power systems segment accounted for 67.4% share in 2025 and is expected to grow at a CAGR of 8.1% through 2035. The segment's leadership is attributed to its extensive deployment across remote telecom installations and large-scale communication infrastructure where dependable power availability is critical. These systems are engineered to withstand challenging environmental conditions while delivering extended backup capabilities and supporting the integration of multiple energy sources to enhance operational efficiency.
The 10-50 kW segment represented the largest share of the market in 2025. Systems within this power range are widely utilized across medium-capacity telecommunications infrastructure due to their ability to provide an effective balance between performance, scalability, and cost efficiency. Increasing investments in network expansion and modernization are supporting demand for these systems, as operators require reliable power solutions capable of managing higher operational loads while accommodating advanced energy management capabilities.
U.S. Telecom Power Systems Market held an 83.6% in 2025, generating USD 1.3 billion. Market growth is supported by continued investments in next-generation communication networks, infrastructure modernization initiatives, and the expansion of distributed network architectures. The region is increasingly transitioning toward software-enabled, intelligent energy systems designed to optimize power consumption, enhance network availability, and improve operational performance. Growing deployment of decentralized communication infrastructure is also contributing to demand for compact and efficient telecom power solutions.
Major companies operating in the global telecom power systems market include General Electric Company, Delta Electronics, Eaton, Huawei Technologies, Vertiv, Schneider Electric, Cummins, ABB, AEG Power Solutions, and ZTE. Companies operating in the telecom power systems market are focusing on several strategic initiatives to strengthen their market position and expand their competitive presence. Key priorities include developing intelligent power management platforms, integrating renewable energy sources into telecom infrastructure, and enhancing energy efficiency through advanced battery technologies. Market participants are also investing heavily in research and development to introduce scalable and software-driven power solutions tailored for evolving network requirements. Strategic partnerships with telecom operators, infrastructure providers, and technology companies are helping accelerate deployment and expand geographic reach. In addition, manufacturers are strengthening after-sales services, remote monitoring capabilities, and predictive maintenance offerings to improve customer retention.
Table of Contents
Chapter 1 Methodology
- 1.1 Research approach
- 1.2 Quality Commitments
- 1.2.1 GMI AI policy & data integrity commitment
- 1.2.1.1 Source consistency protocol
- 1.2.1 GMI AI policy & data integrity commitment
- 1.3 Research Trail & Confidence Scoring
- 1.3.1 Research Trail Components
- 1.3.2 Scoring Components
- 1.4 Data Collection
- 1.4.1 Partial list of primary sources
- 1.5 Data mining sources
- 1.5.1 Paid sources
- 1.5.1.1 Sources, by region
- 1.5.1 Paid sources
- 1.6 Base estimates and calculations
- 1.6.1 Base year calculation
- 1.7 Forecast Model
- 1.7.1 Quantified market impact analysis
- 1.7.1.1 Mathematical impact of growth parameters on forecast
- 1.7.1 Quantified market impact analysis
- 1.8 Research transparency addendum
- 1.8.1 Source attribution framework
- 1.8.2 Quality assurance metrics
- 1.8.3 Our commitment to trust
Chapter 2 Executive Summary
- 2.1 Industry 360° synopsis, 2022 - 2035
- 2.2 Key market trends
- 2.2.1 Regional
- 2.2.2 Type
- 2.2.3 Technology
- 2.2.4 Application
- 2.2.5 Component
- 2.2.6 Grid Type
- 2.2.7 Power Rating
- 2.3 TAM Analysis, 2026-2035
- 2.4 CXO perspectives: Strategic imperatives
Chapter 3 Industry Insights
- 3.1 Industry ecosystem analysis
- 3.1.1 Supplier landscape
- 3.1.2 Profit margin analysis
- 3.1.3 Cost structure
- 3.1.4 Value addition at each stage
- 3.1.5 Factor affecting the value chain
- 3.1.6 Disruptions
- 3.2 Industry impact forces
- 3.2.1 Growth drivers
- 3.2.1.1 Increasing mobile subscribers globally.
- 3.2.1.2 Rising adoption of private LTE networks.
- 3.2.1.3 Expansion of telecom infrastructure in rural areas.
- 3.2.1.4 Growing adoption of hybrid power systems.
- 3.2.2 Industry pitfalls and challenges
- 3.2.2.1 Environmental concerns related to power systems.
- 3.2.2.2 Rising cost for raw materials and skilled labor.
- 3.2.3 Market opportunities
- 3.2.3.1 Expansion of telecom networks into rural and remote area
- 3.2.3.2 Advancements in lithium-ion and next-generation batteries
- 3.2.3.3 Adoption of AI-driven energy management and remote monitoring systems
- 3.2.3.4 Increasing demand for cloud services and digital infrastructure
- 3.2.1 Growth drivers
- 3.3 Growth potential analysis
- 3.4 Pricing Analysis (Driven by Primary Research)
- 3.4.1 Historical Price Trend Analysis
- 3.4.2 Pricing Strategy by Player Type (Premium / Value / Cost-plus)
- 3.5 Regulatory guideline
- 3.5.1 North America
- 3.5.1.1 U.S.: FCC Regulations, DOE Energy Efficiency Standards & NERC Reliability Framework
- 3.5.1.2 Canada: ISED Policies & NRCan Energy Regulations
- 3.5.2 Europe
- 3.5.2.1 Germany: EU Energy Efficiency Directive & BNetzA Oversight
- 3.5.2.2 UK: Ofcom Regulations & Net Zero Framework
- 3.5.2.3 France: ARCEP Supervision & EU Green Energy Compliance
- 3.5.2.4 Italy: AGCOM Oversight & EU Energy Regulations
- 3.5.3 Asia Pacific
- 3.5.3.1 China: MIIT Regulations & Energy Conservation Policies
- 3.5.3.2 India: TRAI Guidelines & Renewable Energy Mandates
- 3.5.3.3 Japan: MIC Regulations & Energy Efficiency Standards
- 3.5.3.4 Australia: ACMA Regulations & Clean Energy Policies
- 3.5.4 Latin America
- 3.5.4.1 Brazil: ANATEL Regulations & Energy Efficiency Programs
- 3.5.4.2 Mexico: IFT Regulatory Framework & Energy Policies
- 3.5.4.3 Argentina: ENACOM Regulations & Power Infrastructure Policies
- 3.5.5 Middle East & Africa (MEA)
- 3.5.5.1 UAE: TDRA Regulations & Clean Energy Strategy
- 3.5.5.2 Saudi Arabia: CITC Regulations & Vision 2030 Framework
- 3.5.5.3 South Africa: ICASA Regulations & Energy Efficiency Standards
- 3.5.1 North America
- 3.6 Porter's analysis
- 3.7 PESTEL analysis
- 3.8 Technology and Innovation landscape
- 3.8.1 Current technological trends
- 3.8.2 Emerging technologies
- 3.9 Patent analysis (Driven by Primary Research)
- 3.10 Capacity & production landscape (Driven by Primary Research)
- 3.10.1 Installed capacity by region & key producer
- 3.10.2 Capacity utilization rates & expansion pipelines
- 3.11 Trade data analysis (Driven by Paid Research)
- 3.11.1 Intra Trade Flows - Volume & Value Trends
- 3.11.2 Import/Export Corridor Analysis
- 3.12 Impact of AI & generative AI on the market
- 3.12.1 AI-Driven Disruption of Existing Business Models
- 3.12.2 GenAI Use Cases & Adoption Roadmap by Segment
- 3.12.3 Risks, limitations & regulatory considerations
- 3.13 Sustainability and environmental aspects
- 3.13.1 Sustainable practices
- 3.13.2 Waste reduction strategies
- 3.13.3 Energy efficiency in production
- 3.13.4 Eco-friendly initiatives
- 3.13.5 Carbon footprint considerations
- 3.14 Forecast assumptions & scenario analysis (Driven by Primary Research)
- 3.14.1 Base Case - Key Macro & Industry Variables Driving CAGR
- 3.14.2 Optimistic Scenarios - Favourable macro and industry tailwinds
- 3.14.3 Pessimistic Scenario - Macroeconomic slowdown or industry headwinds
Chapter 4 Competitive Landscape, 2025
- 4.1 Introduction
- 4.2 Company market share analysis
- 4.2.1 North America
- 4.2.2 Europe
- 4.2.3 Asia Pacific
- 4.2.4 Latin America
- 4.2.5 MEA
- 4.3 Competitive analysis of major market players
- 4.4 Competitive positioning matrix
- 4.5 Key developments
- 4.5.1 Mergers & acquisitions
- 4.5.2 Partnerships & collaborations
- 4.5.3 New Product Launches
- 4.5.4 Expansion Plans and funding
- 4.6 Company Tier Benchmarking
- 4.6.1 Tier Classification Criteria & Qualifying Thresholds
- 4.6.2 Tier Positioning Matrix by Revenue, Geography & Innovation
Chapter 5 Market Estimates & Forecast, By Type, 2022 - 2035 ($Bn, Units)
- 5.1 Key trends
- 5.2 Indoor Telecom Power Systems
- 5.3 Outdoor Telecom Power Systems
Chapter 6 Market Estimates & Forecast, By Technology, 2022 - 2035 ($Bn, Units)
- 6.1 Key trends
- 6.2 AC Power
- 6.3 DC Power
- 6.4 Digital Electricity
Chapter 7 Market Estimates & Forecast, By Application, 2022 - 2035 ($Bn, Units)
- 7.1 Key trends
- 7.2 Macro/Outdoor BTS
- 7.3 Data Centers
- 7.4 Indoor DAS
- 7.4.1 Active DAS
- 7.4.2 Passive DAS
- 7.4.3 Hybrid DAS
Chapter 8 Market Estimates & Forecast, By Component, 2022 - 2035 ($Bn, Units)
- 8.1 Key trends
- 8.2 Rectifiers
- 8.3 Inverters
- 8.4 Converters
- 8.5 Controllers
- 8.6 Batteries
- 8.7 Generators
- 8.8 Heat management systems
- 8.9 Power distribution units (PDU)
Chapter 9 Market Estimates & Forecast, By Grid Type, 2022 - 2035 ($Bn, Units)
- 9.1 Key trends
- 9.2 On-grid
- 9.3 Off-grid
Chapter 10 Market Estimates & Forecast, By Power Rating, 2022 - 2035 ($Bn, Units)
- 10.1 Key trends
- 10.2 Up to 10 kW
- 10.3 10-50 kW
- 10.4 Above 50 kW
Chapter 11 Market Estimates & Forecast, By Region, 2022 - 2035 ($Bn, Units)
- 11.1 Key trends
- 11.2 North America
- 11.2.1 US
- 11.2.2 Canada
- 11.3 Europe
- 11.3.1 Germany
- 11.3.2 UK
- 11.3.3 France
- 11.3.4 Italy
- 11.3.5 Spain
- 11.3.6 Russia
- 11.3.7 Netherlands
- 11.3.8 Belgium
- 11.4 Asia Pacific
- 11.4.1 China
- 11.4.2 India
- 11.4.3 Japan
- 11.4.4 Australia
- 11.4.5 South Korea
- 11.4.6 Philippines
- 11.4.7 Indonesia
- 11.5 Latin America
- 11.5.1 Brazil
- 11.5.2 Mexico
- 11.5.3 Argentina
- 11.6 MEA
- 11.6.1 South Africa
- 11.6.2 Saudi Arabia
- 11.6.3 UAE
Chapter 12 Company Profiles
- 12.1 Global Players
- 12.1.1 Huawei Technologies
- 12.1.2 Schneider Electric
- 12.1.3 Eaton Corporation
- 12.1.4 Vertiv Holdings
- 12.1.5 Delta Electronics
- 12.1.6 Cummins
- 12.1.7 ZTE
- 12.1.8 General Electric Company
- 12.2 Regional Players
- 12.2.1 Eltek
- 12.2.2 Alpha Technologies
- 12.2.3 Ascot Industrial
- 12.2.4 Myers Power Products
- 12.2.5 UniPower
- 12.2.6 Hangzhou Zhongheng Power Energy
- 12.2.7 Staticon
- 12.2.8 Corning
- 12.3 Emerging Players
- 12.3.1 VoltServer
- 12.3.2 Dynamic Power
- 12.3.3 AEG Power Solutions
- 12.3.4 Benning Power Solutions

