PUBLISHER: Global Market Insights Inc. | PRODUCT CODE: 2071376

PUBLISHER: Global Market Insights Inc. | PRODUCT CODE: 2071376
Synthetic Aperture Radar Market Opportunity, Growth Drivers, Industry Trend Analysis, and Forecast 2026 - 2035
The Global Synthetic Aperture Radar Market was valued at USD 8.17 billion in 2025 and is estimated to grow at a CAGR of 13.5% to reach USD 28.07 billion by 2035.
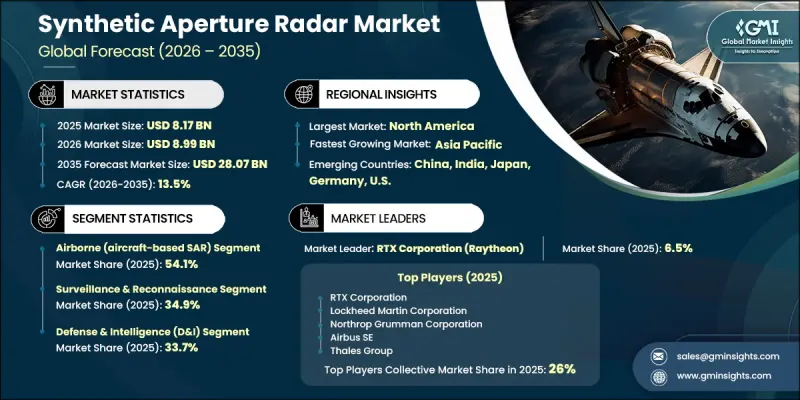
Growth is driven by the expanding use of SAR systems in remote sensing applications that require accurate, real-time imaging regardless of weather conditions or time of day. Governments and commercial organizations are increasingly relying on satellite-based intelligence to enhance decision-making, environmental monitoring, and disaster response capabilities. Rising geopolitical tensions and growing defense investments are further accelerating adoption, as SAR technology provides enhanced surveillance, reconnaissance, and threat detection capabilities. Continuous innovation in radar miniaturization, satellite deployment, and imaging resolution is improving operational efficiency and expanding use cases across both defense and civilian sectors. The integration of advanced analytics and data processing technologies is also strengthening system performance and situational awareness in complex operational environments.
| Market Scope | |
|---|---|
| Start Year | 2025 |
| Forecast Year | 2026-2035 |
| Start Value | $8.17 Billion |
| Forecast Value | $28.07 Billion |
| CAGR | 13.5% |
The airborne synthetic aperture radar segment accounted for 54.1% share in 2025, driven by its widespread use in surveillance, reconnaissance, and intelligence operations. This segment benefits from its ability to deliver high-resolution imaging over large geographic areas, making it highly suitable for defense missions and border monitoring applications. Increasing demand for real-time situational awareness and expanding defense budgets are further supporting segment growth.
The defense and intelligence segment represented 33.7% share in 2025, supported by its critical role in military surveillance, strategic monitoring, and threat detection operations. SAR systems are widely used in mission-critical environments where reliable, continuous, and accurate imaging is essential. Growing geopolitical uncertainties and rising defense expenditures are reinforcing demand for advanced radar-based intelligence solutions.
North America Synthetic Aperture Radar Market held 38.1% share in 2025, driven by strong adoption across defense, aerospace, and earth observation applications. The region benefits from advanced defense infrastructure and increasing reliance on satellite-enabled monitoring systems. Growing demand from intelligence agencies, environmental monitoring programs, and military surveillance operations continues to strengthen regional market growth.
Key companies operating in the Global Synthetic Aperture Radar Market include RTX Corporation (Raytheon), Lockheed Martin Corporation, Northrop Grumman Corporation, Airbus SE, Thales Group, Leonardo, L3Harris, Israel Aerospace Industries (IAI), Saab, BAE Systems, Capella Space, and ICEYE. Market participants are focusing on strengthening their position through advancements in radar imaging resolution, satellite miniaturization, and data analytics integration. Companies are investing heavily in next-generation space-based SAR constellations to enhance global coverage and reduce revisit times. Strategic collaborations with government agencies and defense organizations are enabling long-term contract stability and improved deployment opportunities. Firms are also expanding their technological capabilities through AI-driven image processing and real-time data interpretation systems. In addition, partnerships and joint ventures are accelerating innovation in lightweight, cost-efficient satellite platforms.
Table of Contents
Chapter 1 Methodology and Scope
- 1.1 Market scope and definition
- 1.2 Research design
- 1.2.1 Research approach
- 1.2.2 Data collection methods
- 1.3 Data mining sources
- 1.3.1 Global
- 1.3.2 Regional/Country
- 1.4 Base estimates and calculations
- 1.4.1 Base year calculation
- 1.4.2 Key trends for market estimation
- 1.5 Primary research and validation
- 1.5.1 Primary sources
- 1.6 Forecast model
- 1.7 Research assumptions and limitations
Chapter 2 Executive Summary
- 2.1 Industry 360° synopsis, 2022 - 2035
- 2.2 Key market trends
- 2.2.1 Platform trends
- 2.2.2 Sector trends
- 2.2.3 Application trends
- 2.2.4 Buyer trends
- 2.2.5 Regional trends
- 2.3 TAM Analysis, 2026-2035
- 2.4 CXO perspectives: Strategic imperatives
Chapter 3 Industry Insights
- 3.1 Industry ecosystem analysis
- 3.1.1 Supplier Landscape
- 3.1.2 Profit Margin
- 3.1.3 Cost structure
- 3.1.4 Value addition at each stage
- 3.1.5 Factor affecting the value chain
- 3.1.6 Disruptions
- 3.2 Industry impact forces
- 3.2.1 Growth drivers
- 3.2.1.1 Increasing demand for earth observation and environmental monitoring
- 3.2.1.2 Technological advancements in SAR systems and data processing
- 3.2.1.3 Rising defense and military surveillance requirements
- 3.2.1.4 Expansion of commercial applications across key industries
- 3.2.1.5 Growth of satellite constellations and UAV-based SAR deployment
- 3.2.2 Industry pitfalls and challenges
- 3.2.2.1 High development and deployment costs of SAR systems
- 3.2.2.2 Complex data interpretation and processing requirements
- 3.2.3 Market opportunities
- 3.2.3.1 Increasing adoption in disaster management and emergency response
- 3.2.3.2 Integration with artificial intelligence and geospatial analytics
- 3.2.1 Growth drivers
- 3.3 Growth potential analysis
- 3.4 Regulatory landscape
- 3.4.1 North America
- 3.4.2 Europe
- 3.4.3 Asia Pacific
- 3.4.4 Latin America
- 3.4.5 Middle East & Africa
- 3.5 Porter's analysis
- 3.6 PESTEL analysis
- 3.7 Technology and Innovation landscape
- 3.7.1 Current technological trends
- 3.7.2 Emerging technologies
- 3.8 Price trends
- 3.8.1 By region
- 3.8.2 By product
- 3.9 Pricing Strategies
- 3.10 Emerging Business Models
- 3.11 Compliance Requirements
- 3.12 Patent and IP analysis
Chapter 4 Competitive Landscape, 2025
- 4.1 Introduction
- 4.2 Company market share analysis
- 4.2.1 By region
- 4.2.1.1 North America
- 4.2.1.2 Europe
- 4.2.1.3 Asia Pacific
- 4.2.1.4 Latin America
- 4.2.1.5 Middle East & Africa
- 4.2.2 Market concentration analysis
- 4.2.1 By region
- 4.3 Competitive benchmarking of key players
- 4.3.1 Financial performance comparison
- 4.3.1.1 Revenue
- 4.3.1.2 Profit margin
- 4.3.1.3 R&D
- 4.3.2 Product portfolio comparison
- 4.3.2.1 Product range breadth
- 4.3.2.2 Technology
- 4.3.2.3 Innovation
- 4.3.3 Geographic presence comparison
- 4.3.3.1 Global footprint analysis
- 4.3.3.2 Service network coverage
- 4.3.3.3 Market penetration by region
- 4.3.4 Competitive positioning matrix
- 4.3.4.1 Leaders
- 4.3.4.2 Challengers
- 4.3.4.3 Followers
- 4.3.4.4 Niche players
- 4.3.5 Strategic outlook matrix
- 4.3.1 Financial performance comparison
- 4.4 Key developments
- 4.4.1 Mergers and acquisitions
- 4.4.2 Partnerships and collaborations
- 4.4.3 Technological advancements
- 4.4.4 Expansion and investment strategies
- 4.4.5 Digital transformation initiatives
- 4.5 Emerging/ startup competitors landscape
Chapter 5 Market Estimates and Forecast, By Buyer Type, 2022 - 2035 (USD Billion)
- 5.1 Key trends
- 5.2 Public Sector
- 5.2.1 Defence & Intelligence Agencies
- 5.2.2 Civil Government Agencies
- 5.3 Private Sector
- 5.3.1 Commercial Enterprises
- 5.3.2 Service Provider
Chapter 6 Market Estimates and Forecast, By Platform, 2022 - 2035 (USD Billion)
- 6.1 Key trends
- 6.2 UAV- based SAR
- 6.3 Grounded-Based
- 6.4 Airborne (Aircraft-based SAR)
- 6.5 Spaceborne (Satellite-based SAR)
- 6.6 Others
Chapter 7 Market Estimates and Forecast, By Sector, 2022 - 2035 (USD Billion)
- 7.1 Key trends
- 7.2 Defense & Intelligence (D&I)
- 7.2.1 Maritime Domain Awareness (MDA) / Maritime Surveillance
- 7.2.2 Border & Land Surveillance
- 7.2.3 Military Intelligence & Reconnaissance
- 7.2.4 Others
- 7.3 Infrastructure Monitoring & Management
- 7.4 Energy & Resource Sector (Oil, Gas, Mining)
- 7.5 Disaster Response & Emergency Management
- 7.6 Environmental & Climate Monitoring
- 7.7 Others
Chapter 8 Market Estimates and Forecast, By Application, 2022 - 2035 (USD Billion)
- 8.1 Key trends
- 8.2 Object detection & target tracking
- 8.3 Surveillance & reconnaissance
- 8.4 Environmental & agricultural monitoring
- 8.5 Ocean & coastal observation
- 8.6 Resource exploration & industrial monitoring
- 8.7 Others
Chapter 9 Market Estimates and Forecast, By Region, 2022 - 2035 (USD Billion)
- 9.1 Key trends
- 9.2 North America
- 9.2.1 U.S.
- 9.2.2 Canada
- 9.3 Europe
- 9.3.1 Germany
- 9.3.2 UK
- 9.3.3 France
- 9.3.4 Spain
- 9.3.5 Italy
- 9.4 Asia Pacific
- 9.4.1 China
- 9.4.2 India
- 9.4.3 Japan
- 9.4.4 Australia
- 9.4.5 South Korea
- 9.5 Latin America
- 9.5.1 Brazil
- 9.5.2 Mexico
- 9.5.3 Argentina
- 9.6 Middle East and Africa
- 9.6.1 South Africa
- 9.6.2 Saudi Arabia
- 9.6.3 UAE
Chapter 10 Company Profiles
- 10.1 Global Key Players
- 10.1.1 RTX Corporation
- 10.1.2 Airbus SE
- 10.1.3 Thales Group
- 10.2 Regional key players
- 10.2.1 North America
- 10.2.1.1 L3Harris Technologies
- 10.2.1.2 Lockheed Martin Corporation
- 10.2.1.3 Northrop Grumman Corporation
- 10.2.2 Asia Pacific
- 10.2.2.1 Israel Aerospace Industries
- 10.2.2.2 Saab AB
- 10.2.2.3 BAE System
- 10.2.3 Europe
- 10.2.3.1 Leonardo S.p.A.
- 10.2.1 North America
- 10.3 Niche Players/Disruptors
- 10.3.1 Capella Space
- 10.3.2 ICEYE

