PUBLISHER: Global Market Insights Inc. | PRODUCT CODE: 2083264

PUBLISHER: Global Market Insights Inc. | PRODUCT CODE: 2083264
Three Phase Variable Shunt Reactor Market Opportunity, Growth Drivers, Industry Trend Analysis, and Forecast 2026 - 2035
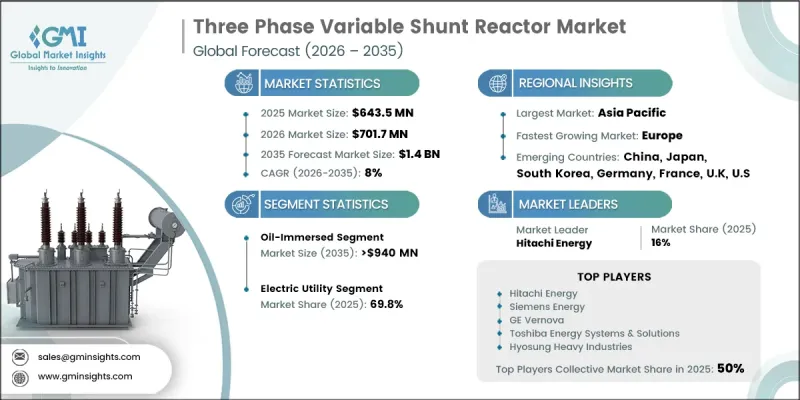
The Global Three Phase Variable Shunt Reactor Market was valued at USD 643.5 million in 2025 and is estimated to grow at a CAGR of 8% to reach USD 1.4 billion by 2035.
Market growth is driven by the increasing need for efficient grid management and the expanding integration of renewable energy sources into power transmission networks. Three phase variable shunt reactors help in maintaining voltage stability and supporting the reliable operation of modern electrical infrastructure. As power networks become more complex, utilities are increasingly investing in technologies that enhance power quality, minimize transmission losses, and improve overall system performance. The modernization of aging grid infrastructure, combined with ongoing smart grid deployment initiatives, is further contributing to market expansion. Technological advancements are also reshaping the industry, with growing adoption of automated control systems and digital monitoring capabilities that improve operational efficiency and voltage regulation. In addition, manufacturers are focusing on designs that reduce energy losses and support sustainability objectives. The integration of these reactors within advanced substation environments is improving monitoring capabilities and enabling more effective remote operation. Rising demand for compact and modular solutions, particularly in space-constrained installations, is also influencing product development.
| Market Scope | |
|---|---|
| Start Year | 2025 |
| Forecast Year | 2026-2035 |
| Start Value | $643.5 Million |
| Forecast Value | $1.4 Billion |
| CAGR | 8% |
The oil-immersed segment is expected to reach USD 940 million by 2035. Growth in this segment is supported by substantial investments aimed at strengthening transmission infrastructure and maintaining stable voltage levels across expanding power networks. The continued growth of renewable energy generation is increasing the need for advanced voltage regulation solutions capable of managing fluctuations within the grid. At the same time, ongoing transmission system upgrades and smart grid expansion initiatives are creating favorable conditions for market growth. Oil-immersed three phase variable shunt reactors are widely recognized for their operational efficiency, long service life, and ability to perform reliably under demanding operating conditions. These characteristics contribute significantly to improved grid performance, enhanced system reliability, and reduced energy losses throughout transmission networks.
The electric utility segment accounted for 69.8% share in 2025 and is expected to grow at a CAGR of 6.5% through 2035. Rising electricity consumption across global markets is creating increased demand for technologies that support stable and efficient power delivery. Utilities are investing in voltage regulation and reactive power compensation solutions as part of broader efforts to modernize transmission infrastructure and improve grid performance. Growing electrification initiatives are also contributing to market growth, particularly as power networks expand to meet increasing energy requirements. Additionally, the evolving structure of modern electricity systems, characterized by a combination of conventional and renewable power generation sources, is driving greater demand for advanced grid management equipment.
U.S. Three Phase Variable Shunt Reactor Market was valued at USD 80.2 million in 2025 and is projected to reach USD 190 million by 2035. Market expansion is being supported by ongoing investments in power infrastructure modernization, growing emphasis on energy efficiency, and increasing integration of renewable energy resources into the national grid. Utilities throughout the country are strengthening transmission networks and deploying advanced technologies to improve operational reliability and optimize reactive power management. Investments in smart grid development and grid expansion projects continue to create significant opportunities for the adoption of three phase variable shunt reactors. These factors are expected to support sustained market growth across the United States throughout the forecast period.
Major companies operating in the Global Three Phase Variable Shunt Reactor Market include Siemens Energy, Hitachi Energy, GE Vernova, Toshiba Energy Systems & Solutions, Fuji Electric, Hyosung Heavy Industries, WEG, SGB SMIT, Prolec Energy, Nissin Electric, HICO America, Pennsylvania Transformer, Trench Group, TMC Transformers Manufacturing Company, CG Power & Industrial Solutions, GBE, GETRA, Hilkar, Shrihans Electricals, Coil Innovation, and Phoenix Electric. Companies participating in the three phase variable shunt reactor market are implementing a variety of strategies to strengthen their market presence and enhance competitive positioning. Product innovation remains a key focus, with manufacturers investing in advanced reactor technologies that improve efficiency, reliability, and grid performance. Research and development initiatives are increasingly centered on digital monitoring systems, automated control capabilities, and environmentally sustainable designs. Strategic partnerships with utilities, transmission operators, and engineering firms are helping companies expand their project pipelines and strengthen customer relationships. Market participants are also pursuing geographic expansion to capitalize on growing infrastructure investments across emerging and developed economies.
Table of Contents
Chapter 1 Methodology & Scope
- 1.1 Research approach
- 1.2 Quality commitment
- 1.2.1 GMI AI policy & data integrity commitment
- 1.2.1.1 Source consistency protocol
- 1.2.1 GMI AI policy & data integrity commitment
- 1.3 Research Trail & Confidence Scoring
- 1.3.1 Research Trail Components
- 1.3.2 Scoring Components
- 1.4 Data Collection
- 1.4.1 Partial list of primary sources
- 1.5 Data mining sources
- 1.5.1 Paid sources
- 1.5.1.1 Sources, by region
- 1.5.1 Paid sources
- 1.6 Base estimates and calculations
- 1.6.1 Base year calculation for any one approach
- 1.7 Forecast model
- 1.8 Research transparency addendum
- 1.8.1 Source attribution framework
- 1.8.2 Quality assurance metrics
- 1.8.3 Our commitment to trust
- 1.8.3.1 Market definitions
Chapter 2 Executive Summary
- 2.1 Industry synopsis, 2022 - 2035
- 2.2 Business trends
- 2.3 Insulation trends
- 2.4 End use trends
- 2.5 Regional trends
Chapter 3 Industry Insights
- 3.1 Industry ecosystem analysis
- 3.2 Regulatory landscape
- 3.3 Industry impact forces
- 3.3.1 Growth drivers
- 3.3.2 Industry pitfalls & challenges
- 3.4 Growth potential analysis
- 3.5 Porter's analysis
- 3.5.1 Bargaining power of suppliers
- 3.5.2 Bargaining power of buyers
- 3.5.3 Threat of new entrants
- 3.5.4 Threat of substitutes
- 3.6 PESTEL analysis
- 3.7 Cost structure analysis of shunt reactors
- 3.8 Trade data analysis (Driven by Primary Research)
- 3.8.1 Import/export value trends (Driven by Primary Research)
- 3.8.2 Key trade corridors & tariff impact (Driven by Primary Research)
- 3.9 Production capacity & utilization (Driven by Primary Research)
- 3.9.1 Production capacity by region (Driven by Primary Research)
- 3.9.2 Utilization rates and expansion pipeline (Driven by Primary Research)
- 3.10 Impact of AI & generative AI on the market [SOLUTION CORE]
- 3.10.1 AI-driven disruption of existing business models
- 3.10.2 GenAI use cases & adoption roadmap by segment
- 3.10.2.1 Predictive maintenance & fault detection
- 3.10.2.2 Digital twin simulation & testing
- 3.10.3 Risks, limitations & regulatory considerations
- 3.11 Emerging opportunities & trends
- 3.12 Investment analysis & future outlook
Chapter 4 Competitive Landscape, 2026
- 4.1 Introduction
- 4.2 Company market share analysis, by region, 2025
- 4.2.1 North America
- 4.2.2 Europe
- 4.2.3 Asia Pacific
- 4.2.4 Middle East & Africa
- 4.2.5 Latin America
- 4.3 Competitive positioning matrix
- 4.4 Key Developments
- 4.4.1 Mergers & acquisitions
- 4.4.2 Partnerships & collaborations
- 4.4.3 New product launches
- 4.4.4 Expansion plans and funding
Chapter 5 Market Size and Forecast, By Insulation, 2022 - 2035 (USD Million)
- 5.1 Key trends
- 5.2 Oil immersed
- 5.3 Air core
Chapter 6 Market Size and Forecast, By End Use, 2022 - 2035 (USD Million)
- 6.1 Key trends
- 6.2 Electric utility
- 6.3 Renewable energy
Chapter 7 Market Size and Forecast, By Region, 2022 - 2035 (USD Million)
- 7.1 Key trends
- 7.2 North America
- 7.2.1 U.S.
- 7.2.2 Canada
- 7.3 Europe
- 7.3.1 UK
- 7.3.2 Germany
- 7.3.3 France
- 7.3.4 Italy
- 7.3.5 Russia
- 7.4 Asia Pacific
- 7.4.1 China
- 7.4.2 India
- 7.4.3 Japan
- 7.4.4 Australia
- 7.5 Middle East & Africa
- 7.5.1 Saudi Arabia
- 7.5.2 UAE
- 7.5.3 Qatar
- 7.5.4 South Africa
- 7.6 Latin America
- 7.6.1 Brazil
- 7.6.2 Argentina
Chapter 8 Company Profiles
- 8.1 CG Power & Industrial Solutions
- 8.2 Coil Innovation
- 8.3 Fuji Electric
- 8.4 GE Vernova
- 8.5 GBE
- 8.6 GETRA
- 8.7 HICO America
- 8.8 Hilkar
- 8.9 Hitachi Energy
- 8.10 Hyosung Heavy Industries
- 8.11 Nissin Electric
- 8.12 Pennsylvania Transformer
- 8.13 Phoenix Electric
- 8.14 Prolec Energy
- 8.15 SGB SMIT
- 8.16 Shrihans Electricals
- 8.17 Siemens Energy
- 8.18 TMC Transformers Manufacturing Company
- 8.19 Toshiba Energy Systems & Solutions
- 8.20 Trench Group
- 8.21 WEG

