PUBLISHER: Global Market Insights Inc. | PRODUCT CODE: 2083281

PUBLISHER: Global Market Insights Inc. | PRODUCT CODE: 2083281
Infrastructure as Code Market Opportunity, Growth Drivers, Industry Trend Analysis, and Forecast 2026 - 2035
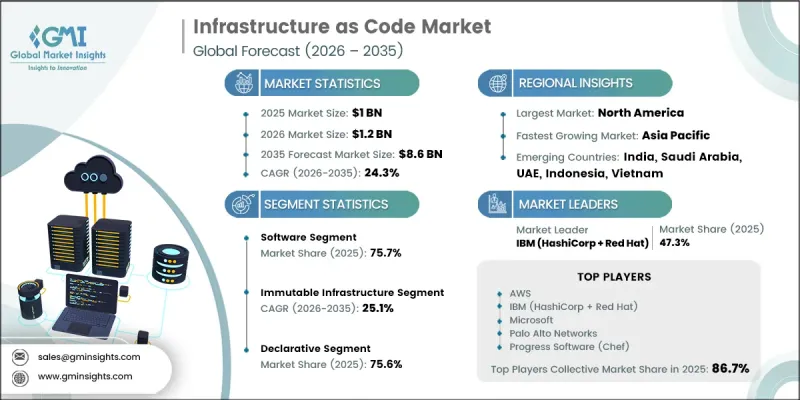
The Global Infrastructure as Code Market was valued at USD 1 billion in 2025 and is estimated to grow at a CAGR of 24.3% to reach USD 8.6 billion by 2035.
The growing expansion of cloud computing environments has significantly increased the need for automated and standardized infrastructure management solutions capable of supporting large-scale digital operations. As organizations continue to modernize their IT ecosystems and adopt multi-cloud strategies, Infrastructure as Code (IaC) has become an essential component for ensuring consistency, scalability, and operational efficiency. Businesses increasingly require automated provisioning frameworks that reduce manual intervention while enabling rapid deployment of infrastructure resources across diverse environments. The rising adoption of DevOps methodologies is further accelerating market growth, as organizations seek to streamline software development processes and improve collaboration between development and operations teams. Infrastructure as Code allows infrastructure assets to be managed using software development principles, including version control, automated testing, and continuous deployment. In addition, growing regulatory compliance requirements and increasing cybersecurity concerns are encouraging enterprises to implement infrastructure automation frameworks that strengthen governance, improve visibility, and enhance operational reliability. These factors collectively continue to drive strong demand across the global Infrastructure as Code Market.
| Market Scope | |
|---|---|
| Start Year | 2025 |
| Forecast Year | 2026-2035 |
| Start Value | $1 Billion |
| Forecast Value | $8.6 Billion |
| CAGR | 24.3% |
The immutable infrastructure segment accounted for 61.6% share in 2025 and is anticipated to grow at a CAGR of 25.1% from 2026 to 2035. Growth within this segment is closely associated with the increasing adoption of cloud-native application environments and modern software delivery practices. Rather than modifying existing infrastructure components, this approach relies on replacing resources entirely to maintain configuration consistency and operational stability. The growing preference for immutable infrastructure stems from its ability to eliminate configuration inconsistencies, reduce operational complexity, and support highly automated deployment processes. As organizations continue to prioritize scalability, reliability, and infrastructure standardization, immutable infrastructure has become an increasingly important architectural model for supporting modern digital environments and distributed application ecosystems.
The declarative segment held a 75.6% share in 2025 and is projected to grow at a CAGR of 23% through 2035. Its strong market position is largely attributed to its simplified approach to infrastructure management and its ability to support extensive automation. Under this model, users define the desired operational state of infrastructure resources, while the underlying system automatically executes the necessary actions required to achieve that state. This methodology reduces complexity, improves deployment consistency, and minimizes the risk of manual configuration errors. The declarative model has become a foundational element of modern infrastructure management by enabling organizations to maintain standardized environments, improve operational efficiency, and support resilient cloud-native architectures capable of adapting to dynamic business requirements.
U.S. Infrastructure as Code Market generated USD 303.6 million in 2025 and is forecast to grow at a CAGR of 23.9% between 2026 and 2035. The United States remains one of the most significant markets for Infrastructure as Code adoption due to widespread cloud utilization, advanced software development practices, and ongoing digital transformation initiatives across multiple industries. Organizations are increasingly leveraging infrastructure automation to improve deployment consistency, optimize resource management, and accelerate application delivery. The growing emphasis on operational agility, digital modernization, and scalable IT infrastructure continues to create favorable conditions for market expansion throughout the country. As enterprises seek greater efficiency and governance across increasingly complex technology environments, demand for Infrastructure as Code solutions is expected to remain strong.
Key participants operating within the Global Infrastructure as Code Market include Microsoft, Oracle, GitLab, Pulumi, Alibaba, Broadcom, AWS, Canonical, Alphabet, IBM, Palo Alto, Progress Software, Perforce Software, and Synk. Companies active in the Infrastructure as Code Market are pursuing a variety of strategic initiatives to strengthen their market presence and maintain competitive advantages. A primary focus area involves expanding platform capabilities through continuous product innovation, automation enhancements, and advanced security features. Market participants are increasingly investing in artificial intelligence, analytics, and intelligent automation technologies to improve infrastructure management efficiency and user experience. Strategic partnerships, acquisitions, and ecosystem collaborations are also helping organizations broaden their technological capabilities and accelerate market penetration. Vendors are prioritizing interoperability across diverse cloud environments to support growing enterprise demand for flexible deployment options. Additionally, companies are emphasizing developer productivity, compliance management, governance frameworks, and integrated security solutions to address evolving customer requirements.
Table of Contents
Chapter 1 Methodology
- 1.1 Research approach
- 1.2 Quality Commitments
- 1.2.1 GMI AI policy & data integrity commitment
- 1.2.1.1 Source consistency protocol
- 1.2.1 GMI AI policy & data integrity commitment
- 1.3 Research Trail & Confidence Scoring
- 1.3.1 Research Trail Components
- 1.3.2 Scoring Components
- 1.4 Data Collection
- 1.4.1 Partial list of primary sources
- 1.5 Data mining sources
- 1.5.1 Paid sources
- 1.5.1.1 Sources, by region
- 1.5.1 Paid sources
- 1.6 Base estimates and calculations
- 1.6.1 Base year calculation
- 1.7 Forecast model
- 1.7.1 Quantified market impact analysis
- 1.7.1.1 Mathematical impact of growth parameters on forecast
- 1.7.1 Quantified market impact analysis
- 1.8 Research transparency addendum
- 1.8.1 Source attribution framework
- 1.8.2 Quality assurance metrics
- 1.8.3 Our commitment to trust
Chapter 2 Executive Summary
- 2.1 Industry 360° synopsis
- 2.2 Key market trends
- 2.2.1 Regional
- 2.2.2 Component
- 2.2.3 Infrastructure
- 2.2.4 Approach
- 2.2.5 Deployment mode
- 2.2.6 Organization size
- 2.2.7 End use
- 2.3 TAM analysis, 2026-2035
- 2.4 CXO perspectives: Strategic imperatives
Chapter 3 Industry Insights
- 3.1 Industry ecosystem analysis
- 3.1.1 Supplier landscape
- 3.1.1.1 IaC tool vendors & platform providers
- 3.1.1.2 Cloud infrastructure providers (hyperscalers)
- 3.1.1.3 System integrators & managed service providers
- 3.1.1.4 End-user organizations (Enterprises & SMEs)
- 3.1.2 Profit margin
- 3.1.3 Cost structure
- 3.1.4 Value addition at each stage
- 3.1.5 Factor affecting the value chain
- 3.1.6 Disruptions
- 3.1.1 Supplier landscape
- 3.2 Industry impact forces
- 3.2.1 Growth drivers
- 3.2.1.1 Cloud adoption driving standardization
- 3.2.1.2 DevOps maturity boosting IaC
- 3.2.1.3 Compliance needs increasing automation
- 3.2.1.4 Cost pressure driving automation
- 3.2.2 Industry pitfalls and challenges
- 3.2.2.1 Tool fragmentation and complexity
- 3.2.2.2 Drift and state challenges
- 3.2.3 Market opportunities
- 3.2.3.1 GenAI-driven IaC automation
- 3.2.3.2 Managed IaC service growth
- 3.2.3.3 Policy-as-code security expansion
- 3.2.3.4 Emerging market expansion growth
- 3.2.1 Growth drivers
- 3.3 Growth potential analysis
- 3.4 Technology and innovation landscape
- 3.4.1 Current technological trends
- 3.4.2 Emerging technologies
- 3.5 Cost breakdown analysis
- 3.6 Regulatory landscape
- 3.6.1 North America
- 3.6.1.1 Federal Information Security Modernization Act (U.S.)
- 3.6.1.2 Canadian Centre for Cyber Security Guidelines (Canada)
- 3.6.2 Europe
- 3.6.2.1 General Data Protection Regulation (Germany)
- 3.6.2.2 National Cybersecurity Agency (Italy)
- 3.6.3 Asia Pacific
- 3.6.3.1 Cybersecurity Law (China)
- 3.6.3.2 Digital Personal Data Protection Act (India)
- 3.6.4 Latin America
- 3.6.4.1 Brazilian Internet Act (Brazil)
- 3.6.4.2 National Cybersecurity Strategy (Mexico)
- 3.6.5 Middle East & Africa
- 3.6.5.1 UAE Personal Data Protection Law (Dubai)
- 3.6.5.2 Cloud Computing Regulatory Framework (Saudi Arabia)
- 3.6.1 North America
- 3.7 Porter's analysis
- 3.8 PESTEL analysis
- 3.9 Patent analysis (Driven by primary research)
- 3.10 Impact of AI & Generative AI on the Market
- 3.10.1 AI-driven disruption of existing business models
- 3.10.2 Gen AI use cases & adoption roadmap by segment
- 3.10.3 Risks, limitations & regulatory considerations
- 3.11 Sustainability and environmental aspects
- 3.11.1 Sustainable practices
- 3.11.2 Waste reduction strategies
- 3.11.3 Energy efficiency in production
- 3.11.4 Eco-friendly initiatives
- 3.11.5 Carbon footprint considerations
- 3.12 Forecast assumptions & scenario analysis (Driven by primary research)
- 3.12.1 Base Case - key macro & industry variables driving CAGR
- 3.12.2 Optimistic Scenarios - Favorable macro and industry tailwinds
- 3.12.3 Pessimistic Scenario - Macroeconomic slowdown or industry headwinds
Chapter 4 Competitive Landscape, 2025
- 4.1 Introduction
- 4.2 Company market share analysis
- 4.2.1 North America
- 4.2.2 Europe
- 4.2.3 Asia Pacific
- 4.2.4 LATAM
- 4.2.5 MEA
- 4.3 Competitive analysis of major market players
- 4.4 Competitive positioning matrix
- 4.5 Key developments
- 4.5.1 Mergers & acquisitions
- 4.5.2 Partnerships & collaborations
- 4.5.3 New product launches
- 4.5.4 Expansion plans and funding
- 4.6 Company tier benchmarking
- 4.6.1 Tier classification criteria & qualifying thresholds
- 4.6.2 Tier positioning matrix by revenue, geography & innovation
Chapter 5 Market Estimates & Forecast, By Component, 2022 - 2035 ($Mn)
- 5.1 Key trends
- 5.2 Software
- 5.2.1 Configuration management
- 5.2.2 Orchestration
- 5.2.3 Provisioning
- 5.2.4 Security & compliance (policy-as-code)
- 5.2.5 Monitoring & observability
- 5.3 Services
- 5.3.1 Professional services
- 5.3.1.1 Consulting & strategy
- 5.3.1.2 Integration & deployment
- 5.3.1.3 Training & education
- 5.3.1.4 Support & maintenance
- 5.3.2 Managed services
- 5.3.1 Professional services
Chapter 6 Market Estimates & Forecast, By Infrastructure, 2022 - 2035 ($Mn)
- 6.1 Key trends
- 6.2 Mutable infrastructure
- 6.3 Immutable infrastructure
Chapter 7 Market Estimates & Forecast, By Approach, 2022 - 2035 ($Mn)
- 7.1 Key trends
- 7.2 Declarative
- 7.3 Imperative
Chapter 8 Market Estimates & Forecast, By Deployment Mode, 2022 - 2035 ($Mn)
- 8.1 Key trends
- 8.2 Cloud-based
- 8.3 On-premises
Chapter 9 Market Estimates & Forecast, By Organization Size, 2022 - 2035 ($Mn)
- 9.1 Key trends
- 9.2 Large enterprises
- 9.3 SMEs
Chapter 10 Market Estimates & Forecast, By End Use, 2022 - 2035 ($Mn)
- 10.1 Key trends
- 10.2 IT & telecom
- 10.3 BFSI
- 10.4 Healthcare & life sciences
- 10.5 Government & public sector
- 10.6 Retail & E-commerce
- 10.7 Manufacturing
- 10.8 Energy & utilities
- 10.9 Media & entertainment
- 10.10 Transportation & logistics
- 10.11 Education
- 10.12 Others
Chapter 11 Market Estimates & Forecast, By Region, 2022 - 2035 ($Mn)
- 11.1 Key trends
- 11.2 North America
- 11.2.1 U.S.
- 11.2.2 Canada
- 11.3 Europe
- 11.3.1 Germany
- 11.3.2 UK
- 11.3.3 France
- 11.3.4 Italy
- 11.3.5 Spain
- 11.3.6 Nordics
- 11.3.7 Russia
- 11.3.8 Netherlands
- 11.4 Asia Pacific
- 11.4.1 China
- 11.4.2 India
- 11.4.3 Japan
- 11.4.4 South Korea
- 11.4.5 Australia
- 11.4.6 Vietnam
- 11.4.7 Indonesia
- 11.5 LATAM
- 11.5.1 Brazil
- 11.5.2 Mexico
- 11.5.3 Argentina
- 11.6 MEA
- 11.6.1 South Africa
- 11.6.2 Saudi Arabia
- 11.6.3 UAE
Chapter 12 Company Profiles
- 12.1 Global players
- 12.1.1 Alphabet
- 12.1.2 AWS
- 12.1.3 GitLab
- 12.1.4 IBM (HashiCorp + Red Hat)
- 12.1.5 Microsoft (Azure + GitHub)
- 12.1.6 Palo Alto (Bridgecrew)
- 12.1.7 Pulumi
- 12.1.8 Snyk
- 12.2 Regional players
- 12.2.1 Alibaba
- 12.2.2 Broadcom
- 12.2.3 Canonical
- 12.2.4 Harness
- 12.2.5 Northern.tech (CFEngine)
- 12.2.6 Oracle
- 12.2.7 Perforce Software (Puppet)
- 12.2.8 Progress Software (Chef)
- 12.3 Emerging players
- 12.3.1 env0
- 12.3.2 Spacelift
- 12.3.3 Terramate
- 12.3.4 Upbound

