PUBLISHER: Global Market Insights Inc. | PRODUCT CODE: 2101546

PUBLISHER: Global Market Insights Inc. | PRODUCT CODE: 2101546
Magnesium Sulfate Market Opportunity, Growth Drivers, Industry Trend Analysis, and Forecast 2026 - 2035
The Global Magnesium Sulfate Market was valued at USD 1.8 billion in 2025 and is estimated to grow at a CAGR of 4.4% to reach USD 2.8 billion by 2035.
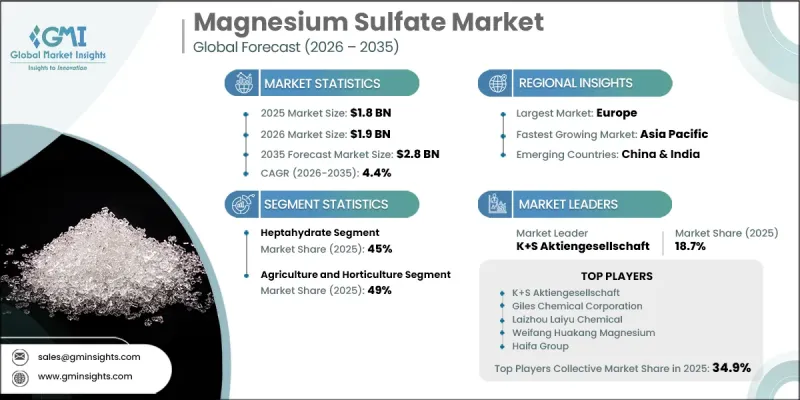
Market growth is supported by consistent demand from the agriculture, pharmaceutical, and industrial sectors across both developed and emerging economies. Increasing emphasis on improving crop productivity, maintaining soil health, and enhancing agricultural efficiency is driving the adoption of magnesium sulfate as an important secondary nutrient source. As intensive farming practices continue to accelerate nutrient depletion, growers are increasingly incorporating magnesium- and sulfur-based fertilizers into nutrient management programs to improve plant development and overall crop performance. The growing adoption of precision agriculture is further encouraging balanced fertilizer application, creating additional opportunities for magnesium sulfate consumption. Beyond agriculture, demand is also rising across pharmaceutical manufacturing, specialty chemicals, and industrial processing due to the compound's broad functional properties and versatile applications. Continued expansion of these end-use industries, together with increasing awareness of efficient nutrient management and diversified industrial demand, is expected to support steady growth of the global magnesium sulfate market throughout the forecast period.
| Market Scope | |
|---|---|
| Start Year | 2025 |
| Forecast Year | 2026-2035 |
| Start Value | $1.8 Billion |
| Forecast Value | $2.8 Billion |
| CAGR | 4.4% |
The heptahydrate segment (Epsom salt, MgSO4*7H2O) generated USD 841.5 million in 2025 holding 45% share. The segment is projected to grow at a CAGR of 5.1% through 2035. Its continued growth is supported by expanding applications across agriculture, pharmaceuticals, personal care, wellness products, nutraceuticals, and other consumer-focused industries. The versatility of heptahydrate magnesium sulfate continues to strengthen demand across both industrial and consumer markets.
The pharmaceuticals and healthcare segment accounted for 16% share in 2025 and generated USD 299.2 million. Growing pharmaceutical production and increasing focus on supply chain resilience are encouraging manufacturers to diversify sourcing strategies and establish broader supplier networks. These efforts are expected to support sustained demand for pharmaceutical-grade magnesium sulfate across global healthcare markets.
North America Magnesium Sulfate Market was valued at USD 317.9 million in 2025. The United States continues to lead regional demand, supported by strong agricultural activity and increasing use of magnesium sulfate to improve soil fertility and crop productivity. Ongoing adoption of balanced nutrient management practices, combined with growing demand from pharmaceutical and industrial applications, continues to strengthen the market across North America.
Major companies operating in the global magnesium sulfate market include K+S Aktiengesellschaft, Giles Chemical Corporation, Laizhou Laiyu Chemical, Weifang Huakang Magnesium, and Haifa Group. Companies participating in the magnesium sulfate market are strengthening their competitive position through continuous product innovation, production capacity expansion, and portfolio diversification. Manufacturers are investing in advanced production technologies to improve product quality, operational efficiency, and supply reliability while meeting evolving customer requirements across agricultural, pharmaceutical, and industrial sectors. Strategic partnerships, distribution network expansion, and geographic diversification are enabling companies to strengthen market penetration and broaden their customer base. Businesses are also emphasizing research and development to develop high-performance formulations and improve application efficiency.
Table of Contents
Chapter 1 Methodology & Scope
- 1.1 Research approach
- 1.2 Quality Commitments
- 1.2.1 GMI AI policy & data integrity commitment
- 1.2.1.1 Source consistency protocol
- 1.2.1 GMI AI policy & data integrity commitment
- 1.3 Research Trail & Confidence Scoring
- 1.3.1 Research Trail Components
- 1.3.2 Scoring Components
- 1.4 Data Collection
- 1.4.1 Partial list of primary sources
- 1.5 Data mining sources
- 1.5.1 Paid sources
- 1.5.1.1 Sources, by region
- 1.5.1 Paid sources
- 1.6 Base estimates and calculations
- 1.6.1 Base year calculation for any one approach
- 1.7 Forecast model
- 1.7.1 Quantified market impact analysis
- 1.7.1.1 Mathematical impact of growth parameters on forecast
- 1.7.1 Quantified market impact analysis
- 1.8 Research transparency addendum
- 1.8.1 Source attribution framework
- 1.8.2 Quality assurance metrics
- 1.8.3 Our commitment to trust
Chapter 2 Executive Summary
- 2.1 Industry 360° synopsis
- 2.2 Key market trends
- 2.2.1 Regional
- 2.2.2 By Product Type
- 2.2.3 By Physical Form
- 2.2.4 By Grade
- 2.2.5 By End User
- 2.3 TAM Analysis, 2026 2035
- 2.4 CXO perspectives: Strategic imperatives
Chapter 3 Industry Insights
- 3.1 Industry ecosystem analysis
- 3.1.1 Supplier landscape
- 3.1.2 Profit margin
- 3.1.3 Value addition at each stage
- 3.1.4 Factor affecting the value chain
- 3.1.5 Disruptions
- 3.2 Industry impact forces
- 3.2.1 Growth drivers
- 3.2.2 Industry pitfalls and challenges
- 3.2.3 Market opportunities
- 3.3 Growth potential analysis
- 3.4 Regulatory landscape
- 3.4.1 North America
- 3.4.2 Europe
- 3.4.3 Asia Pacific
- 3.4.4 Latin America
- 3.4.5 Middle East & Africa
- 3.5 Porter's analysis
- 3.6 PESTEL analysis
- 3.7 Price trends
- 3.7.1 By region
- 3.7.2 By Product Type
- 3.8 Future market trends
- 3.9 Technology and Innovation landscape
- 3.9.1 Current technological trends
- 3.9.2 Emerging technologies
- 3.10 Patent Landscape
- 3.11 Trade statistics (HS code)
- 3.11.1 Major importing countries
- 3.11.2 Major exporting countries
- 3.12 Sustainability and environmental aspects
- 3.12.1 Sustainable practices
- 3.12.2 Waste reduction strategies
- 3.12.3 Energy efficiency in production
- 3.12.4 Eco friendly initiatives
Chapter 4 Competitive Landscape, 2025
- 4.1 Introduction
- 4.2 Company market share analysis
- 4.2.1 By region
- 4.2.1.1 North America
- 4.2.1.2 Europe
- 4.2.1.3 Asia Pacific
- 4.2.1.4 LATAM
- 4.2.1.5 MEA
- 4.2.1 By region
- 4.3 Company matrix analysis
- 4.4 Competitive analysis of major market players
- 4.5 Competitive positioning matrix
- 4.6 Key developments
- 4.6.1 Mergers & acquisitions
- 4.6.2 Partnerships & collaborations
- 4.6.3 New Product Launches
- 4.6.4 Expansion Plans
Chapter 5 Market Estimates and Forecast, By Product Type, 2022 to 2035 (USD Million) (Tons)
- 5.1 Key trends
- 5.2 Monohydrate
- 5.3 Heptahydrate
- 5.4 Anhydrous
Chapter 6 Market Estimates and Forecast, By Physical Form, 2022 to 2035 (USD Million) (Tons)
- 6.1 Key trends
- 6.2 Granular
- 6.3 Powder
- 6.4 Crystalline
- 6.5 Liquid
Chapter 7 Market Estimates and Forecast, By Grade, 2022 to 2035 (USD Million) (Tons)
- 7.1 Key trends
- 7.2 Agriculture
- 7.3 Medical/Pharmaceutical
- 7.4 Food
- 7.5 Feed
- 7.6 Industrial
- 7.7 Consumer
Chapter 8 Market Estimates and Forecast, By End User, 2022 to 2035 (USD Million) (Tons)
- 8.1 Key trends
- 8.2 Agriculture & Horticulture
- 8.3 Pharmaceutical & Healthcare
- 8.4 Food & Beverage
- 8.5 Animal Feed
- 8.6 Chemical Manufacturing
- 8.7 Consumer Goods
Chapter 9 Market Estimates and Forecast, By Region, 2022 to 2035 (USD Million) (Tons)
- 9.1 Key trends
- 9.2 North America
- 9.2.1 U.S.
- 9.2.2 Canada
- 9.3 Europe
- 9.3.1 Germany
- 9.3.2 UK
- 9.3.3 France
- 9.3.4 Spain
- 9.3.5 Italy
- 9.3.6 Rest of Europe
- 9.4 Asia Pacific
- 9.4.1 China
- 9.4.2 India
- 9.4.3 Japan
- 9.4.4 Australia
- 9.4.5 South Korea
- 9.4.6 Rest of Asia Pacific
- 9.5 Latin America
- 9.5.1 Brazil
- 9.5.2 Mexico
- 9.5.3 Argentina
- 9.5.4 Rest of Latin America
- 9.6 Middle East and Africa
- 9.6.1 Saudi Arabia
- 9.6.2 South Africa
- 9.6.3 UAE
- 9.6.4 Rest of Middle East and Africa
Chapter 10 Company Profiles
- 10.1 K+S Aktiengesellschaft
- 10.2 Giles Chemical Corporation
- 10.3 Laizhou Laiyu Chemical
- 10.4 Weifang Huakang Magnesium
- 10.5 Haifa Group
- 10.6 Penoles (Industrias Penoles)
- 10.7 Mani Agro Chemicals
- 10.8 Zorka Pharma

