PUBLISHER: Global Market Insights Inc. | PRODUCT CODE: 2101666

PUBLISHER: Global Market Insights Inc. | PRODUCT CODE: 2101666
Corporate Bond Market Opportunity, Growth Drivers, Industry Trend Analysis, and Forecast 2026 - 2035
The Global Corporate Bond Market was valued at USD 48.7 trillion in 2025 and is estimated to grow at a CAGR of 4.2% to reach USD 73 trillion by 2035.
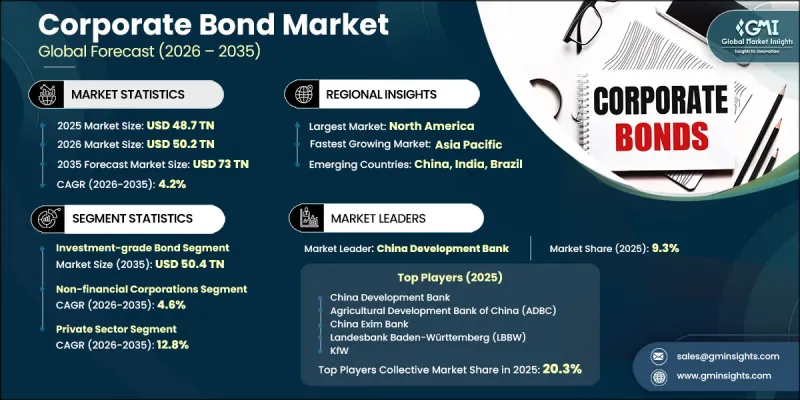
Growth is driven by increasing corporate reliance on long-term debt instruments to finance infrastructure development, energy transition initiatives, and operational capital requirements. Institutional participation continues to deepen through exchange-traded funds (ETFs) and other structured fixed-income investment vehicles, further broadening market accessibility. The ongoing integration of environmental, social, and governance (ESG) considerations into corporate financing decisions is also reshaping issuance trends and attracting a more diversified investor base. In addition, capital market liberalization across Asia Pacific and the Middle East is expanding issuance opportunities and introducing new classes of issuers. Corporations in capital-intensive industries such as energy, transportation, infrastructure, and telecommunications are increasingly extending debt maturities to support multi-year investment strategies linked to digital transformation and sustainability goals. Expansion in global institutional assets under management and the growing interconnectedness of international credit markets are reinforcing structural demand for corporate debt instruments worldwide.
| Market Scope | |
|---|---|
| Start Year | 2025 |
| Forecast Year | 2026-2035 |
| Start Value | $48.7 Trillion |
| Forecast Value | $73 Trillion |
| CAGR | 4.2% |
The investment-grade corporate bond segment generated USD 35.1 trillion, holding 72.1% share in 2025, and is projected to reach USD 50.4 trillion by 2035, growing at a CAGR of 3.8%. This segment remains the backbone of global corporate debt markets due to its strong appeal among institutional investors, including pension funds, insurance companies, central banks, and large asset managers. Its dominance is reinforced by strict credit quality requirements, where securities rated BBB-/Baa3 or higher are widely accepted under regulatory and internal investment mandates, ensuring stable demand across market cycles.
The non-financial corporate issuer segment captured USD 27.6 trillion in 2025. This segment includes companies operating across industrial, technology, healthcare, consumer, energy, and infrastructure sectors that actively use bond markets to fund capital investments, acquisitions, operational expansion, and shareholder returns. Growth in this segment reflects a broader shift toward capital market financing as corporations increasingly rely on bond issuance due to tighter bank lending conditions influenced by regulatory capital requirements.
North America Corporate Bond Market reached USD 23.4 trillion in 2025. Market leadership in North America is supported by highly developed capital markets, strong secondary market liquidity, a well-established credit rating ecosystem, and a broad institutional investor base that includes pension funds, mutual funds, insurance companies, and global reserve managers.
Major companies operating in the global corporate bond market include JPMorgan Chase, Morgan Stanley, Goldman Sachs, China Development Bank, Agricultural Development Bank of China, China Exim Bank, Landesbank Baden-Wurttemberg, KfW, Agricultural Bank of China, and the European Investment Bank (EIB). Companies operating in the corporate bond market are strengthening their competitive positioning through diversification of issuance strategies, expansion of investor outreach programs, and integration of ESG-linked financing frameworks. Financial institutions are increasingly structuring bonds with sustainability-linked features to attract environmentally focused investors and meet evolving regulatory expectations. Firms are also enhancing digital issuance platforms to improve transaction efficiency and broaden market access for global investors. Strategic advisory services, underwriting innovation, and risk management capabilities are being strengthened to support large-scale and cross-border bond issuances.
Table of Contents
Chapter 1 Methodology & Scope
- 1.1 Research approach
- 1.2 Quality Commitments
- 1.2.1 GMI AI policy & data integrity commitment
- 1.2.1.1 Source consistency protocol
- 1.2.1 GMI AI policy & data integrity commitment
- 1.3 Research Trail & Confidence Scoring
- 1.3.1 Research Trail Components
- 1.3.2 Scoring Components
- 1.4 Data Collection
- 1.4.1 Partial list of primary sources
- 1.5 Data mining sources
- 1.5.1 Paid sources
- 1.5.1.1 Sources, by region
- 1.5.1 Paid sources
- 1.6 Base estimates and calculations
- 1.6.1 Base year calculation
- 1.7 Forecast
- 1.7.1 Quantified market impact analysis
- 1.7.1.1 Mathematical impact of growth parameters on forecast
- 1.7.1 Quantified market impact analysis
- 1.8 Research transparency addendum
- 1.8.1 Source attribution framework
- 1.8.2 Quality assurance metrics
- 1.8.3 Our commitment to trust
Chapter 2 Executive Summary
- 2.1 Industry 360° synopsis
- 2.2 Key market trends
- 2.2.1 Regional
- 2.2.2 Bond Type
- 2.2.3 Issuer Type
- 2.2.4 Maturity
- 2.2.5 Distribution Channel
- 2.2.6 Coupon Structure
- 2.3 TAM Analysis, 2026-2035
- 2.4 CXO perspectives: Strategic imperatives
Chapter 3 Industry Insights
- 3.1 Industry ecosystem analysis
- 3.1.1 Supplier landscape
- 3.1.1.1 Raw material suppliers
- 3.1.1.2 Component suppliers
- 3.1.1.3 Manufacturers
- 3.1.1.4 Service providers
- 3.1.1.5 Distribution channel
- 3.1.1.6 End Use
- 3.1.2 Cost structure
- 3.1.3 Profit margin
- 3.1.4 Value addition at each stage
- 3.1.5 Vertical integration trends
- 3.1.6 Disruptors
- 3.1.1 Supplier landscape
- 3.2 Industry impact forces
- 3.2.1 Growth drivers
- 3.2.1.1 Increasing corporate demand for long-term financing.
- 3.2.1.2 Expansion of global capital markets and institutional investment.
- 3.2.1.3 Favorable regulatory frameworks supporting corporate debt issuance.
- 3.2.1.4 Growing infrastructure, ESG, and refinancing investment needs.
- 3.2.2 Market Restraints
- 3.2.2.1 Interest rate volatility increasing borrowing costs and reducing issuance.
- 3.2.2.2 Credit default risk and widening credit spreads during economic uncertainty.
- 3.2.3 Market Opportunities
- 3.2.3.1 Growing adoption of sustainable and green corporate bonds.
- 3.2.3.2 Rising issuance of floating-rate notes amid higher interest rates.
- 3.2.3.3 Increasing participation of institutional and retail investors through ETFs.
- 3.2.3.4 Digitalization of bond issuance, trading, and settlement using fintech solutions.
- 3.2.1 Growth drivers
- 3.3 Growth potential analysis
- 3.4 Pricing Analysis (Driven by Primary Research)
- 3.4.1 Historical Price Trend Analysis
- 3.4.2 Pricing Strategy by Player Type (Premium / Value / Cost-plus)
- 3.5 Regulatory landscape
- 3.5.1 International
- 3.5.1.1 Basel III Capital Framework
- 3.5.2 Regional
- 3.5.2.1 North America
- 3.5.2.1.1 U.S. Securities Act of 1933 & SEC Rule 144A
- 3.5.2.2 Europe
- 3.5.2.2.1 EU Prospectus Regulation & MiFID II
- 3.5.2.3 Asia-Pacific
- 3.5.2.3.1 China Interbank Bond Market (CIBM) Regulations
- 3.5.2.4 Latin America
- 3.5.2.4.1 Brazil CVM Public Securities Offering Framework (CVM Resolution 160)
- 3.5.2.5 Middle East & Africa
- 3.5.2.5.1 Saudi Capital Market Authority (CMA) Debt Instruments Rules
- 3.5.2.1 North America
- 3.5.1 International
- 3.6 Technology and Innovation landscape
- 3.6.1 Current technologies
- 3.6.2 Emerging technologies
- 3.7 Porter’s analysis
- 3.8 PESTEL analysis
- 3.9 Patent analysis (Driven by Primary Research)
- 3.10 Impact of AI & generative AI on the market
- 3.10.1 AI-Driven Disruption of Existing Business Models
- 3.10.2 Automated design optimization
- 3.10.3 Supply chain AI for demand forecasting
- 3.10.4 GenAI use cases & adoption roadmap by segment
- 3.10.5 Risks, Limitations & Regulatory Considerations
- 3.11 Sustainability and environmental aspects
- 3.11.1 Sustainable practices
- 3.11.2 Waste reduction strategies
- 3.11.3 Energy efficiency in production
- 3.11.4 Eco-friendly Initiatives
- 3.11.5 Carbon footprint considerations
- 3.12 Forecast assumptions & scenario analysis (Driven by Primary Research)
- 3.12.1 Base Case - key macro & industry variables driving CAGR
- 3.12.2 Optimistic Scenarios - Favorable Macro and Industry Tailwinds
- 3.12.3 Pessimistic Scenario - Macroeconomic slowdown or industry headwinds
Chapter 4 Competitive Landscape, 2025
- 4.1 Introduction
- 4.2 Company market share analysis
- 4.2.1 North America
- 4.2.2 Europe
- 4.2.3 Asia-Pacific
- 4.2.4 Latin America
- 4.2.5 Middle East & Africa
- 4.3 Competitive positioning matrix
- 4.4 Key developments
- 4.4.1 Mergers & acquisitions
- 4.4.2 Partnerships & collaborations
- 4.4.3 New product launches
- 4.4.4 Expansion plans and funding
- 4.5 Company tier benchmarking
- 4.5.1 Tier classification criteria & qualifying thresholds
- 4.5.2 Tier positioning matrix by revenue, geography & innovation
Chapter 5 Market Estimates & Forecast, By Bond Type, 2022 - 2035 ($Mn)
- 5.1 Key trends
- 5.2 Investment-Grade Bonds
- 5.3 High-Yield (Junk) Bonds
- 5.4 Convertible Bonds
- 5.5 Zero-Coupon Bonds
- 5.6 Floating-Rate Notes (FRNs)
- 5.7 Perpetual Bonds
Chapter 6 Market Estimates & Forecast, By Issuer, 2022 - 2035 ($Mn)
- 6.1 Key trends
- 6.2 Financial Corporations
- 6.2.1 Banks
- 6.2.2 Insurance Companies
- 6.2.3 Asset Managers
- 6.2.4 Other
- 6.3 Non-Financial Corporations
- 6.3.1 Manufacturing
- 6.3.2 Technology
- 6.3.3 Healthcare
- 6.3.4 Energy & Utilities
- 6.3.5 Consumer Goods
- 6.3.6 Telecommunications
- 6.3.7 Others
Chapter 7 Market Estimates & Forecast, By Maturity, 2022 - 2035 ($Mn)
- 7.1 Key trends
- 7.2 Short-Term (< 3 Years)
- 7.3 Medium-Term (3–10 Years)
- 7.4 Long-Term (> 10 Years)
Chapter 8 Market Estimates & Forecast, By Distribution Channel, 2022 - 2035 ($Mn)
- 8.1 Key trends
- 8.2 Primary Market
- 8.3 Secondary Market
- 8.4 Term (> 10 Years)
Chapter 9 Market Estimates & Forecast, By Coupon Structure, 2022 - 2035 ($Mn)
- 9.1 Key trends
- 9.2 Fixed-Rate Bonds
- 9.3 Floating-Rate Bonds
- 9.4 Zero-Coupon Bonds
- 9.5 Other
Chapter 10 Market Estimates & Forecast, By Region, 2022 - 2035 ($Mn)
- 10.1 North America
- 10.1.1 US
- 10.1.2 Canada
- 10.2 Europe
- 10.2.1 UK
- 10.2.2 Germany
- 10.2.3 France
- 10.2.4 Italy
- 10.2.5 Spain
- 10.2.6 Belgium
- 10.2.7 Netherlands
- 10.2.8 Sweden
- 10.2.9 Russia
- 10.3 Asia Pacific
- 10.3.1 China
- 10.3.2 India
- 10.3.3 Japan
- 10.3.4 Australia
- 10.3.5 Singapore
- 10.3.6 South Korea
- 10.3.7 Vietnam
- 10.3.8 Indonesia
- 10.3.9 Thailand
- 10.4 Latin America
- 10.4.1 Brazil
- 10.4.2 Mexico
- 10.4.3 Argentina
- 10.5 MEA
- 10.5.1 South Africa
- 10.5.2 Saudi Arabia
- 10.5.3 UAE
Chapter 11 Company Profiles
- 11.1 Global Players
- 11.1.1 JPMorgan Chase
- 11.1.2 Bank of America
- 11.1.3 Citigroup
- 11.1.4 Goldman Sachs
- 11.1.5 Morgan Stanley
- 11.1.6 HSBC
- 11.1.7 BlackRock
- 11.1.8 BNP Paribas
- 11.1.9 Barclays
- 11.1.10 Wells Fargo
- 11.2 Regional Players
- 11.2.1 China Development Bank
- 11.2.2 Agricultural Development Bank of China
- 11.2.3 China Exim Bank
- 11.2.4 Landesbank Baden-Wurttemberg
- 11.2.5 KfW
- 11.2.6 Agricultural Bank of China
- 11.2.7 European Investment Bank
- 11.2.8 State Grid Corporation of China
- 11.2.9 PIMCO

