PUBLISHER: Global Market Insights Inc. | PRODUCT CODE: 2101688

PUBLISHER: Global Market Insights Inc. | PRODUCT CODE: 2101688
Salt Reduction Ingredients Market Opportunity, Growth Drivers, Industry Trend Analysis, and Forecast 2026 - 2035
The Global Salt Reduction Ingredients Market was valued at USD 3.8 billion in 2025 and is estimated to grow at a CAGR of 5.5% to reach USD 6.5 billion by 2035.
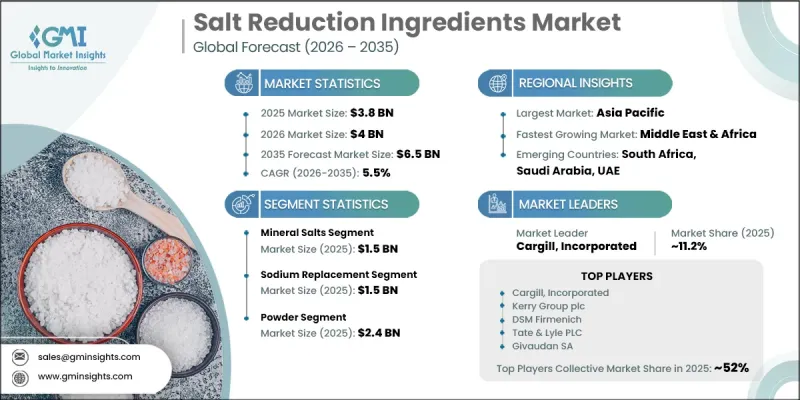
The salt reduction ingredients market is expanding as food and beverage manufacturers increasingly develop products with lower sodium content while maintaining taste, texture, preservation properties, and overall product quality. These ingredients are designed to support sodium reduction without significantly affecting consumer acceptance, allowing manufacturers to respond to growing demand for healthier food options. The market includes a broad range of ingredient solutions that help improve flavor balance and product performance across numerous food applications. Rising awareness of the health risks associated with excessive sodium intake is encouraging manufacturers to reformulate existing products and introduce reduced-sodium alternatives that align with changing consumer preferences. Increasing attention to nutritional labeling and healthier dietary choices across both developed and developing economies is further accelerating demand. As consumers become more conscious of ingredient quality and nutritional value, food producers continue investing in innovative sodium reduction technologies that maintain product appeal while supporting public health objectives. Continuous advancements in ingredient development and formulation technologies are expected to sustain long-term growth across the global salt reduction ingredients market.
| Market Scope | |
|---|---|
| Start Year | 2025 |
| Forecast Year | 2026-2035 |
| Start Value | $3.8 Billion |
| Forecast Value | $6.5 Billion |
| CAGR | 5.5% |
The mineral salts segment generated USD 1.5 billion in 2025. The segment continues to maintain strong demand because these ingredients provide functionality that closely resembles conventional salt while supporting effective sodium reduction. At the same time, alternative flavor-enhancing ingredient categories are gaining wider acceptance as manufacturers seek solutions that improve taste profiles while maintaining product quality. Continued innovation in ingredient formulations is enabling food manufacturers to reduce sodium levels without compromising overall sensory performance across a broad range of processed food products.
The food & beverages segment accounted for USD 2.5 billion in 2025. Food manufacturers continue to represent the primary consumers of these ingredients as they reformulate products to meet evolving nutritional expectations. Increasing demand for healthier food choices is encouraging greater adoption of sodium reduction technologies that preserve flavor, texture, processing performance, and shelf stability. Ongoing product reformulation initiatives and expanding consumer preference for balanced nutrition continue to strengthen demand across the food and beverage industry.
North America Salt Reduction Ingredients Market reached USD 1.1 billion in 2025. Regional demand is being supported by rising consumer preference for healthier packaged food products and increasing efforts by manufacturers to reduce sodium content across multiple food categories. Continued investment in advanced flavor optimization technologies and product reformulation initiatives is helping food manufacturers deliver reduced-sodium products while maintaining taste, texture, and overall product quality. These factors are expected to support continued market expansion across North America.
Major companies operating in the global salt reduction ingredients market include Cargill, Incorporated, Kerry Group plc, DSM Firmenich, Tate & Lyle PLC, Givaudan SA, Ajinomoto Co., Inc., Archer Daniels Midland (ADM), Jungbunzlauer Suisse AG, Angel Yeast Co., Ltd., Corbion N.V., Biospringer (Lesaffre Group), and Innophos Holdings, Inc. Companies operating in the salt reduction ingredients market are strengthening their competitive position by investing in research and development to create advanced ingredient solutions that improve flavor while supporting sodium reduction. Manufacturers are expanding product portfolios with innovative formulations that help food producers meet changing nutritional preferences without compromising product quality. Strategic collaborations, acquisitions, and partnerships are enabling businesses to broaden their technological capabilities and expand their global presence. Companies are also increasing production capacity, improving supply chain efficiency, and emphasizing sustainable manufacturing practices to enhance operational performance.
Table of Contents
Chapter 1 Methodology & Scope
- 1.1 Market scope and definition
- 1.2 Research design
- 1.2.1 Research approach
- 1.2.2 Data collection methods
- 1.3 Data mining sources
- 1.3.1 Global
- 1.3.2 Regional/Country
- 1.4 Base estimates and calculations
- 1.4.1 Base year calculation
- 1.4.2 Key trends for market estimation
- 1.5 Primary research and validation
- 1.5.1 Primary sources
- 1.6 Forecast model
- 1.7 Research assumptions and limitations
Chapter 2 Executive Summary
- 2.1 Industry 360° synopsis
- 2.2 Key market trends
- 2.2.1 Regional
- 2.2.2 Ingredient Type
- 2.2.3 Functionality
- 2.2.4 Form
- 2.2.5 Application
- 2.2.6 End-User
- 2.3 TAM Analysis, 2026-2035
- 2.4 CXO perspectives: Strategic imperatives
- 2.4.1 Executive decision points
- 2.4.2 Critical success factors
- 2.5 Future Outlook and Strategic Recommendations
Chapter 3 Industry Insights
- 3.1 Industry ecosystem analysis
- 3.1.1 Supplier Landscape
- 3.1.2 Profit Margin
- 3.1.3 Value addition at each stage
- 3.1.4 Factor affecting the value chain
- 3.1.5 Disruptions
- 3.2 Industry impact forces
- 3.2.1 Growth drivers
- 3.2.1.1 Rising demand for low-sodium foods
- 3.2.1.2 Increasing consumer health consciousness globally
- 3.2.1.3 Sodium reduction regulatory initiatives expanding
- 3.2.2 Industry pitfalls and challenges
- 3.2.2.1 Taste challenges in reformulated products
- 3.2.2.2 Higher formulation and ingredient costs
- 3.2.3 Market opportunities
- 3.2.3.1 Expansion in processed food applications
- 3.2.3.2 Development of advanced flavor technologies
- 3.2.1 Growth drivers
- 3.3 Growth potential analysis
- 3.4 Regulatory landscape
- 3.4.1 North America
- 3.4.2 Europe
- 3.4.3 Asia Pacific
- 3.4.4 Latin America
- 3.4.5 Middle East & Africa
- 3.5 Porter's analysis
- 3.6 PESTEL analysis
- 3.6.1 Technology and innovation landscape
- 3.6.2 Current technological trends
- 3.6.3 Emerging technologies
- 3.7 Price trends
- 3.7.1 By region
- 3.7.2 By product type
- 3.8 Future market trends
- 3.9 Technology and Innovation Landscape
- 3.9.1 Current technological trends
- 3.9.2 Emerging technologies
- 3.10 Patent Landscape
- 3.11 Trade statistics (HS code) (Note: the trade statistics will be provided for key countries only)
- 3.11.1 Major importing countries
- 3.11.2 Major exporting countries
- 3.12 Sustainability and environmental aspects
- 3.12.1 Sustainable practices
- 3.12.2 Waste reduction strategies
- 3.12.3 Energy efficiency in production
- 3.12.4 Eco-friendly initiatives
- 3.13 Carbon Footprint Considerations
Chapter 4 Competitive Landscape, 2025
- 4.1 Introduction
- 4.2 Company market share analysis
- 4.2.1 By region
- 4.2.1.1 North America
- 4.2.1.2 Europe
- 4.2.1.3 Asia Pacific
- 4.2.1.4 LATAM
- 4.2.1.5 MEA
- 4.2.1 By region
- 4.3 Company matrix analysis
- 4.4 Competitive analysis of major market players
- 4.5 Competitive positioning matrix
- 4.6 Key developments
- 4.6.1 Mergers & acquisitions
- 4.6.2 Partnerships & collaborations
- 4.6.3 New product launches
- 4.6.4 Expansion plans
Chapter 5 Market Estimates and Forecast, By Ingredient Type, 2022 – 2035 (USD Million) (Kilo Tons)
- 5.1 Key trends
- 5.2 Mineral Salts
- 5.2.1 Potassium Chloride (KCl)
- 5.2.2 Magnesium Sulfate
- 5.2.3 Calcium Chloride
- 5.2.4 Potassium Sulfate (K2SO4)
- 5.2.5 Others
- 5.3 Yeast Extracts
- 5.3.1 Standard Yeast Extracts
- 5.3.2 High-Glutamate Yeast Extracts
- 5.3.3 Autolyzed Yeast Extracts
- 5.4 Amino Acids
- 5.4.1 Glutamic Acid
- 5.4.2 Glycine
- 5.4.3 Lysine
- 5.4.4 Others
- 5.5 Glutamates
- 5.5.1 Monosodium Glutamate (MSG)
- 5.5.2 Dipotassium Glutamate (DSG)
- 5.5.3 Others
- 5.6 High Nucleotide Ingredients
- 5.6.1 Disodium Inosinate (IMP)
- 5.6.2 Disodium Guanylate (GMP)
- 5.6.3 Calcium Inosinate
- 5.6.4 Others
- 5.7 Hydrolyzed Vegetable Protein (HVP)
- 5.7.1 Soy Protein Hydrolysates
- 5.7.2 Wheat Protein Hydrolysates
- 5.7.3 Corn Protein Hydrolysates
Chapter 6 Market Estimates and Forecast, By Functionality, 2022 – 2035 (USD Million)(Kilo Tons)
- 6.1 Key trends
- 6.2 Sodium Replacement
- 6.3 Flavor Enhancement
- 6.4 Bitterness & Off-Note Masking
- 6.5 Texture & Preservation Enhancement
- 6.6 Others
Chapter 7 Market Estimates and Forecast, By Form, 2022 – 2035 (USD Million)(Kilo Tons)
- 7.1 Key trends
- 7.2 Powder
- 7.3 Liquid
- 7.4 Granular
Chapter 8 Market Estimates and Forecast, By Application, 2022 – 2035 (USD Million)(Kilo Tons)
- 8.1 Key trends
- 8.2 Bakery & Confectionery
- 8.2.1 Bread & Rolls
- 8.2.2 Biscuits, Crackers & Savory Snack Bakery
- 8.2.3 Cakes, Pastries & Sweet Confectionery
- 8.3 Meat, Poultry & Seafood Processing
- 8.3.1 Fresh & Processed Meat Products
- 8.3.2 Poultry Products
- 8.3.3 Seafood & Fish Derivatives
- 8.4 Dairy & Frozen Foods
- 8.4.1 Cheese & Cheese Analogs
- 8.4.2 Butter & Dairy Spreads
- 8.4.3 Frozen Meals & Ready-to-Eat Dairy Products
- 8.5 Sauces, Seasonings & Dressings
- 8.5.1 Table Sauces & Condiments
- 8.5.2 Dry Seasoning Blends & Rubs
- 8.5.3 Salad Dressings & Marinades
- 8.6 Snacks & Savory
- 8.6.1 Extruded Snacks
- 8.6.2 Potato Chips & Crisps
- 8.6.3 Nuts & Seeds Seasoning Applications
- 8.7 Beverages
- 8.7.1 Sports & Functional Beverages
- 8.7.2 Plant-Based & Fortified Drinks
- 8.8 Soups & Ready Meals
- 8.8.1 Canned & Ambient Soups
- 8.8.2 Ready Meals & Meal Kits
- 8.9 Others
Chapter 9 Market Estimates and Forecast, By End-User, 2022 – 2035 (USD Million)(Kilo Tons)
- 9.1 Key trends
- 9.2 Food Manufacturers
- 9.2.1 Large-Scale Industrial Food Processors
- 9.2.2 Small & Medium Food Enterprises (SMEs)
- 9.3 Foodservice Operators
- 9.3.1 Quick Service Restaurants (QSR) & Fast Casual
- 9.3.2 Full-Service Restaurants, Hotels & Catering
- 9.4 Retail / Private Label
- 9.5 Others
Chapter 10 Market Estimates and Forecast, By Region, 2022 – 2035 (USD Million) (Kilo Tons)
- 10.1 Key trends
- 10.2 North America
- 10.2.1 U.S.
- 10.2.2 Canada
- 10.3 Europe
- 10.3.1 Germany
- 10.3.2 UK
- 10.3.3 France
- 10.3.4 Spain
- 10.3.5 Italy
- 10.3.6 Rest of Europe
- 10.4 Asia Pacific
- 10.4.1 China
- 10.4.2 India
- 10.4.3 Japan
- 10.4.4 Australia
- 10.4.5 South Korea
- 10.4.6 Rest of Asia Pacific
- 10.5 Latin America
- 10.5.1 Brazil
- 10.5.2 Mexico
- 10.5.3 Argentina
- 10.5.4 Rest of Latin America
- 10.6 Middle East and Africa
- 10.6.1 Saudi Arabia
- 10.6.2 South Africa
- 10.6.3 UAE
- 10.6.4 Rest of Middle East and Africa
Chapter 11 Company Profiles
- 11.1 Cargill, Incorporated
- 11.2 Kerry Group plc
- 11.3 DSM Firmenich
- 11.4 Tate & Lyle PLC
- 11.5 Givaudan SA
- 11.6 Ajinomoto Co., Inc.
- 11.7 Archer Daniels Midland (ADM)
- 11.8 Jungbunzlauer Suisse AG
- 11.9 Angel Yeast Co., Ltd.
- 11.10 Corbion N.V.
- 11.11 Biospringer (Lesaffre Group)
- 11.12 Innophos Holdings, Inc.

