PUBLISHER: Global Market Insights Inc. | PRODUCT CODE: 2101691

PUBLISHER: Global Market Insights Inc. | PRODUCT CODE: 2101691
DNA Barcoding for Seafood and Meat Authentication Market Opportunity, Growth Drivers, Industry Trend Analysis, and Forecast 2026 - 2035
The Global DNA Barcoding for Seafood & Meat Authentication Market was valued at USD 830 million in 2025 and is estimated to grow at a CAGR of 9.3% to reach USD 2.03 billion by 2035.
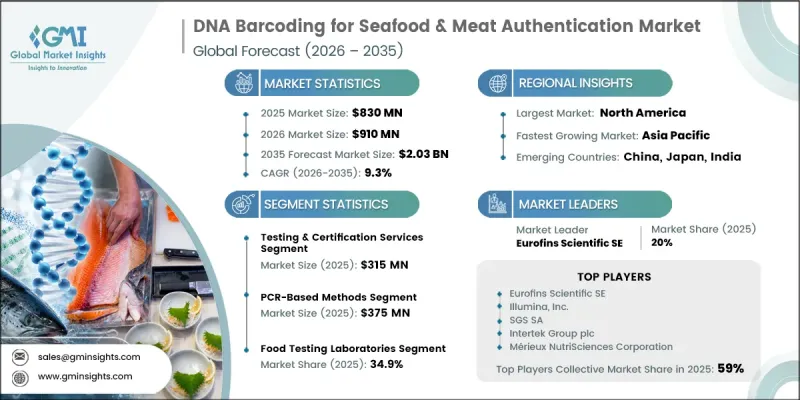
The DNA barcoding for seafood & meat authentication market continues to expand steadily as food manufacturers, regulatory authorities, and supply chain participants place greater emphasis on product authenticity, traceability, and food safety. Increasing complexity in global food supply chains and rising demand for reliable species identification methods are accelerating the adoption of molecular-based authentication technologies. DNA barcoding has evolved into a well-established solution that supports quality assurance programs by delivering accurate and scientifically validated identification results. The market has progressed beyond early adoption and is now an integral component of food authentication processes across commercial and regulatory applications. Demand continues to increase for laboratory testing, certification services, and advanced data management solutions that improve testing accuracy and operational efficiency. At the same time, digital laboratory systems, curated reference databases, and advanced analytical technologies are enhancing the scalability and reliability of authentication workflows. Growing regulatory oversight, stronger quality standards, and increasing focus on consumer confidence are expected to further support market expansion, positioning DNA barcoding as a critical technology for ensuring transparency and integrity throughout the global seafood and meat supply chain.
| Market Scope | |
|---|---|
| Start Year | 2025 |
| Forecast Year | 2026-2035 |
| Start Value | $830 Million |
| Forecast Value | $2.03 Billion |
| CAGR | 9.3% |
The testing and certification services segment held 38% share, generating USD 315 million, and is projected to grow at a CAGR of 8.3% through 2035. This segment continues to lead the market because accredited testing services remain essential for validating product authenticity and supporting regulatory compliance. Growing demand for independent verification services, increasing testing frequency, and broader implementation of authentication throughout quality management processes are strengthening segment growth. Rising investment in laboratory capabilities and continuous improvements in testing efficiency are expected to sustain long-term demand for testing and certification services.
The food testing laboratories segment accounted for 34.9% share in 2025 owing to its central role in providing independent testing and regulatory compliance services. Ongoing demand from food manufacturers, supply chain participants, and quality assurance programs continues to support laboratory expansion and investment in advanced molecular testing technologies. Increasing emphasis on validated testing procedures and reliable species identification is expected to further strengthen demand throughout the forecast period.
North America DNA Barcoding for Seafood & Meat Authentication Market held 34.9% share in 2025 supported by strong food safety standards, increasing demand for product traceability, and widespread adoption of advanced laboratory testing technologies. Continuous investment in accredited testing infrastructure, quality assurance programs, and authentication services is driving market expansion. Growing focus on transparency across food supply chains and increasing adoption of molecular identification technologies are expected to sustain regional growth over the coming years.
Major companies operating in the Global DNA barcoding for seafood & meat authentication market include Eurofins Scientific SE, Illumina, Inc., SGS SA, Intertek Group plc, Merieux NutriSciences Corporation, Oxford Nanopore Technologies plc, Neogen Corporation, AllGenetics & Biology SL, CD Genomics, Bureau Veritas SA, 1st BASE / Apical Scientific Sdn. Bhd., Genetic ID / FoodChain ID, Bento Bioworks Ltd, BIOSERVE Biotechnologies (USA) Ltd, Oritain Global Ltd, and Genetika Science (PT Genetika Science Indonesia). Companies operating in the DNA barcoding for seafood & meat authentication market are strengthening their position through continuous investment in molecular testing technologies, laboratory expansion, and digital innovation. Market participants are enhancing analytical capabilities by improving testing accuracy, expanding reference databases, and integrating advanced laboratory information management systems that streamline authentication workflows. Businesses are also broadening their service portfolios to provide comprehensive testing, certification, and regulatory support for food manufacturers and supply chain partners. Strategic collaborations, geographic expansion, and investment in research and development remain important approaches for strengthening competitive advantage.
Table of Contents
Chapter 1 Methodology & Scope
- 1.1 Research approach
- 1.2 Quality Commitments
- 1.2.1 GMI AI policy & data integrity commitment
- 1.2.1.1 Source consistency protocol
- 1.2.1 GMI AI policy & data integrity commitment
- 1.3 Research Trail & Confidence Scoring
- 1.3.1 Research Trail Components
- 1.3.2 Scoring Components
- 1.4 Data Collection
- 1.4.1 Partial list of primary sources
- 1.5 Data mining sources
- 1.5.1 Paid sources
- 1.5.1.1 Sources, by region
- 1.5.1 Paid sources
- 1.6 Base estimates and calculations
- 1.6.1 Base year calculation for any one approach
- 1.7 Forecast model
- 1.7.1 Quantified market impact analysis
- 1.7.1.1 Mathematical impact of growth parameters on forecast
- 1.7.1 Quantified market impact analysis
- 1.8 Research transparency addendum
- 1.8.1 Source attribution framework
- 1.8.2 Quality assurance metrics
- 1.8.3 Our commitment to trust
Chapter 2 Executive Summary
- 2.1 Industry 360° synopsis
- 2.2 Key market trends
- 2.2.1 Regional
- 2.2.2 Offering Type
- 2.2.3 Technology Platform
- 2.2.4 Food Matrix
- 2.2.5 End-User
Chapter 3 Industry Insights
- 3.1 Industry ecosystem analysis
- 3.1.1 Supplier landscape
- 3.1.2 Profit margin
- 3.1.3 Value addition at each stage
- 3.1.4 Factor affecting the value chain
- 3.1.5 Disruptions
- 3.2 Industry impact forces
- 3.2.1 Growth drivers
- 3.2.2 Industry pitfalls and challenges
- 3.2.3 Market opportunities
- 3.3 Growth potential analysis
- 3.4 Regulatory landscape
- 3.4.1 North America
- 3.4.2 Europe
- 3.4.3 Asia Pacific
- 3.4.4 Latin America
- 3.4.5 Middle East & Africa
- 3.5 Porter's analysis
- 3.6 PESTEL analysis
- 3.7 Price trends
- 3.7.1 By region
- 3.7.2 By feedstock type
- 3.8 Future market trends
- 3.9 Technology and innovation landscape
- 3.9.1 Current technological trends
- 3.9.2 Emerging technologies
- 3.10 Patent Landscape
- 3.11 Trade statistics (HS code)
- 3.11.1 Major importing countries
- 3.11.2 Major exporting countries
- 3.12 Sustainability and environmental aspects
- 3.12.1 Sustainable practices
- 3.12.2 Waste reduction strategies
- 3.12.3 Energy efficiency in production
- 3.12.4 Eco-friendly initiatives
- 3.13 Carbon footprint consideration
Chapter 4 Competitive Landscape, 2025
- 4.1 Introduction
- 4.2 Company market share analysis
- 4.2.1 By region
- 4.2.1.1 North America
- 4.2.1.2 Europe
- 4.2.1.3 Asia Pacific
- 4.2.1.4 LATAM
- 4.2.1.5 MEA
- 4.2.1 By region
- 4.3 Competitive analysis of major market players
- 4.4 Competitive positioning matrix
- 4.5 Key developments
- 4.5.1 Mergers & acquisitions
- 4.5.2 Partnerships & collaborations
- 4.5.3 New Product Launches
- 4.5.4 Expansion Plans
Chapter 5 Market Estimates and Forecast, By Offering Type, 2022-2035 (USD Million) (Kilo Tons)
- 5.1 Key trends
- 5.2 Testing & Certification Services
- 5.2.1 Seafood Species Authentication Services
- 5.2.2 Meat & Meat Product Authentication Services
- 5.2.3 Halal/Kosher Compliance Testing Services
- 5.2.4 Geographic Origin Verification Services
- 5.3 Kits & Reagents
- 5.3.1 DNA Extraction Kits
- 5.3.2 PCR Reagent Kits & Primer Sets
- 5.3.3 NGS Library Preparation Kits
- 5.3.4 Reference DNA Panels & Standards
- 5.4 Instruments & Equipment
- 5.4.1 PCR Thermal Cyclers & qPCR Systems
- 5.4.2 Next-Generation Sequencers
- 5.4.3 DNA Microarray Scanners
- 5.4.4 Portable & Point-of-Care Sequencing Devices
- 5.5 Software & Databases
- 5.5.1 Species Identification & Sequence Analysis Software
- 5.5.2 Reference Database Subscriptions (BOLD, GenBank-Integrated, Proprietary)
- 5.5.3 LIMS & Workflow Management Platforms
- 5.5.4 AI-Powered Authentication Decision Support Tools
Chapter 6 Market Estimates and Forecast, By Technology Platform, 2022-2035 (USD Million) (Kilo Tons)
- 6.1 Key trends
- 6.2 PCR-Based Methods
- 6.2.1 Conventional & Multiplex PCR
- 6.2.2 Quantitative Real-Time PCR (qPCR)
- 6.2.3 Digital PCR (dPCR)
- 6.3 Next-Generation Sequencing (NGS)
- 6.3.1 Amplicon Sequencing
- 6.3.2 Metabarcoding (Multi-Marker, Multi-Species)
- 6.3.3 Shotgun Sequencing
- 6.4 DNA Microarrays
- 6.4.1 Hybridization-Based Species Detection Arrays
- 6.4.2 High-Throughput Screening Arrays for Standardized Target Panels
- 6.5 Other Emerging Technologies
- 6.5.1 Isothermal Amplification (LAMP & NASBA)
- 6.5.2 Sanger Sequencing (Single-Locus Reference Method)
- 6.5.3 MALDI-TOF Mass Spectrometry
- 6.5.4 Portable Biosensor & Nanopore Platforms
Chapter 7 Market Estimates and Forecast, By Food Matrix, 2022-2035 (USD Million) (Kilo Tons)
- 7.1 Key trends
- 7.2 Seafood
- 7.2.1 Finfish
- 7.2.1.1 Pelagic Species (Tuna, Swordfish, Mackerel)
- 7.2.1.2 Demersal Species (Cod, Haddock, Snapper, Grouper)
- 7.2.1.3 Salmonids (Salmon, Trout)
- 7.2.1.4 Freshwater Fish (Tilapia, Carp, Catfish)
- 7.2.2 Shellfish
- 7.2.2.1 Crustaceans (Shrimp, Lobster, Crab)
- 7.2.2.2 Mollusks (Oysters, Mussels, Scallops, Squid)
- 7.2.3 Processed Seafood Products
- 7.2.3.1 Canned & Smoked Fish
- 7.2.3.2 Surimi & Analog Products
- 7.2.3.3 Breaded & Battered Seafood
- 7.2.1 Finfish
- 7.3 Meat & Meat Products
- 7.3.1 Red Meat
- 7.3.1.1 Bovine (Beef & Veal)
- 7.3.1.2 Porcine (Pork)
- 7.3.1.3 Ovine & Caprine (Lamb, Mutton, Goat)
- 7.3.2 Poultry
- 7.3.2.1 Chicken
- 7.3.2.2 Turkey & Other Avian Species
- 7.3.3 Exotic & Game Meat
- 7.3.3.1 Venison, Bison & Wild Ungulates
- 7.3.3.2 Kangaroo, Ostrich & Non-Conventional Species
- 7.3.4 Processed Meat Products
- 7.3.4.1 Sausages, Deli Meats & Cured Products
- 7.3.4.2 Burgers, Meatballs & Mixed-Species Formulations
- 7.3.4.3 Pates, Spreads & Ready Meals
- 7.3.1 Red Meat
Chapter 8 Market Estimates and Forecast, By End-User, 2022-2035 (USD Million) (Kilo Tons)
- 8.1 Key trends
- 8.2 Food Testing Laboratories
- 8.2.1 Commercial Contract Testing Laboratories (CROs)
- 8.2.2 Accredited Third-Party Reference Laboratories
- 8.3 Food Manufacturers & Processors
- 8.3.1 Seafood Processors & Aquaculture Companies
- 8.3.2 Meat Packers & Slaughterhouse Operators
- 8.3.3 Food Ingredient Suppliers & Distributors
- 8.4 Regulatory & Government Agencies
- 8.4.1 National Food Safety Authorities (FDA, EFSA, FSSAI, AQSIQ)
- 8.4.2 Customs & Border Inspection Agencies
- 8.4.3 Fisheries Enforcement & IUU Investigation Units
- 8.5 Retailers & Foodservice Operators
- 8.5.1 Supermarket & Grocery Chains - Private Label Verification
- 8.5.2 Foodservice & Restaurant Groups
- 8.5.3 E-Commerce Food Platforms
- 8.6 Research & Academic Institutions
- 8.6.1 University & Government Research Laboratories
- 8.6.2 Biodiversity & Fisheries Conservation Institutes
- 8.6.3 Reference Database Development Organizations (BOLD, GenBank Curators)
Chapter 9 Market Estimates and Forecast, By Region, 2022-2035 (USD Million) (Kilo Tons)
- 9.1 Key trends
- 9.2 North America
- 9.2.1 U.S.
- 9.2.2 Canada
- 9.3 Europe
- 9.3.1 Germany
- 9.3.2 UK
- 9.3.3 France
- 9.3.4 Spain
- 9.3.5 Italy
- 9.3.6 Rest of Europe
- 9.4 Asia Pacific
- 9.4.1 China
- 9.4.2 India
- 9.4.3 Japan
- 9.4.4 Australia
- 9.4.5 South Korea
- 9.4.6 Rest of Asia Pacific
- 9.5 Latin America
- 9.5.1 Brazil
- 9.5.2 Mexico
- 9.5.3 Argentina
- 9.5.4 Rest of Latin America
- 9.6 Middle East and Africa
- 9.6.1 Saudi Arabia
- 9.6.2 South Africa
- 9.6.3 UAE
- 9.6.4 Rest of Middle East and Africa
Chapter 10 Company Profiles
- 10.1 Eurofins Scientific SE
- 10.2 Illumina, Inc.
- 10.3 SGS SA
- 10.4 Intertek Group plc
- 10.5 Merieux NutriSciences Corporation
- 10.6 Oxford Nanopore Technologies plc
- 10.7 Neogen Corporation
- 10.8 AllGenetics & Biology SL
- 10.9 CD Genomics
- 10.10 Bureau Veritas SA
- 10.11 Apical Scientific Sdn. Bhd.
- 10.12 Genetic ID / FoodChain ID
- 10.13 Bento Bioworks Ltd
- 10.14 BIOSERVE Biotechnologies (USA) Ltd
- 10.15 Oritain Global Ltd
- 10.16 Genetika Science (PT Genetika Science Indonesia)

