PUBLISHER: Global Market Insights Inc. | PRODUCT CODE: 2101983

PUBLISHER: Global Market Insights Inc. | PRODUCT CODE: 2101983
Power GaN Devices Market Opportunity, Growth Drivers, Industry Trend Analysis, and Forecast 2026 - 2035
The Global Power GaN Devices Market was valued at USD 520.5 million in 2025 and is estimated to grow at a CAGR of 27.9% to reach USD 6.5 billion by 2035.
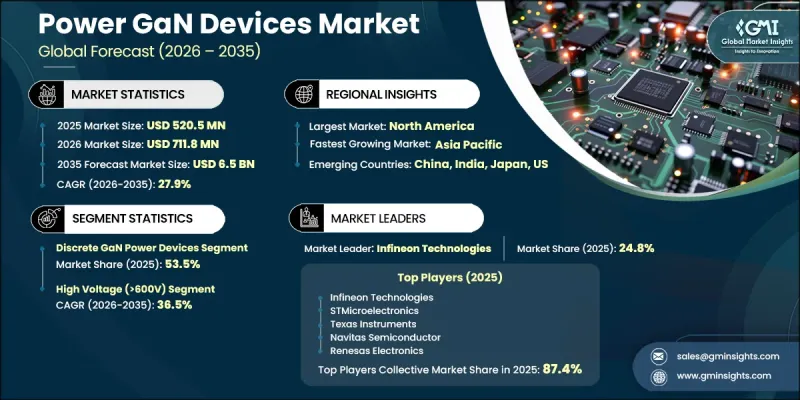
The market growth is driven by the superior performance characteristics of GaN compared to silicon, including higher electron mobility, reduced on-resistance at equivalent die sizes, and improved high-frequency switching capability. These advantages translate into measurable system-level benefits such as higher power density, improved energy efficiency, and reduced component size, enabling next-generation compact and high-performance power systems. GaN-based devices are increasingly enabling more efficient onboard chargers and smaller DC-DC conversion systems, supporting the automotive industry's shift toward lighter and more integrated electrical architectures. In consumer electronics, the growing demand for ultra-compact, high-wattage charging solutions is further accelerating adoption. As silicon-based solutions struggle to meet combined requirements for thermal efficiency, power density, and compact design, GaN devices are becoming a preferred alternative across multiple industries. Expanding use in data centers, renewable energy systems, and industrial power electronics is reinforcing long-term demand and accelerating technology substitution across the global power semiconductor landscape.
| Market Scope | |
|---|---|
| Start Year | 2025 |
| Forecast Year | 2026-2035 |
| Start Value | $520.5 Million |
| Forecast Value | $6.5 Billion |
| CAGR | 27.9% |
The discrete GaN power devices segment accounted for 53.5% share in 2025, highlighting its dominant position across multiple application areas. This segment continues to lead due to its widespread use in consumer charging devices, low to medium power industrial systems, and early-stage electric vehicle power applications. Discrete GaN components offer engineers greater flexibility in circuit design, enabling optimization of switching performance, thermal behavior, and power efficiency at the board level. Their adaptability and ease of integration make them a preferred choice for companies transitioning from traditional silicon-based designs to GaN-enabled architectures.
The low-voltage (200V) and medium-voltage (200V-600V) segment held 40% share in 2025 generating USD 200 million. This distribution reflects strong adoption across both consumer electronics charging systems and industrial power supply applications. Low-voltage GaN devices are widely used in compact charging systems and portable electronics, while medium-voltage devices are increasingly applied in power conversion, motor drives, and automotive systems. Demand across both categories continues to grow as manufacturers prioritize higher efficiency, reduced energy loss, and compact system design in next-generation power electronics.
North America Power GaN Devices Market was valued at USD 179.4 million in 2025 and is projected to grow at a CAGR of 25.5% through 2035. The region's growth is supported by strong semiconductor innovation capabilities, rising investments in electrification infrastructure, and increasing adoption of advanced power electronics across automotive and industrial sectors. Expanding manufacturing capacity for compound semiconductor technologies and continued investment in next-generation power device development are further strengthening regional market growth and accelerating adoption across end-use industries.
Key companies operating in the Global Power GaN Devices Market include Navitas Semiconductor Corporation, Infineon Technologies AG, Efficient Power Conversion Corporation (EPC), STMicroelectronics N.V., Power Integrations, Inc., ROHM Co., Ltd., Texas Instruments Incorporated, Mitsubishi Electric Corporation, Renesas Electronics Corporation (including Transphorm), Innoscience Technology Co., Ltd., Panasonic Holdings Corporation, Cambridge GaN Devices (CGD), VisIC Technologies, NexGen Power Systems, and Odyssey Semiconductor Technologies. Companies operating in the power GaN devices market are strengthening their market position by focusing on device efficiency improvements, scaling production capabilities, and advancing GaN integration across diverse end-use applications. Manufacturers are investing heavily in research and development to enhance switching performance, thermal stability, and voltage handling capacity while reducing manufacturing costs. Strategic collaborations with automotive, consumer electronics, and industrial system manufacturers are enabling faster commercialization and broader adoption of GaN-based solutions. Firms are also expanding fabrication capacity and improving supply chain resilience to meet rising global demand.
Table of Contents
Chapter 1 Methodology & Scope
- 1.1 Research approach
- 1.2 Quality commitments
- 1.2.1 GMI AI policy & data integrity commitment
- 1.2.1.1 Source consistency protocol
- 1.2.1 GMI AI policy & data integrity commitment
- 1.3 Research trail & confidence scoring
- 1.3.1 Research trail components
- 1.3.2 Scoring components
- 1.4 Data collection
- 1.4.1 Partial list of primary sources
- 1.5 Data mining sources
- 1.5.1 Paid sources
- 1.5.1.1 Sources, by region
- 1.5.1 Paid sources
- 1.6 Base estimates and calculations
- 1.6.1 Base year calculation for any one approach
- 1.7 Market estimates & forecasts parameters
- 1.8 Forecast model
- 1.8.1 Quantified market impact analysis
- 1.8.1.1 Mathematical impact of growth parameters on forecast
- 1.8.1 Quantified market impact analysis
- 1.9 Research transparency addendum
- 1.9.1 Source attribution framework
- 1.9.2 Quality assurance metrics
- 1.9.3 Our commitment to trust
- 1.10 Market definitions
Chapter 2 Executive Summary
- 2.1 Industry synopsis, 2022 - 2035
- 2.1.1 Device Type trends
- 2.1.2 Operation Mode trends
- 2.1.3 Substrate Technology trends
- 2.1.4 Voltage Range trends
- 2.1.5 Application trends
- 2.1.6 Regional trends
Chapter 3 Industry Insights
- 3.1 Industry ecosystem analysis
- 3.2 Industry impact forces
- 3.2.1 Growth drivers
- 3.2.1.1 Rising Adoption of Electric Vehicles (EVs)
- 3.2.1.2 Increasing Demand for Fast-Charging Consumer Electronics
- 3.2.1.3 Expansion of Renewable Energy Systems
- 3.2.1.4 Growing Need for Energy-Efficient Power Electronics
- 3.2.2 Industry pitfalls and challenges
- 3.2.2.1 High Manufacturing and Production Costs
- 3.2.2.2 Supply Chain and Raw Material Constraints
- 3.2.3 Market opportunities
- 3.2.3.1 Expansion in Electric Vehicle Power Electronics
- 3.2.3.2 Growing Penetration in Data Centers and Renewable Energy Applications
- 3.2.1 Growth drivers
- 3.3 Growth potential analysis
- 3.4 Regulatory landscape (Driven by primary research)
- 3.4.1 North America
- 3.4.2 Europe
- 3.4.3 Asia Pacific
- 3.4.4 Latin America
- 3.4.5 MEA
- 3.5 Technology landscape
- 3.5.1 Current technological trends
- 3.5.2 Emerging technologies
- 3.6 Pricing trend analysis (Driven by primary research)
- 3.7 Future market trends
- 3.8 Patent analysis
- 3.9 Porter's analysis
- 3.10 PESTEL analysis
- 3.11 Impact of AI and Generative AI on the market (Driven by primary research)
- 3.12 Value chain analysis (Driven by primary research)
- 3.13 Investment & funding analysis (Driven by primary research)
- 3.14 Consumer insights (Driven by primary research)
Chapter 4 Competitive Landscape, 2025
- 4.1 Introduction
- 4.2 Company market share analysis, by region, 2025
- 4.2.1 North America
- 4.2.2 Europe
- 4.2.3 Asia Pacific
- 4.2.4 Middle East & Africa
- 4.2.5 Latin America
- 4.3 Key developments
- 4.3.1 Key partnerships & collaborations
- 4.3.2 Major M&A activities
- 4.3.3 Product innovations & launches
- 4.3.4 Market expansion strategies
- 4.4 Competitive positioning matrix
Chapter 5 Market Size and Forecast, By Device Type, 2022 - 2035 (USD Million)
- 5.1 Key trends
- 5.2 Discrete GaN Power Devices
- 5.3 Integrated GaN Power ICs
- 5.4 GaN Power Modules
Chapter 6 Market Size and Forecast, By Operation Mode, 2022 - 2035 (USD Million)
- 6.1 Key trends
- 6.2 Enhancement Mode
- 6.3 Depletion Mode (D-mode / Normally-On) & Cascode Configurations
Chapter 7 Market Size and Forecast, By Voltage Range, 2022 - 2035 (USD Million)
- 7.1 Key trends
- 7.2 Low Voltage (<200V)
- 7.3 Mid Voltage (200-650V)
- 7.4 High Voltage (>650V)
Chapter 8 Market Size and Forecast, By Substrate Technology, 2022 - 2035 (USD Million)
- 8.1 Key trends
- 8.2 GaN-on-Silicon (GaN-on-Si)
- 8.3 GaN-on-Silicon Carbide (GaN-on-SiC)
- 8.4 Native GaN (GaN-on-GaN)
- 8.5 Others
Chapter 9 Market Size and Forecast, By Application, 2022 - 2035 (USD Million)
- 9.1 Power Supplies, Adapters & Fast Chargers
- 9.2 DC/DC Converters
- 9.3 Inverters
- 9.4 Motor Drives
- 9.5 Wireless Power Transfer (WPT)
- 9.6 LiDAR & ToF Systems
- 9.7 Others
Chapter 10 Market Size and Forecast, By End-Use Industry, 2022 - 2035 (USD Million)
- 10.1 Consumer Electronics
- 10.2 Automotive & Electric Vehicles
- 10.3 Data Centers & Telecom InfrastructureData Centers & Telecom Infrastructure
- 10.4 Industrial Automation
- 10.5 Aerospace & Defense
- 10.6 Healthcare & MedTech
Chapter 11 Market Size and Forecast, By Region, 2022 - 2035 (USD Million)
- 11.1 Key trends
- 11.2 North America
- 11.2.1 U.S.
- 11.2.2 Canada
- 11.3 Europe
- 11.3.1 Germany
- 11.3.2 France
- 11.3.3 UK
- 11.3.4 Netherlands
- 11.3.5 Spain
- 11.3.6 Italy
- 11.4 Asia Pacific
- 11.4.1 China
- 11.4.2 Japan
- 11.4.3 South Korea
- 11.4.4 India
- 11.4.5 Australia
- 11.5 Middle East & Africa
- 11.5.1 Saudi Arabia
- 11.5.2 UAE
- 11.5.3 South Africa
- 11.6 Latin America
- 11.6.1 Brazil
- 11.6.2 Argentina
- 11.6.3 Mexico
Chapter 12 Company Profiles
- 12.1 Infineon Technologies AG
- 12.2 Navitas Semiconductor Corporation
- 12.3 Efficient Power Conversion Corporation (EPC)
- 12.4 Power Integrations, Inc.
- 12.5 STMicroelectronics N.V.
- 12.6 Texas Instruments Incorporated
- 12.7 Renesas Electronics Corporation (incl. Transphorm)
- 12.8 Innoscience Technology Co., Ltd.
- 12.9 ROHM Co., Ltd.
- 12.10 Mitsubishi Electric Corporation
- 12.11 Panasonic Holdings Corporation
- 12.12 Cambridge GaN Devices (CGD)
- 12.13 NexGen Power Systems
- 12.14 VisIC Technologies
- 12.15 Odyssey Semiconductor Technologies

