PUBLISHER: Global Market Insights Inc. | PRODUCT CODE: 2109212

PUBLISHER: Global Market Insights Inc. | PRODUCT CODE: 2109212
High-Purity Silicon Metal and Polysilicon Market Opportunity, Growth Drivers, Industry Trend Analysis, and Forecast 2026 - 2035
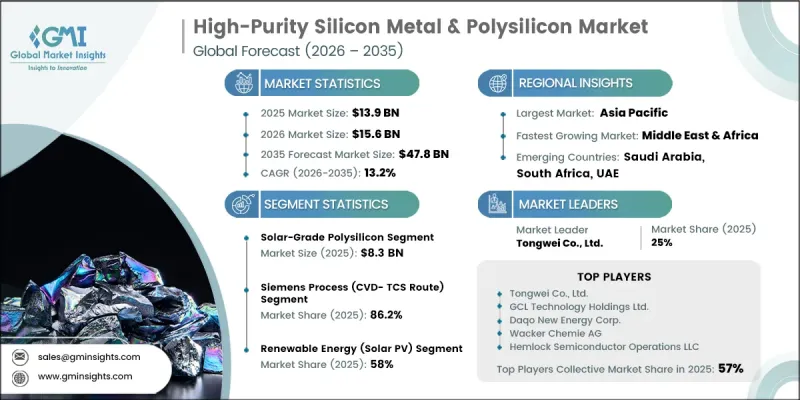
The Global High-Purity Silicon Metal & Polysilicon Market was valued at USD 13.9 billion in 2025 and is estimated to grow at a CAGR of 13.2% to reach USD 47.8 billion by 2035.
The industry is evolving beyond a phase centered primarily on production capacity and is increasingly emphasizing product quality, technological advancement, and resilient supply chains. Growing demand for high-performance silicon materials, coupled with continuous investments in advanced manufacturing technologies, is supporting market expansion across multiple end-use industries. Manufacturers are prioritizing the production of ultra-high-purity materials that meet stringent quality standards while improving manufacturing efficiency and process reliability. Increasing focus on localized production capabilities, supply chain diversification, and innovation in purification technologies is further strengthening the industry's outlook. In addition, expanding investments in next-generation energy technologies, semiconductor manufacturing, and advanced electronic applications are creating favorable growth opportunities.
| Market Scope | |
|---|---|
| Start Year | 2025 |
| Forecast Year | 2026-2035 |
| Start Value | $13.9 Billion |
| Forecast Value | $47.8 Billion |
| CAGR | 13.2% |
The solar-grade polysilicon segment held a 59.8% share in 2025 and is forecast to grow at a 12.3% CAGR through 2035. The segment continues to maintain its dominant position because solar-grade polysilicon serves as a critical raw material for photovoltaic manufacturing and supports the production of high-efficiency solar technologies. Increasing investments in renewable energy infrastructure, continuous advancements in photovoltaic manufacturing processes, and growing demand for high-quality silicon materials are strengthening segment growth. Manufacturers are also focusing on improving material purity, production efficiency, and manufacturing consistency, which is expected to further support long-term demand for solar-grade polysilicon across the global market.
The renewable energy (solar PV) segment recorded 58% share in 2025. The segment continues to benefit from increasing investments in clean energy infrastructure, rising deployment of photovoltaic systems, and the growing need for reliable, high-performance silicon materials. Continued improvements in solar cell efficiency, increasing production of advanced photovoltaic modules, and rising demand for sustainable electricity generation are further contributing to market expansion. In addition, the growing emphasis on energy transition, expanding renewable energy capacity, and ongoing technological advancements in solar manufacturing are expected to sustain the segment's leadership throughout the forecast period.
North America High-Purity Silicon Metal & polysilicon Market captured a 9.2% share in 2025. The region is becoming an increasingly important market due to rising investments in semiconductor manufacturing, expanding domestic production capabilities, and growing efforts to strengthen localized supply chains. Increasing demand for high-quality silicon materials that comply with stringent manufacturing and regulatory standards is supporting regional market growth. In addition, ongoing investments in advanced manufacturing facilities, technology innovation, and strategic supply chain development are expected to create favorable opportunities for manufacturers while reinforcing North America's position in the global market over the forecast period.
Major companies operating in the global high-purity silicon metal & polysilicon market include Tongwei Co., Ltd., GCL Technology Holdings Ltd., Daqo New Energy Corp., Wacker Chemie AG, Hemlock Semiconductor Operations LLC, Xinte Energy Co., Ltd., OCI Company Ltd., REC Silicon ASA, Tokuyama Corporation, Asia Silicon (Qinghai) Co., Ltd., TBEA Co., Ltd., High-Purity Silicon America Corp. (Mitsubishi Materials), Qatar Solar Technologies, Xinjiang East Hope New Energy Co., Ltd., Shin-Etsu Chemical Co., Ltd., and Siltronic AG. Companies operating in the global high-purity silicon metal & polysilicon market are reinforcing their competitive position by investing extensively in production capacity expansion, advanced purification technologies, and continuous product innovation. Leading manufacturers are prioritizing research and development to improve material purity, manufacturing efficiency, and process reliability while meeting increasingly demanding quality standards. Strategic partnerships, long-term supply agreements, and investments in localized manufacturing facilities are enabling companies to strengthen supply chain resilience and expand their global customer base. Businesses are also focusing on sustainability initiatives, energy-efficient production processes, and operational optimization to enhance competitiveness. Furthermore, companies are expanding their geographic presence, modernizing manufacturing facilities, increasing production capabilities, and developing premium-grade silicon materials to strengthen their market foothold, improve customer satisfaction, and capitalize on the growing demand across the global high-purity silicon metal & polysilicon market.
Table of Contents
Chapter 1 Methodology & Scope
- 1.1 Research approach
- 1.2 Quality Commitments
- 1.2.1 GMI AI policy & data integrity commitment
- 1.2.1.1 Source consistency protocol
- 1.2.1 GMI AI policy & data integrity commitment
- 1.3 Research Trail & Confidence Scoring
- 1.3.1 Research Trail Components
- 1.3.2 Scoring Components
- 1.4 Data Collection
- 1.4.1 Partial list of primary sources
- 1.5 Data mining sources
- 1.5.1 Paid sources
- 1.5.1.1 Sources, by region
- 1.5.1 Paid sources
- 1.6 Base estimates and calculations
- 1.6.1 Base year calculation for any one approach
- 1.7 Forecast model
- 1.7.1 Quantified market impact analysis
- 1.7.1.1 Mathematical impact of growth parameters on forecast
- 1.7.1 Quantified market impact analysis
- 1.8 Research transparency addendum
- 1.8.1 Source attribution framework
- 1.8.2 Quality assurance metrics
- 1.8.3 Our commitment to trust
Chapter 2 Executive Summary
- 2.1 Industry 360° synopsis
- 2.2 Key market trends
- 2.2.1 Regional
- 2.2.2 Product Type
- 2.2.3 Purity Grade
- 2.2.4 Manufacturing Process
- 2.2.5 Application
- 2.2.6 End-User Industry
Chapter 3 Industry Insights
- 3.1 Industry ecosystem analysis
- 3.1.1 Supplier landscape
- 3.1.2 Profit margin
- 3.1.3 Value addition at each stage
- 3.1.4 Factor affecting the value chain
- 3.1.5 Disruptions
- 3.2 Industry impact forces
- 3.2.1 Growth drivers
- 3.2.2 Industry pitfalls and challenges
- 3.2.3 Market opportunities
- 3.3 Growth potential analysis
- 3.4 Regulatory landscape
- 3.4.1 North America
- 3.4.2 Europe
- 3.4.3 Asia Pacific
- 3.4.4 Latin America
- 3.4.5 Middle East & Africa
- 3.5 Porter’s analysis
- 3.6 PESTEL analysis
- 3.7 Price trends
- 3.7.1 By region
- 3.7.2 By feedstock type
- 3.8 Future market trends
- 3.9 Technology and innovation landscape
- 3.9.1 Current technological trends
- 3.9.2 Emerging technologies
- 3.10 Patent Landscape
- 3.11 Trade statistics (HS code)
- 3.11.1 Major importing countries
- 3.11.2 Major exporting countries
- 3.12 Sustainability and environmental aspects
- 3.12.1 Sustainable practices
- 3.12.2 Waste reduction strategies
- 3.12.3 Energy efficiency in production
- 3.12.4 Eco-friendly initiatives
- 3.13 Carbon footprint consideration
Chapter 4 Competitive Landscape, 2025
- 4.1 Introduction
- 4.2 Company market share analysis
- 4.2.1 By region
- 4.2.1.1 North America
- 4.2.1.2 Europe
- 4.2.1.3 Asia Pacific
- 4.2.1.4 LATAM
- 4.2.1.5 MEA
- 4.2.1 By region
- 4.3 Competitive analysis of major market players
- 4.4 Competitive positioning matrix
- 4.5 Key developments
- 4.5.1 Mergers & acquisitions
- 4.5.2 Partnerships & collaborations
- 4.5.3 New Product Launches
- 4.5.4 Expansion Plans
Chapter 5 Market Estimates and Forecast, By Product Type, 2022–2035 (USD Billion) (Kilo Tons)
- 5.1 Key trends
- 5.2 High-Purity Silicon Metal
- 5.2.1 4N (99.99%) Grade
- 5.2.2 5N (99.999%) Grade
- 5.3 Solar-Grade Polysilicon
- 5.3.1 Standard Solar-Grade (6N)
- 5.3.2 Premium Solar-Grade (7N–9N)
- 5.4 Electronic-Grade Polysilicon
- 5.4.1 Standard Electronic-Grade (9N–10N)
- 5.4.2 Ultra-High-Purity Electronic-Grade (11N & Above)
Chapter 6 Market Estimates and Forecast, By Purity Grade, 2022–2035 (USD Billion) (Kilo Tons)
- 6.1 Key trends
- 6.2 4N (99.99%)
- 6.3 5N (99.999%)
- 6.4 6N (99.9999%)
- 6.5 7N–9N (99.99999%–99.9999999%)
- 6.6 10N–11N & Above (≥99.9999999999%)
Chapter 7 Market Estimates and Forecast, By Manufacturing Process, 2022–2035 (USD Billion) (Kilo Tons)
- 7.1 Key trends
- 7.2 Siemens Process (CVD- TCS Route)
- 7.2.1 Standard Siemens Process
- 7.2.2 Modified/Optimized Siemens Process (Energy-Reduced Variants)
- 7.3 Fluidized Bed Reactor (FBR) Process
- 7.3.1 Silane-Based FBR
- 7.3.2 TCS-Based FBR
- 7.4 Upgraded Metallurgical-Grade (UMG) Process
Chapter 8 Market Estimates and Forecast, By Application, 2022–2035 (USD Billion) (Kilo Tons)
- 8.1 Key trends
- 8.2 Photovoltaics (Solar Cells & Modules)
- 8.2.1 Monocrystalline Silicon Solar Cells
- 8.2.2 Multicrystalline Silicon Solar Cells
- 8.2.3 Thin-Film & Emerging PV (Perovskite Hybrid)
- 8.3 Semiconductor Devices
- 8.3.1 Integrated Circuits (Logic & Memory)
- 8.3.2 Microprocessors & AI Accelerators
- 8.3.3 Discrete Semiconductor Components
- 8.3.4 MEMS Devices
- 8.4 Power Electronics
- 8.4.1 Electric Vehicle Inverters & Onboard Chargers
- 8.4.2 Renewable Energy Inverters & Grid Infrastructure
- 8.4.3 5G Infrastructure & Telecom Power Systems
- 8.5 Silicones & Specialty Chemicals
- 8.5.1 Industrial & Construction Silicones
- 8.5.2 Personal Care & Pharmaceutical Silicones
- 8.6 Quantum Technologies & Advanced R&D
- 8.6.1 Quantum Computing Qubits (Silicon-28 Feedstock)
- 8.6.2 Precision Optics & Infrared Imaging
- 8.7 Others
- 8.7.1 Biocompatible Silicon (Medical Implants & Diagnostics)
- 8.7.2 Advanced Ceramics & Thermal Interface Materials
- 8.7.3 Aerospace & Defense Components
Chapter 9 Market Estimates and Forecast, By End-User Industry, 2022–2035 (USD Billion) (Kilo Tons)
- 9.1 Key trends
- 9.2 Renewable Energy (Solar PV)
- 9.3 Semiconductor & Electronics
- 9.4 Automotive
- 9.5 Chemicals & Materials
- 9.6 Healthcare & Medical Devices
- 9.7 Aerospace & Defense
- 9.8 Others (Telecom, Industrial Automation, Quantum Research)
Chapter 10 Market Estimates and Forecast, By Region, 2022–2035 (USD Billion) (Kilo Tons)
- 10.1 Key trends
- 10.2 North America
- 10.2.1 U.S.
- 10.2.2 Canada
- 10.3 Europe
- 10.3.1 Germany
- 10.3.2 UK
- 10.3.3 France
- 10.3.4 Spain
- 10.3.5 Italy
- 10.3.6 Rest of Europe
- 10.4 Asia Pacific
- 10.4.1 China
- 10.4.2 India
- 10.4.3 Japan
- 10.4.4 Australia
- 10.4.5 South Korea
- 10.4.6 Rest of Asia Pacific
- 10.5 Latin America
- 10.5.1 Brazil
- 10.5.2 Mexico
- 10.5.3 Argentina
- 10.5.4 Rest of Latin America
- 10.6 Middle East and Africa
- 10.6.1 Saudi Arabia
- 10.6.2 South Africa
- 10.6.3 UAE
- 10.6.4 Rest of Middle East and Africa
Chapter 11 Company Profiles
- 11.1 Tongwei Co., Ltd.
- 11.2 GCL Technology Holdings Ltd.
- 11.3 Daqo New Energy Corp.
- 11.4 Wacker Chemie AG
- 11.5 Hemlock Semiconductor Operations LLC
- 11.6 Xinte Energy Co., Ltd.
- 11.7 OCI Company Ltd.
- 11.8 REC Silicon ASA
- 11.9 Tokuyama Corporation
- 11.10 Asia Silicon (Qinghai) Co., Ltd.
- 11.11 TBEA Co., Ltd.
- 11.12 High-Purity Silicon America Corp. (Mitsubishi Materials)
- 11.13 Qatar Solar Technologies
- 11.14 Xinjiang East Hope New Energy Co., Ltd.
- 11.15 Shin-Etsu Chemical Co., Ltd.
- 11.16 Siltronic AG

