
PUBLISHER: Global Market Insights Inc. | PRODUCT CODE: 1876781

PUBLISHER: Global Market Insights Inc. | PRODUCT CODE: 1876781
Dental Implants Market Opportunity, Growth Drivers, Industry Trend Analysis, and Forecast 2025 - 2034
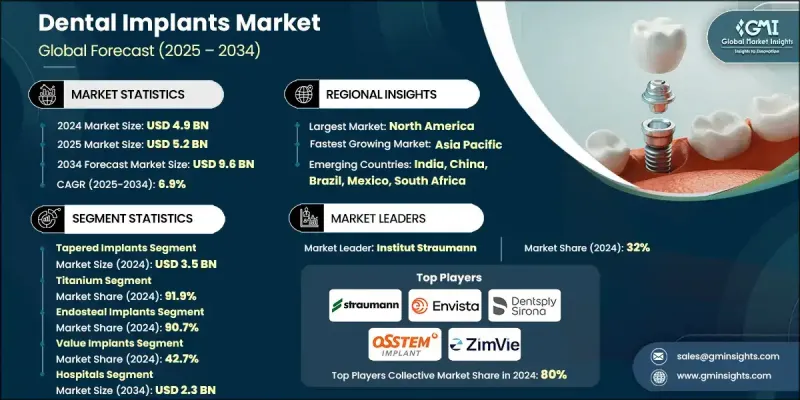
The Global Dental Implants Market was valued at USD 4.9 billion in 2024 and is estimated to grow at a CAGR of 6.9% to reach USD 9.6 billion by 2034.
The rising prevalence of dental disorders worldwide is a major factor driving demand. Factors such as shifting lifestyles, poor oral hygiene, and increased sugar consumption are contributing to tooth decay, gum disease, and oral injuries. Tooth loss is particularly common in older adults, often resulting from years of wear, tear, or chronic conditions like diabetes, which promote bacterial growth in oral fluids. Dental implants are surgically placed in the jawbone to support prosthetics such as crowns, bridges, dentures, or facial prostheses, and can also serve as orthodontic anchors. Recent innovations in implant technologies, including the use of biocompatible materials like titanium alloys and zirconia, are enhancing aesthetics, jawbone integration, and long-term durability, further fueling adoption in dental care.
| Market Scope | |
|---|---|
| Start Year | 2024 |
| Forecast Year | 2025-2034 |
| Start Value | $4.9 Billion |
| Forecast Value | $9.6 Billion |
| CAGR | 6.9% |
The tapered implants generated USD 3.5 billion in 2024 and are projected to grow at a CAGR of 7.3% through 2034. Their conical design provides higher stability in challenging cases such as narrow ridges or low-quality bone, enabling immediate loading of prostheses like crowns or dentures shortly after placement.
The titanium implants segment held 91.9% share in 2024 and is expected to reach USD 8.7 billion by 2034. Titanium forms a protective oxide layer that resists reactions with bodily fluids, ensuring long-term stability and reducing the need for revision surgeries. This durability underpins its widespread adoption across dental applications globally.
U.S. Dental Implants Market is forecasted to reach USD 3.3 billion by 2034, driven by the presence of highly skilled dental professionals specializing in implantology. Technological advancements in implant techniques and enhanced dental education in the country are further supporting market expansion.
Key players in the Global Dental Implants Market include Mega'gen Implant, MIS Implants Technologies, Cortex Dental Implants Industries, Bicon, Dentsply Sirona, Henry Schein, Osstem Implant, AVINENT Implant System, NucleOSS, A.B. Dental Devices, Envista Holdings Corporation, Straumann Holding, Glidewell, Adin Dental Implant Systems, and ZimVie. Companies in the Dental Implants Market are strengthening their positions through multiple strategic approaches. They are investing heavily in R&D to develop advanced implant designs and biocompatible materials that improve success rates and aesthetic outcomes. Expanding distribution networks and establishing partnerships with dental clinics and hospitals help secure consistent market access. Many players are emphasizing digital dentistry solutions, including computer-guided implant placement and CAD/CAM-supported prosthetics.
Table of Contents
Chapter 1 Methodology and Scope
- 1.1 Market scope and definition
- 1.2 Research design
- 1.2.1 Research approach
- 1.2.2 Data collection methods
- 1.3 Data mining sources
- 1.3.1 Global
- 1.3.2 Regional/Country
- 1.4 Base estimates and calculations
- 1.4.1 Base year calculation
- 1.4.2 Key trends for market estimation
- 1.5 Primary research and validation
- 1.5.1 Primary sources
- 1.6 Forecast model
- 1.7 Research assumptions and limitations
Chapter 2 Executive Summary
- 2.1 Industry 360° synopsis
- 2.2 Key market trends
- 2.2.1 Regional trends
- 2.2.2 Product trends
- 2.2.3 Material trends
- 2.2.4 Type trends
- 2.2.5 Price trends
- 2.2.6 End use trends
- 2.3 CXO perspectives: Strategic imperatives
- 2.3.1 Key decision points for industry executives
- 2.3.2 Critical success factors for market players
- 2.4 Future outlook and strategic recommendations
Chapter 3 Industry Insights
- 3.1 Industry ecosystem analysis
- 3.2 Industry impact forces
- 3.2.1 Growth drivers
- 3.2.1.1 Increasing elderly population worldwide
- 3.2.1.2 Growing prevalence of dental disorders across the globe
- 3.2.1.3 Advancements in implant technologies in developed countries
- 3.2.1.4 Rising demand for cosmetic dentistry
- 3.2.2 Industry pitfalls and challenges
- 3.2.2.1 Limited reimbursement policies
- 3.2.2.2 High cost of dental implant treatment
- 3.2.3 Market opportunities
- 3.2.3.1 Shift towards minimally invasive procedures
- 3.2.3.2 Expansion of dental tourism in emerging countries
- 3.2.1 Growth drivers
- 3.3 Growth potential analysis
- 3.4 Regulatory landscape
- 3.4.1 North America
- 3.4.2 Europe
- 3.4.3 Asia Pacific
- 3.4.4 Latin America
- 3.4.5 Middle East and Africa
- 3.5 Technological advancements
- 3.5.1 Current technological trends
- 3.5.2 Emerging technologies
- 3.6 Reimbursement scenario
- 3.7 Pricing analysis, 2024
- 3.8 Future market trends
- 3.9 Porter's analysis
- 3.10 PESTEL analysis
Chapter 4 Competitive Landscape, 2024
- 4.1 Introduction
- 4.2 Company market share analysis
- 4.3 Company matrix analysis
- 4.4 Competitive analysis of major market players
- 4.5 Competitive positioning matrix
- 4.6 Strategy dashboard
- 4.7 Key developments
- 4.7.1 Mergers and acquisitions
- 4.7.2 Partnerships and collaborations
- 4.7.3 New product launches
- 4.7.4 Expansion plans
Chapter 5 Market Estimates and Forecast, By Product, 2021 - 2034 ($ Mn)
- 5.1 Key trends
- 5.2 Tapered implants
- 5.3 Parallel-walled implants
Chapter 6 Market Estimates and Forecast, By Material, 2021 - 2034 ($ Mn)
- 6.1 Key trends
- 6.2 Titanium
- 6.3 Zirconium
Chapter 7 Market Estimates and Forecast, By Type, 2021 - 2034 ($ Mn)
- 7.1 Key trends
- 7.2 Endosteal implants
- 7.3 Subperiosteal implants
- 7.4 Transosteal implants
- 7.5 Intramucosal implants
Chapter 8 Market Estimates and Forecast, By Price, 2021 - 2034 ($ Mn)
- 8.1 Key trends
- 8.2 Premium implants
- 8.3 Value implants
- 8.4 Discounted implants
Chapter 9 Market Estimates and Forecast, By End Use, 2021 - 2034 ($ Mn)
- 9.1 Key trends
- 9.2 Hospitals
- 9.3 Dental clinics
- 9.4 Dental service organization
- 9.5 Other end use
Chapter 10 Market Estimates and Forecast, By Region, 2021 - 2034 ($ Mn)
- 10.1 Key trends
- 10.2 North America
- 10.2.1 U.S.
- 10.2.2 Canada
- 10.3 Europe
- 10.3.1 Germany
- 10.3.2 UK
- 10.3.3 France
- 10.3.4 Spain
- 10.3.5 Italy
- 10.3.6 Netherlands
- 10.4 Asia Pacific
- 10.4.1 China
- 10.4.2 India
- 10.4.3 Japan
- 10.4.4 Australia
- 10.4.5 South Korea
- 10.5 Latin America
- 10.5.1 Brazil
- 10.5.2 Mexico
- 10.5.3 Argentina
- 10.6 Middle East and Africa
- 10.6.1 Saudi Arabia
- 10.6.2 South Africa
- 10.6.3 UAE
Chapter 11 Company Profiles
- 11.1 A.B. Dental Devices
- 11.2 Adin Dental Implant Systems
- 11.3 AVINENT Implant System
- 11.4 Bicon
- 11.5 Cortex Dental Implants Industries
- 11.6 Dentsply Sirona
- 11.7 Envista Holdings Corporation
- 11.8 Glidewell
- 11.9 Henry Schein
- 11.10 Mega’gen Implant
- 11.11 MIS Implants Technologies
- 11.12 NucleOSS
- 11.13 Osstem Implant
- 11.14 Straumann Holding
- 11.15 ZimVie

