
PUBLISHER: Global Market Insights Inc. | PRODUCT CODE: 1858964

PUBLISHER: Global Market Insights Inc. | PRODUCT CODE: 1858964
Elevators Market Opportunity, Growth Drivers, Industry Trend Analysis, and Forecast 2025 - 2034
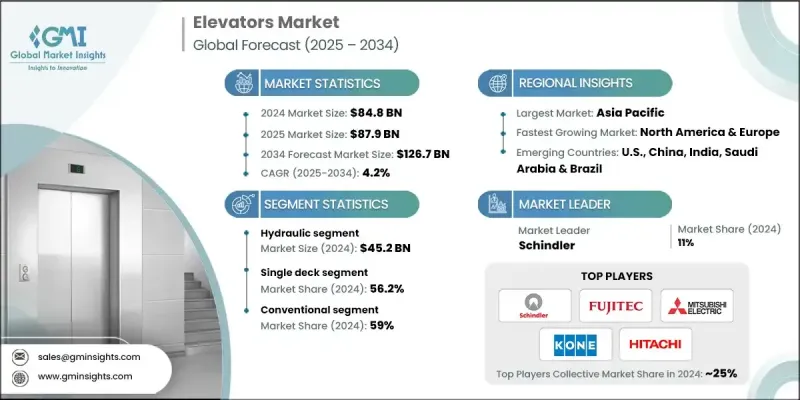
The Global Elevators Market was valued at USD 84.8 billion in 2024 and is estimated to grow at a CAGR of 4.2% to reach USD 126.7 billion by 2034.
This growth is driven by the expanding development of infrastructure and urban modernization worldwide. The rising demand for efficient vertical mobility solutions in both commercial and residential high-rise buildings is accelerating market growth. Urban development authorities are investing in smart city initiatives and large-scale infrastructure projects, which often require sophisticated elevator systems. Building refurbishments are also contributing significantly, as property owners are upgrading aging systems with newer, smarter technologies to align with updated building codes and improve operational performance. The emergence of smart elevators integrated with IoT, AI-enabled predictive maintenance, and destination dispatch systems is shaping the future of vertical transportation. These systems offer improved safety, energy efficiency, and user comfort through adaptive algorithms, real-time monitoring, and modernized interfaces. The market is also seeing sustained demand from retrofit projects, where existing buildings are being equipped with advanced elevator technologies to boost functionality and extend service life.
| Market Scope | |
|---|---|
| Start Year | 2024 |
| Forecast Year | 2025-2034 |
| Start Value | $84.8 Billion |
| Forecast Value | $126.7 Billion |
| CAGR | 4.2% |
The hydraulic elevators segment generated USD 45.2 billion in 2024 and is projected to grow at a CAGR of 3.4% from 2025 to 2034. Their continued popularity stems from their practicality in low- to mid-rise buildings. These systems are recognized for their lower upfront costs, ease of integration into compact spaces, and reduced maintenance needs compared to traction elevators. Recent innovations in sustainable hydraulic technology, including eco-friendly fluids and more efficient mechanisms, are improving environmental compliance and operational performance, making them a preferred choice in space-conscious and budget-sensitive projects.
The single-deck segment held a 56.2% share in 2024 and is anticipated to grow at a CAGR of 3.9% through 2034. This dominance is attributed to its widespread use in residential, mid-rise commercial buildings, and modernization projects. Single-deck elevators are simpler in design, more affordable, and easier to maintain, making them highly compatible with a broad range of architectural layouts. Their uncomplicated installation process and lower structural requirements have made them a preferred solution for both new developments and building retrofits.
United States Elevators Market generated USD 13 billion in 2024 and is forecasted to grow at a CAGR of 2.9% from 2025 to 2034. The country's dominance is fueled by a strong pipeline of commercial and residential construction, along with renovation projects aimed at modernizing outdated infrastructure. Ongoing efforts in green building, smart urban planning, and high-rise expansion are increasing the demand for next-generation elevator systems. The presence of industry leaders such as Mitsubishi Electric, Hitachi, TK Elevator, KONE, and Schindler, coupled with favorable regulations focused on safety and energy efficiency, reinforces the U.S. market's leadership position.
Key players in the Global Elevators Market include Toshiba, Hyundai Elevator, TK Elevator, Mitsubishi Electric, Fujitec, Hitachi, Electra Elevators, Schindler, Canny Elevator, Sigma Elevator, Aritco, ESCON Elevators, Schumacher Elevator, KONE, and EMAK. Companies operating in the global elevators market are strengthening their position through continuous investment in R&D and integration of advanced technologies like AI, IoT, and energy-efficient components. Many manufacturers are shifting focus toward developing smart elevators equipped with predictive maintenance systems and digital control interfaces to enhance performance and reduce downtime. Strategic partnerships with construction firms, real estate developers, and government agencies involved in infrastructure projects are also key to expanding market share. Leading brands are increasingly focusing on retrofit opportunities, offering upgrade solutions tailored to existing buildings.
Table of Contents
Chapter 1 Methodology & Scope
- 1.1 Market scope and definition
- 1.2 Research design
- 1.2.1 Research approach
- 1.2.2 Data collection methods
- 1.3 Data mining sources
- 1.3.1 Global
- 1.3.2 Regional/Country
- 1.4 Base estimates and calculations
- 1.4.1 Base year calculation
- 1.4.2 Key trends for market estimation
- 1.5 Primary research and validation
- 1.5.1 Primary sources
- 1.6 Forecast model
- 1.7 Research assumptions and limitations
Chapter 2 Executive Summary
- 2.1 Industry 360° synopsis
- 2.2 Key market trends
- 2.2.1 Regional
- 2.2.2 Product
- 2.2.3 Deck type
- 2.2.4 Building height
- 2.2.5 Speed
- 2.2.6 Destination control
- 2.2.7 Business
- 2.2.8 Application
- 2.2.9 End use
- 2.3 CXO perspectives: Strategic imperatives
- 2.3.1 Key decision points for industry executives
- 2.3.2 Critical success factors for market players
- 2.4 Future outlook and strategic recommendations
Chapter 3 Industry Insights
- 3.1 Industry ecosystem analysis
- 3.1.1 Supplier landscape
- 3.1.2 Profit margin
- 3.1.3 Value addition at each stage
- 3.1.4 Factor affecting the value chain
- 3.2 Industry impact forces
- 3.2.1 Growth drivers
- 3.2.1.1 Smart cities & infrastructure development
- 3.2.1.2 Modernization of aging infrastructure
- 3.2.1.3 Development of innovative technologies and rising demand for smart elevators
- 3.2.2 Industry pitfalls & challenges
- 3.2.2.1 High initial investment costs
- 3.2.2.2 Stringent safety regulations
- 3.2.1 Growth drivers
- 3.3 Growth potential analysis
- 3.4 Future market trends
- 3.5 Technology and innovation landscape
- 3.5.1 Current technological trends
- 3.5.2 Emerging technologies
- 3.6 Price trends
- 3.6.1 By region
- 3.6.2 By product
- 3.7 Regulatory landscape
- 3.7.1 Standards and compliance requirements
- 3.7.2 Regional regulatory frameworks
- 3.7.3 Certification standards
- 3.8 Trade statistics
- 3.8.1 Major importing countries
- 3.8.2 Major exporting countries
- 3.9 Porter's analysis
- 3.10 PESTEL analysis
Chapter 4 Competitive Landscape, 2024
- 4.1 Introduction
- 4.2 Company market share analysis
- 4.2.1 By Region
- 4.2.1.1 North America
- 4.2.1.2 Europe
- 4.2.1.3 Asia Pacific
- 4.2.1.4 Latin America
- 4.2.1.5 Middle East & Africa
- 4.2.1 By Region
- 4.3 Company matrix analysis
- 4.4 Competitive analysis of major market players
- 4.5 Competitive positioning matrix
- 4.6 Key developments
- 4.6.1 Mergers & acquisitions
- 4.6.2 Partnerships & collaborations
- 4.6.3 New product launches
- 4.6.4 Expansion plans
Chapter 5 Market Estimates & Forecast, By Product, 2021 - 2034, (USD Billion) (Thousand Units)
- 5.1 Key trends
- 5.2 Hydraulic
- 5.3 Traction
- 5.4 Machine room-less traction
Chapter 6 Market Estimates & Forecast, By Deck Type, 2021 - 2034, (USD Billion) (Thousand Units)
- 6.1 Key trends
- 6.2 Single deck
- 6.3 Double deck
Chapter 7 Market Estimates & Forecast, By Building Height, 2021 - 2034, (USD Billion) (Thousand Units)
- 7.1 Key trends
- 7.2 Low-rise
- 7.3 Mid-rise
- 7.4 High-rise
Chapter 8 Market Estimates & Forecast, By Speed, 2021 - 2034, (USD Billion) (Thousand Units)
- 8.1 Key trends
- 8.2 Less than 1m/s
- 8.3 Between 1 m/s to 3 m/s
- 8.4 Between 4 m/s to 6 m/s
- 8.5 Between 7 m/s to 10 m/s
- 8.6 Above 10 m/s
Chapter 9 Market Estimates & Forecast, By Destination Control, 2021 - 2034, (USD Billion) (Thousand Units)
- 9.1 Key trends
- 9.2 Smart
- 9.3 Conventional
Chapter 10 Market Estimates & Forecast, By Business, 2021 - 2034, (USD Billion) (Thousand Units)
- 10.1 Key trends
- 10.2 New equipment
- 10.3 Maintenance
- 10.4 Modernization
Chapter 11 Market Estimates & Forecast, By Application, 2021 - 2034, (USD Billion) (Thousand Units)
- 11.1 Key trends
- 11.2 Passenger
- 11.3 Freight
Chapter 12 Market Estimates & Forecast, By End Use, 2021 - 2034, (USD Billion) (Thousand Units)
- 12.1 Key trends
- 12.2 Residential
- 12.2.1 Home lifts
- 12.2.2 Others
- 12.3 Industrial
- 12.4 Commercial
- 12.4.1 Office
- 12.4.2 Hotels
- 12.4.3 Healthcare
- 12.4.4 Others (Shopping malls)
Chapter 13 Market Estimates & Forecast, By Region, 2021 - 2034, (USD Billion) (Thousand Units)
- 13.1 Key trends
- 13.2 North America
- 13.2.1 U.S.
- 13.2.2 Canada
- 13.3 Europe
- 13.3.1 Germany
- 13.3.2 UK
- 13.3.3 France
- 13.3.4 Italy
- 13.3.5 Spain
- 13.4 Asia Pacific
- 13.4.1 China
- 13.4.2 India
- 13.4.3 Japan
- 13.4.4 South Korea
- 13.4.5 Australia
- 13.4.6 Indonesia
- 13.4.7 Malaysia
- 13.5 Latin America
- 13.5.1 Brazil
- 13.5.2 Mexico
- 13.5.3 Argentina
- 13.6 MEA
- 13.6.1 Saudi Arabia
- 13.6.2 UAE
- 13.6.3 South Africa
Chapter 14 Company Profiles
- 14.1 Aritco
- 14.2 Canny Elevator
- 14.3 Electra Elevators
- 14.4 EMAK
- 14.5 ESCON Elevators
- 14.6 Fujitec
- 14.7 Hitachi
- 14.8 Hyundai Elevator
- 14.9 KONE
- 14.10 Mitsubishi Electric
- 14.11 Schindler
- 14.12 Schumacher Elevator
- 14.13 Sigma Elevator
- 14.14 TK Elevator
- 14.15 Toshiba

