
PUBLISHER: Global Market Insights Inc. | PRODUCT CODE: 1913447

PUBLISHER: Global Market Insights Inc. | PRODUCT CODE: 1913447
Butylated Hydroxytoluene (BHT) Market Opportunity, Growth Drivers, Industry Trend Analysis, and Forecast 2026 - 2035
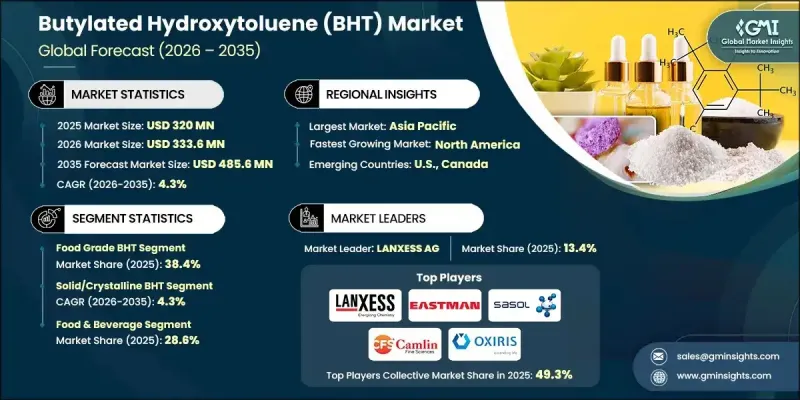
The Global Butylated Hydroxytoluene (BHT) Market was valued at USD 320 million in 2025 and is estimated to grow at a CAGR of 4.3% to reach USD 485.6 million by 2035.
Market development is supported by the widespread use of butylated hydroxytoluene as an effective antioxidant across multiple industries. BHT plays a critical role in slowing oxidation in fats and oils, which directly supports longer product stability and extended shelf life. Its ability to neutralize free radicals helps prevent degradation and quality loss, making it an essential ingredient in food preservation, personal care formulations, and pharmaceutical products. Rising demand for packaged and long-shelf-life products is reinforcing its importance in industrial processing. BHT continues to be favored due to its cost efficiency, strong antioxidant performance, and minimal impact on product characteristics. Expanding food processing and cosmetics production in developing economies is further supporting market growth. However, evolving regulatory frameworks and health-related concerns in certain regions are shaping market dynamics, encouraging manufacturers to focus on compliance, quality assurance, and product purity to maintain demand and ensure long-term market stability.
| Market Scope | |
|---|---|
| Start Year | 2025 |
| Forecast Year | 2026-2035 |
| Start Value | $320 Million |
| Forecast Value | $485.6 Million |
| CAGR | 4.3% |
The food grade BHT accounted for 38.4% share in 2025 and is expected to grow at a CAGR of 4.4% through 2035. This segment benefits from strong demand for antioxidant solutions in processed foods, cereals, beverages, and animal nutrition products. The need to maintain freshness and product integrity continues to support consumption, although regulatory oversight and shifting consumer preferences are influencing formulation strategies.
The solid or crystalline BHT segment held 73.4% share in 2025 and is forecast to grow at a CAGR of 4.3% from 2026 to 2035. This form is widely adopted due to its stability, ease of handling, precise dosing capability, and compatibility with various formulations. Its consistent performance and storage advantages continue to drive demand across food, pharmaceutical, and cosmetic applications.
North America Butylated Hydroxytoluene (BHT) Market held 29.9% share in 2025. Regional growth is supported by stable demand from food, pharmaceutical, and cosmetic manufacturers, along with strict quality and safety standards. Emphasis on high-purity formulations and regulatory compliance continues to shape purchasing decisions and sustain market momentum.
Key companies operating in the Global Butylated Hydroxytoluene (BHT) Market include Lanxess AG, Eastman Chemical Company, SI Group, Sasol Limited, Kemin Industries, Camlin Fine Sciences Ltd., Akrochem Corporation, KH Chemicals BV, Oxiris Chemicals S.A., Ratnagiri Chemicals Pvt Ltd, AB Enterprises, and Anmol Chemicals. Companies active in the Global Butylated Hydroxytoluene (BHT) Market are strengthening their competitive position through a combination of quality enhancement, regulatory alignment, and portfolio optimization. Manufacturers are focusing on producing high-purity grades to meet increasingly strict safety standards across food, cosmetic, and pharmaceutical applications. Strategic investments in process efficiency and quality control systems are helping improve consistency and reliability. Firms are also expanding their presence in emerging markets where food processing and personal care industries are growing steadily. Long-term supply agreements with end users, competitive pricing strategies, and improved distribution networks are supporting market penetration.
Table of Contents
Chapter 1 Methodology & Scope
- 1.1 Market scope and definition
- 1.2 Research design
- 1.2.1 Research approach
- 1.2.2 Data collection methods
- 1.3 Data mining sources
- 1.3.1 Global
- 1.3.2 Regional/Country
- 1.4 Base estimates and calculations
- 1.4.1 Base year calculation
- 1.4.2 Key trends for market estimation
- 1.5 Primary research and validation
- 1.5.1 Primary sources
- 1.6 Forecast model
- 1.7 Research assumptions and limitations
Chapter 2 Executive Summary
- 2.1 Industry 3600 synopsis
- 2.2 Key market trends
- 2.2.1 Regional
- 2.2.2 Grade
- 2.2.3 Form
- 2.2.4 Application
- 2.3 TAM Analysis, 2026-2035
- 2.4 CXO perspectives: Strategic imperatives
- 2.4.1 Executive decision points
- 2.4.2 Critical success factors
- 2.5 Future Outlook and Strategic Recommendations
Chapter 3 Industry Insights
- 3.1 Industry ecosystem analysis
- 3.1.1 Supplier landscape
- 3.1.2 Profit margin
- 3.1.3 Value addition at each stage
- 3.1.4 Factor affecting the value chain
- 3.1.5 Disruptions
- 3.2 Industry impact forces
- 3.2.1 Growth drivers
- 3.2.2 Industry pitfalls and challenges
- 3.2.3 Market opportunities
- 3.3 Growth potential analysis
- 3.4 Regulatory landscape
- 3.4.1 North America
- 3.4.2 Europe
- 3.4.3 Asia Pacific
- 3.4.4 Latin America
- 3.4.5 Middle East & Africa
- 3.5 Porter's analysis
- 3.6 PESTEL analysis
- 3.7 Price trends
- 3.7.1 By region
- 3.7.2 By Product type
- 3.8 Future market trends
- 3.9 Technology and Innovation landscape
- 3.9.1 Current technological trends
- 3.9.2 Emerging technologies
- 3.10 Patent Landscape
- 3.11 Trade statistics (HS code) ( Note: the trade statistics will be provided for key countries only)
- 3.11.1 Major importing countries
- 3.11.2 Major exporting countries
- 3.12 Sustainability and environmental aspects
- 3.12.1 Sustainable practices
- 3.12.2 Waste reduction strategies
- 3.12.3 Energy efficiency in production
- 3.12.4 Eco-friendly initiatives
- 3.13 Carbon footprint consideration
Chapter 4 Competitive Landscape, 2025
- 4.1 Introduction
- 4.2 Company market share analysis
- 4.2.1 By region
- 4.2.1.1 North America
- 4.2.1.2 Europe
- 4.2.1.3 Asia Pacific
- 4.2.1.4 LATAM
- 4.2.1.5 MEA
- 4.2.1 By region
- 4.3 Company matrix analysis
- 4.4 Competitive analysis of major market players
- 4.5 Competitive positioning matrix
- 4.6 Key developments
- 4.6.1 Mergers & acquisitions
- 4.6.2 Partnerships & collaborations
- 4.6.3 New Product Launches
- 4.6.4 Expansion Plans
Chapter 5 Market Estimates and Forecast, By Grade, 2022-2035 (USD Million) (Kilo Tons)
- 5.1 Key trends
- 5.2 Food grade BHT
- 5.3 Pharmaceutical grade
- 5.4 Technical/industrial grade BHT
Chapter 6 Market Estimates and Forecast, By Form, 2022-2035 (USD Million) (Kilo Tons)
- 6.1 Key trends
- 6.2 Solid/crystalline BHT
- 6.3 Liquid BHT
Chapter 7 Market Estimates and Forecast, By Application, 2022-2035 (USD Million) (Kilo Tons)
- 7.1 Key trends
- 7.2 Food & beverage
- 7.3 Cosmetics & personal care
- 7.4 Pharmaceutical formulations
- 7.5 Polymer & plastic stabilization
- 7.6 Lubricants & petroleum products
- 7.7 Animal feed additives
- 7.8 Packaging materials & food contact substances
Chapter 8 Market Estimates and Forecast, By Region, 2022-2035 (USD Million) (Kilo Tons)
- 8.1 Key trends
- 8.2 North America
- 8.2.1 U.S.
- 8.2.2 Canada
- 8.3 Europe
- 8.3.1 Germany
- 8.3.2 UK
- 8.3.3 France
- 8.3.4 Spain
- 8.3.5 Italy
- 8.3.6 Rest of Europe
- 8.4 Asia Pacific
- 8.4.1 China
- 8.4.2 India
- 8.4.3 Japan
- 8.4.4 Australia
- 8.4.5 South Korea
- 8.4.6 Rest of Asia Pacific
- 8.5 Latin America
- 8.5.1 Brazil
- 8.5.2 Mexico
- 8.5.3 Argentina
- 8.5.4 Rest of Latin America
- 8.6 Middle East and Africa
- 8.6.1 Saudi Arabia
- 8.6.2 South Africa
- 8.6.3 UAE
- 8.6.4 Rest of Middle East and Africa
Chapter 9 Company Profiles
- 9.1 AB Enterprises
- 9.2 Akrochem Corporation
- 9.3 Anmol Chemicals
- 9.4 Camlin Fine Sciences Ltd.
- 9.5 Eastman Chemical Company
- 9.6 Kemin Industries
- 9.7 KH Chemicals BV
- 9.8 Lanxess AG
- 9.9 Oxiris Chemicals S.A.
- 9.10 Ratnagiri Chemicals Pvt Ltd
- 9.11 Sasol Limited
- 9.12 SI Group

