
PUBLISHER: Global Market Insights Inc. | PRODUCT CODE: 1773233

PUBLISHER: Global Market Insights Inc. | PRODUCT CODE: 1773233
Coenzyme Q10 Market Opportunity, Growth Drivers, Industry Trend Analysis, and Forecast 2025 - 2034
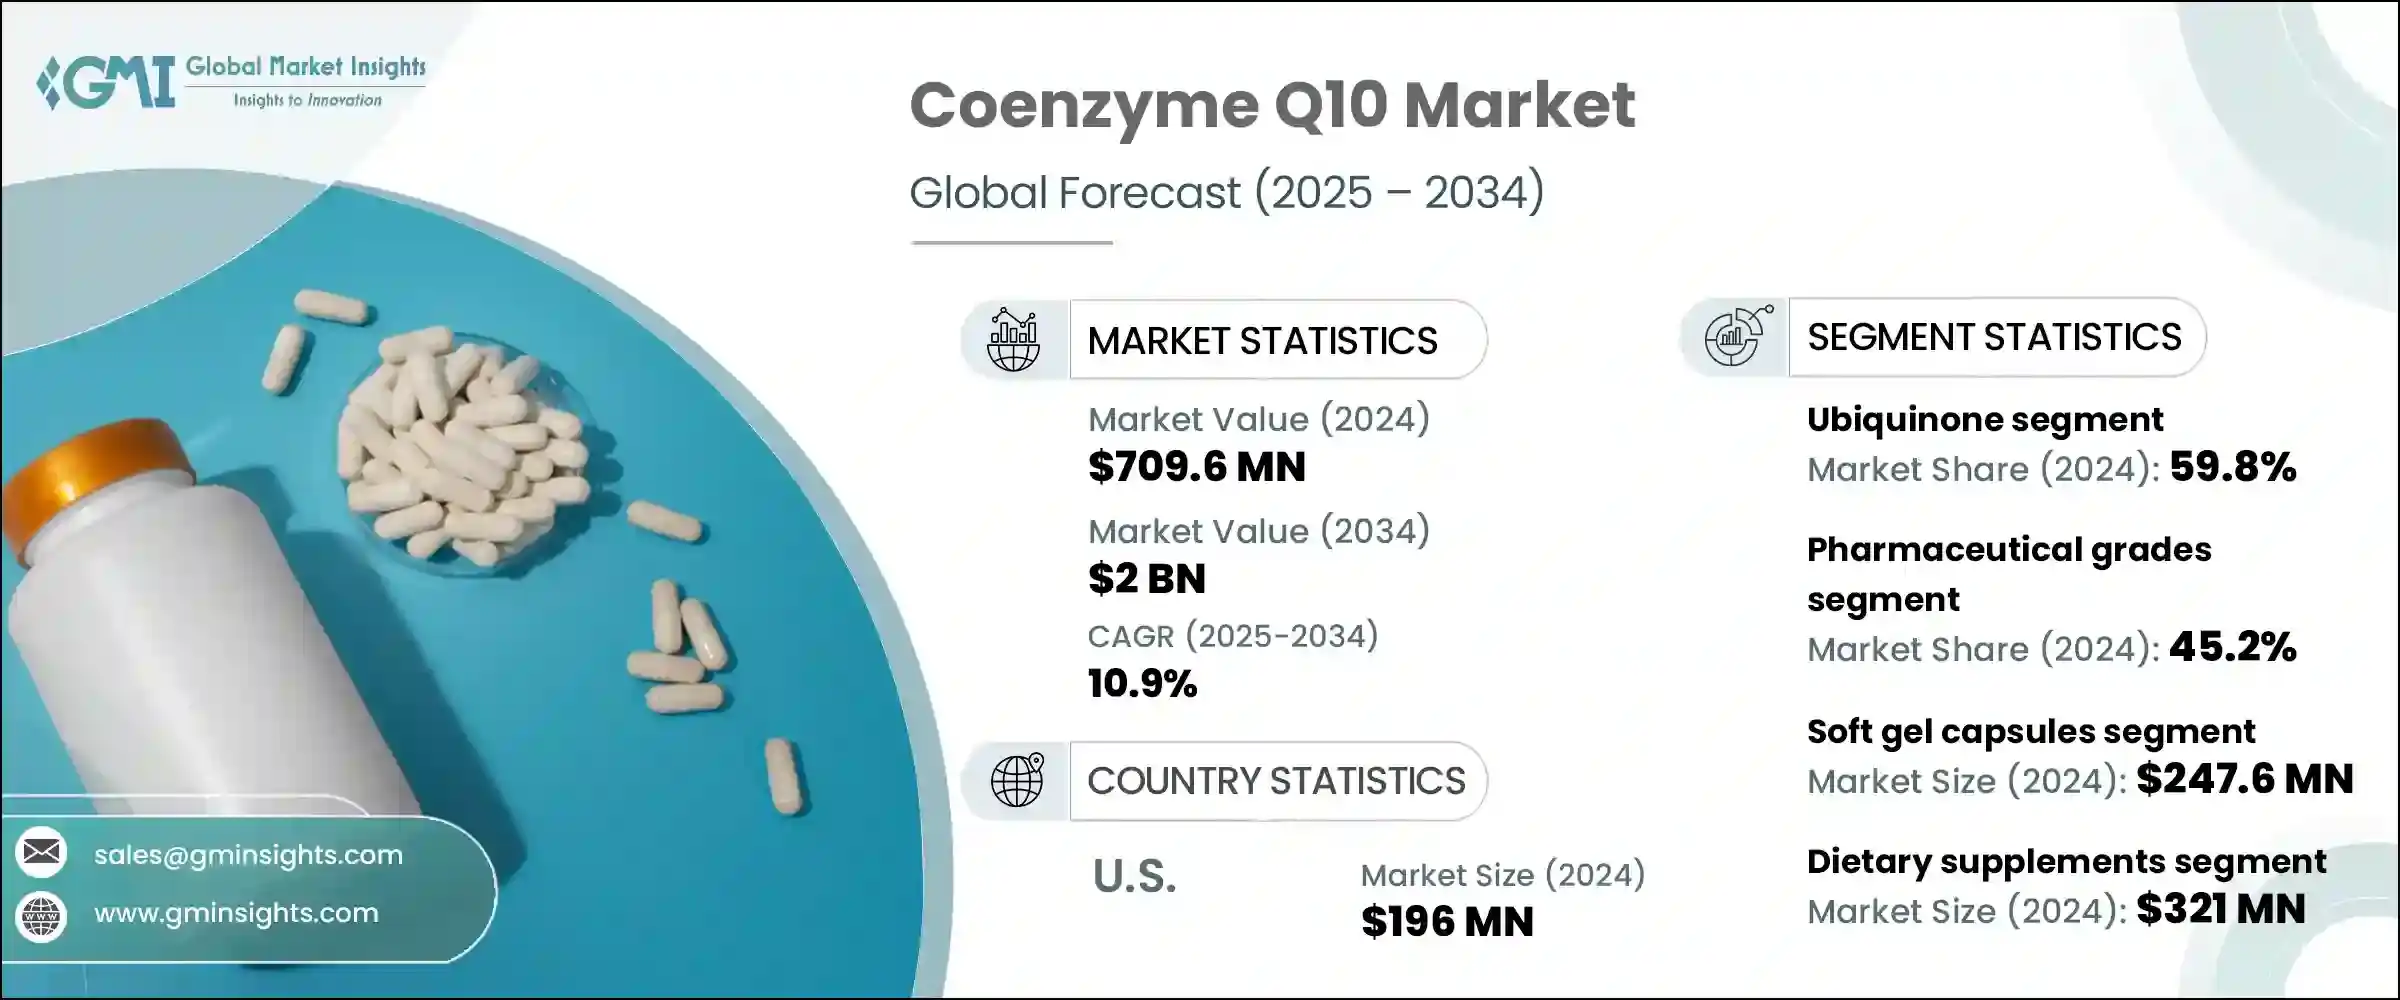
The Global Coenzyme Q10 Market was valued at USD 709.6 million in 2024 and is estimated to grow at a CAGR of 10.9% to reach USD 2 billion by 2034. This growth can be attributed to the increasing awareness among consumers about preventive healthcare, the rising popularity of dietary supplements, and the growing use of CoQ10 in pharmaceuticals and cosmetics. CoQ10, a naturally occurring antioxidant in the body, plays a crucial role in cellular energy production and offers protection against oxidative damage.
As the population ages and chronic conditions like cardiovascular, neurological, and metabolic disorders become more common, the demand for CoQ10 supplements rises. Nutraceutical companies are incorporating CoQ10 into products such as soft gel capsules, heart health supplements, and functional beverages that help reduce fatigue and enhance vitality. The pharmaceutical industry also relies on CoQ10 for treating conditions like heart failure, hypertension, and myopathy caused by statins.
| Market Scope | |
|---|---|
| Start Year | 2024 |
| Forecast Year | 2025-2034 |
| Start Value | $709.6 Million |
| Forecast Value | $2 Billion |
| CAGR | 10.9% |
In the cosmetics industry, Coenzyme Q10 (CoQ10) is gaining significant traction due to its powerful antioxidant properties and its ability to combat the visible signs of aging. It is used in skincare formulations, enhancing skin elasticity and promoting a smoother, firmer complexion. CoQ10 works by neutralizing free radicals that accelerate the aging process, helping to protect the skin from oxidative damage caused by environmental stressors like UV radiation and pollution. This antioxidant action not only reduces the appearance of fine lines and wrinkles but also improves the overall texture and tone of the skin. Furthermore, CoQ10 is believed to boost collagen production, which is essential for maintaining skin structure and firmness as we age. As a result, it is commonly found in a variety of anti-aging products such as creams, serums, and lotions.
In 2024, the ubiquinone segment dominated the market, accounting for 59.8% share. This form of CoQ10 is known for its widespread availability, affordability, and stable characteristics during manufacturing, which contribute to its longer shelf life. Its use in dietary supplements and pharmaceuticals has positioned ubiquinone as the leader in the market. While ubiquinol, the reduced form of CoQ10, offers stronger bioavailability and enhanced antioxidant properties, it remains less stable and more expensive, limiting its widespread adoption despite its appeal among aging consumers and in premium supplements.
The pharmaceutical-grade CoQ10 segment held a 45.2% share in 2024 and is expected to grow at a robust CAGR of 11% by 2034. This growth is driven by the rising treatment needs for cardiovascular diseases, neurological disorders, and statin deficiencies. The high purity and clinical effectiveness of pharmaceutical-grade CoQ10 make it important in therapeutic settings. Although food-grade CoQ10 is gaining popularity, particularly in the functional food and dietary supplement industries, it remains a smaller portion of the market. Additionally, cosmetic-grade CoQ10 is used in skin care products like creams, serums, and lotions due to its antioxidant and anti-aging benefits.
United States Coenzyme Q10 Market was valued at USD 196 million in 2024. This dominance is attributed to the country's advanced healthcare system, high consumer awareness about dietary supplements, and a culture that embraces preventive healthcare. The U.S. benefits from regulations like the Dietary Supplement Health and Education Act, which permits CoQ10 to be sold as an over-the-counter supplement. The high prevalence of cardiovascular diseases in the U.S. has also contributed to the increased demand for CoQ10. Additionally, e-commerce platforms are driving sales, with numerous online stores dedicated to CoQ10 supplements.
Key market players in the Global Coenzyme Q10 Market include Kaneka Corporation, DSM, SourceOne Global Partners, LLC, Healthy Origins, and Vitamin Shoppe, Inc. These companies are pivotal in shaping the market by offering innovative products and expanding their reach through various distribution channels. To strengthen their market position, companies in the CoQ10 industry are focusing on several strategic approaches.
They are heavily investing in research and development to improve the bioavailability and stability of CoQ10, ensuring that their products meet the evolving needs of consumers. Expanding product lines to include both premium and affordable CoQ10 options helps capture a wider customer base. These companies are also leveraging strategic partnerships with distributors and retailers to enhance product availability across diverse markets. Moreover, they are tapping into emerging markets by increasing awareness and promoting the health benefits of CoQ10, particularly in the areas of cardiovascular health and anti-aging.
Table of Contents
Chapter 1 Methodology
- 1.1 Market scope and definition
- 1.2 Research design
- 1.2.1 Research approach
- 1.2.2 Data collection methods
- 1.3 Data mining sources
- 1.3.1 Global
- 1.3.2 Regional/Country
- 1.4 Base estimates and calculations
- 1.4.1 Base year calculation
- 1.4.2 Key trends for market estimation
- 1.5 Primary research and validation
- 1.5.1 Primary sources
- 1.6 Forecast model
- 1.7 Research assumptions and limitations
Chapter 2 Executive Summary
- 2.1 Industry 360° synopsis
- 2.2 Key market trends
- 2.2.1 Regional
- 2.2.2 Product type
- 2.2.3 Grade
- 2.2.4 Formulation
- 2.2.5 Application
- 2.2.6 Distribution channel
- 2.3 TAM Analysis, 2025-2034
- 2.4 CXO perspectives: Strategic imperatives
- 2.4.1 Executive decision points
- 2.4.2 Critical success factors
- 2.5 Future Outlook and Strategic Recommendations
Chapter 3 Industry Insights
- 3.1 Industry ecosystem analysis
- 3.1.1 Supplier landscape
- 3.1.2 Profit margin
- 3.1.3 Value addition at each stage
- 3.1.4 Factor affecting the value chain
- 3.1.5 Disruptions
- 3.2 Industry impact forces
- 3.2.1 Growth drivers
- 3.2.2 Industry pitfalls and challenges
- 3.2.3 Market opportunities
- 3.3 Growth potential analysis
- 3.4 Regulatory landscape
- 3.4.1 North America
- 3.4.2 Europe
- 3.4.3 Asia Pacific
- 3.4.4 Latin America
- 3.4.5 Middle East & Africa
- 3.5 Porter's analysis
- 3.6 PESTEL analysis
- 3.6.1 Technology and innovation landscape
- 3.6.2 Current technological trends
- 3.6.3 Emerging technologies
- 3.7 Price trends
- 3.7.1 By region
- 3.7.2 By product
- 3.8 Future market trends
- 3.9 Technology and Innovation landscape
- 3.9.1 Current technological trends
- 3.9.2 Emerging technologies
- 3.10 Patent landscape
- 3.11 Trade statistics (HS code) (Note: the trade statistics will be provided for key countries only
- 3.11.1 Major importing countries
- 3.11.2 Major exporting countries
- 3.12 Sustainability and environmental aspects
- 3.12.1 Sustainable practices
- 3.12.2 Waste reduction strategies
- 3.12.3 Energy efficiency in production
- 3.12.4 Eco-friendly initiatives
- 3.13 Coenzyme Q10 biochemistry & formulations
- 3.13.1 Biochemistry & molecular structure
- 3.13.1.1 Chemical structure & properties
- 3.13.1.2 Oxidized vs. Reduced forms
- 3.13.1.3 Biological functions & mechanisms
- 3.13.1.4 Endogenous production & depletion factors
- 3.13.2 Production methods
- 3.13.2.1 Chemical synthesis
- 3.13.2.2 Fermentation process
- 3.13.2.3 Extraction from natural sources
- 3.13.2.4 Semi-synthetic approaches
- 3.13.2.5 Emerging production technologies
- 3.13.3 Formulation technologies
- 3.13.3.1 Powder & crystalline forms
- 3.13.3.2 Oil suspensions & solutions
- 3.13.3.3 Emulsions & microemulsions
- 3.13.3.4 Liposomal & micellar formulations
- 3.13.3.5 Nanoparticle-based delivery systems
- 3.13.3.6 Cyclodextrin complexes
- 3.13.4 Bioavailability enhancement strategies
- 3.13.4.1 Solubility enhancement techniques
- 3.13.4.2 Particle size reduction
- 3.13.4.3 Lipid-based delivery systems
- 3.13.4.4 Co-administration with enhancers
- 3.13.4.5 Novel carrier systems
- 3.13.5 Stability & shelf-life considerations
- 3.13.5.1 Oxidation & degradation mechanisms
- 3.13.5.2 Temperature & light sensitivity
- 3.13.5.3 Packaging & storage requirements
- 3.13.5.4 Stabilization techniques
- 3.13.5.5 Shelf-life extension strategies
- 3.13.1 Biochemistry & molecular structure
- 3.14 Health benefits & clinical applications
- 3.14.1 Cardiovascular health
- 3.14.1.1 Mechanisms of action
- 3.14.1.2 Clinical evidence in hypertension
- 3.14.1.3 Effects on cholesterol & lipid profiles
- 3.14.1.4 Applications in heart failure
- 3.14.1.5 Statin-associated myopathy management
- 3.14.2 Energy production & mitochondrial function
- 3.14.2.1 Role in electron transport chain
- 3.14.2.2 Atp synthesis enhancement
- 3.14.2.3 Mitochondrial disorders applications
- 3.14.2.4 Fatigue & exercise performance
- 3.14.2.5 Aging & mitochondrial dysfunction
- 3.14.3 Antioxidant properties & oxidative stress
- 3.14.3.1 Free radical scavenging mechanisms
- 3.14.3.2 Cellular protection effects
- 3.14.3.3 Synergy with other antioxidants
- 3.14.3.4 Oxidative stress-related conditions
- 3.14.3.5 Inflammation modulation
- 3.14.4 Neurological applications
- 3.14.4.1 Neuroprotective mechanisms
- 3.14.4.2 Migraine prevention
- 3.14.4.3 Neurodegenerative diseases
- 3.14.4.4 Cognitive function & brain health
- 3.14.4.5 Clinical evidence & research status
- 3.14.5 Other therapeutic applications
- 3.14.5.1 Fertility & reproductive health
- 3.14.5.2 Periodontal health
- 3.14.5.3 Diabetes & metabolic syndrome
- 3.14.5.4 Cancer adjuvant therapy
- 3.14.5.5 Emerging clinical applications
- 3.14.6 Dosage & administration considerations
- 3.14.6.1 Recommended dosage ranges
- 3.14.6.2 Timing & administration protocols
- 3.14.6.3 Drug interactions & contraindications
- 3.14.6.4 Safety profile & adverse effects
- 3.14.6.5 Special population considerations
- 3.14.1 Cardiovascular health
- 3.15 GMP & manufacturing standards
- 3.15.1 Good manufacturing practices
- 3.15.2 Quality management systems
- 3.15.3 Facility requirements
- 3.15.4 Documentation & record keeping
- 3.15.5 Audit & certification programs
- 3.16 Consumer trends & market segmentation
- 3.16.1 Consumer demographics & behaviour
- 3.16.2 Age & gender distribution
- 3.16.3 Health consciousness & awareness
- 3.16.4 Income level & purchasing power
- 3.16.5 Education & knowledge factors
- 3.16.6 Regional & cultural variations
- 3.17 Usage patterns & preferences
- 3.17.1 Preventive vs. Therapeutic use
- 3.17.2 Dosage & frequency preferences
- 3.17.3 Formulation & delivery format preferences
- 3.17.4 Brand loyalty & switching behaviour
- 3.18 Purchase channels & decision factors
- 3.18.1 Retail vs. Online purchasing
- 3.18.2 Healthcare professional influence
- 3.18.3 Information sources & research behaviour
- 3.18.4 Key purchase decision factors
- 3.18.5 Promotional & marketing influence
- 3.19 Emerging consumer trends
- 3.19.1 Clean label & natural preferences
- 3.19.2 Personalized nutrition interest
- 3.19.3 Sustainability & ethical considerations
- 3.19.4 Digital health integration
- 3.19.5 Combination product preferences
- 3.20 Market segmentation analysis
- 3.20.1 Mass market vs. Premium segments
- 3.20.2 Medical vs. Wellness positioning
- 3.20.3 Age-specific targeting
- 3.20.4 Condition-specific formulations
- 3.20.5 Regional market differences
Chapter 4 Competitive Landscape, 2024
- 4.1 Introduction
- 4.2 Company market share analysis
- 4.2.1 By region
- 4.2.1.1 North America
- 4.2.1.2 Europe
- 4.2.1.3 Asia Pacific
- 4.2.1.4 LATAM
- 4.2.1.5 MEA
- 4.2.1 By region
- 4.3 Company matrix analysis
- 4.4 Competitive analysis of major market players
- 4.5 Competitive positioning matrix
- 4.6 Key developments
- 4.6.1 Mergers & acquisitions
- 4.6.2 Partnerships & collaborations
- 4.6.3 New Product Launches
- 4.6.4 Expansion Plans
Chapter 5 Market Estimates & Forecast, By Product Type, 2021-2034 (USD Million) (Kilo Tons)
- 5.1 Key trend
- 5.2 Ubiquinone (oxidized form)
- 5.3 Ubiquinol (reduced form)
Chapter 6 Market Estimates & Forecast, By Grade, 2021-2034 (USD Million) (Kilo Tons)
- 6.1 Key trend
- 6.2 Pharmaceutical grade
- 6.3 Food grade
- 6.4 Cosmetic grade
Chapter 7 Market Estimates & Forecast, By Formulation, 2021-2034 (USD Million) (Kilo Tons)
- 7.1 Key trend
- 7.2 Powder & crystalline forms
- 7.3 Oil suspensions & solutions
- 7.4 Softgel capsules
- 7.5 Hard capsules
- 7.6 Tablets & chewables
- 7.7 Advanced delivery systems
- 7.7.1 Liposomal & micellar formulations
- 7.7.2 Nanoparticle-based systems
- 7.7.3 Other advanced formulations
- 7.8 Other formulations
Chapter 8 Market Estimates & Forecast, By Application, 2021-2034 (USD Million) (Kilo Tons)
- 8.1 Key trend
- 8.2 Dietary supplements
- 8.2.1 General health & wellness
- 8.2.2 Heart health
- 8.2.3 Energy & performance
- 8.2.4 Anti-aging
- 8.2.5 Other supplement applications
- 8.3 Pharmaceuticals
- 8.3.1 Prescription medications
- 8.3.2 Over-the-counter (OTC) products
- 8.3.3 Medical foods
- 8.4 Cosmetics & personal care
- 8.4.1 Anti-aging skincare
- 8.4.2 Sun protection products
- 8.4.3 Hair care products
- 8.4.4 Other cosmetic applications
- 8.5 Functional foods & beverages
- 8.5.1 Fortified foods
- 8.5.2 Functional beverages
- 8.5.3 Nutritional bars & snacks
- 8.6 Animal nutrition
- 8.6.1 Pet supplements
- 8.6.2 Livestock feed additives
- 8.7 Other applications
Chapter 9 Market Estimates & Forecast, By Distribution Channel, 2021-2034 (USD Million) (Kilo Tons)
- 9.1 Key trend
- 9.2 Retail pharmacies & drug stores
- 9.3 Supermarkets & hypermarkets
- 9.4 Specialty health stores
- 9.5 Online retail
- 9.5.1 E-commerce platforms
- 9.5.2 Direct-to-consumer websites
- 9.5.3 Subscription services
- 9.6 Healthcare practitioners
- 9.7 Other distribution channels
Chapter 10 Market Estimates & Forecast, By Region, 2021-2034 (USD Million) (Kilo Tons)
- 10.1 Key trends
- 10.2 North America
- 10.2.1 U.S.
- 10.2.2 Canada
- 10.3 Europe
- 10.3.1 Germany
- 10.3.2 UK
- 10.3.3 France
- 10.3.4 Italy
- 10.3.5 Spain
- 10.4 Asia Pacific
- 10.4.1 China
- 10.4.2 India
- 10.4.3 Japan
- 10.4.4 Australia
- 10.4.5 South Korea
- 10.5 Latin America
- 10.5.1 Brazil
- 10.5.2 Mexico
- 10.5.3 Argentina
- 10.6 Middle East & Africa
- 10.6.1 Saudi Arabia
- 10.6.2 South Africa
- 10.6.3 UAE
Chapter 11 Company Profiles
- 11.1 Country Life, LLC
- 11.2 Doctor’s Best
- 11.3 DSM
- 11.4 GNC Holdings, Inc
- 11.5 Healthy Origins
- 11.6 Jarrow Formulas
- 11.7 Kaneka Corporation
- 11.8 Natural Organics
- 11.9 NBTY, Inc.
- 11.10 Nordic Naturals, Inc.
- 11.11 NOW Foods
- 11.12 Pharma Nord, Inc.
- 11.13 Pharmavite LLC
- 11.14 QUTEN Research Institute LLC
- 11.15 SourceOne Global Partners, LLC
- 11.16 Tishcon Corp.
- 11.17 Vitamin Shoppe, Inc.
- 11.18 Xiamen Kingdomway Group

