
PUBLISHER: Global Market Insights Inc. | PRODUCT CODE: 1699347

PUBLISHER: Global Market Insights Inc. | PRODUCT CODE: 1699347
Aluminum Market Opportunity, Growth Drivers, Industry Trend Analysis, and Forecast 2025-2034
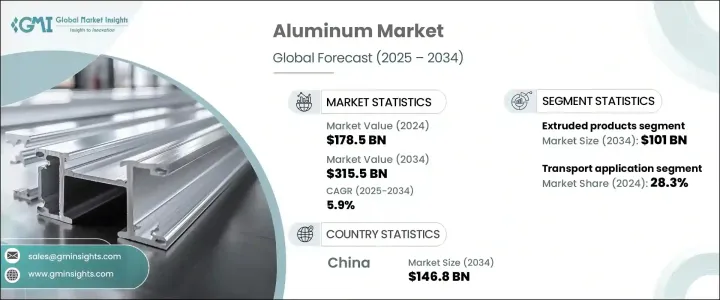
The Global Aluminum Market was valued at USD 178.5 billion in 2024 and is projected to grow at a 5.9% CAGR from 2025 to 2034. As one of the most prominent commodities, aluminum has seen strong demand, particularly in industrial applications. The global production of primary aluminum reached 72.3 million tons in 2023, demonstrating steady expansion. The market benefits from increasing consumption in various industries, with significant growth driven by lightweight materials, recyclability, and efficiency in manufacturing processes.
Based on product type, the aluminum market is categorized into flat products, forged products, extruded products, long products, cast products, and others. The extruded products segment recorded the highest growth, reaching USD 56.4 billion in 2024. Flat products followed closely, reaching USD 49.1 billion in 2024 due to their significant role in the automotive and packaging industries. These products dominated the market, contributing to over 40% of total sales.
| Market Scope | |
|---|---|
| Start Year | 2024 |
| Forecast Year | 2025-2034 |
| Start Value | $178.5 Billion |
| Forecast Value | $315.5 Billion |
| CAGR | 5.9% |
Extruded products remained in high demand, especially within the construction and transportation sectors. Meanwhile, flat products gained prominence due to their widespread use in the automotive industry, driven by the push for lightweight vehicles. The automotive sector alone accounted for approximately 30% of total aluminum consumption. Additionally, aerospace, building & construction, and the electrical industry emerged as key contributors to market expansion. Aluminum played a crucial role in power grids, transmission lines, and large-scale infrastructure projects.
The market is further segmented based on processing methods, including rolling, extruding, drawing, casting, and forging. The drawing process is expected to dominate in the coming years, mainly due to its application in high-strength wire manufacturing and aerospace components. Aluminum casting accounted for 20% of processed aluminum, particularly within automotive and industrial machinery. Advanced processing technologies focused on reducing emissions and enhancing energy efficiency, further strengthening the industry's sustainability initiatives.
New technologies helped lower production costs and environmental impact. Despite moderate competitive rivalry, high capital investments acted as entry barriers for new players. The demand for lightweight aluminum alloys created new opportunities, although raw material price fluctuations presented challenges, especially as costs surged significantly post-pandemic.
The market is segmented by application into transport, construction, electrical & electronics, packaging, equipment & machinery, consumer durables, foil stock, and others. The transportation sector led with a 28.3% market share in 2024 and is anticipated to grow at a 4.5% CAGR through 2034. The electrical & electronics segment held a substantial share, with aluminum widely used in power transmission, circuit boards, and heat exchangers. Packaging contributed 15.2% of the market, as aluminum's recyclability made it a preferred material for food and beverage containers. Equipment & machinery, including industrial automation components, also saw significant growth.
The market outlook highlighted evolving regulations promoting sustainable aluminum usage, particularly in packaging and transportation. Supply chain disruptions posed challenges, while the rise in foil stock and consumer durables demand reinforced aluminum's market presence.
The aluminum market in China generated USD 80.9 billion in 2024 and is projected to reach USD 146.8 billion by 2034. The Asia Pacific region dominated due to industrial diversity and strong manufacturing capabilities. China accounted for 55% of aluminum production and nearly 50% of global consumption in 2024, producing 42 million tons of primary aluminum, surpassing its 2023 output. Government policies, abundant bauxite reserves, and energy subsidies contributed to this dominance. Urbanization and infrastructure expansion further fueled aluminum demand in the region.
Table of Contents
Chapter 1 Methodology & Scope
- 1.1 Market scope & definition
- 1.2 Base estimates & calculations
- 1.3 Forecast calculation
- 1.4 Data sources
- 1.4.1 Primary
- 1.4.2 Secondary
- 1.4.2.1 Paid sources
- 1.4.2.2 Public sources
- 1.5 Primary research and validation
- 1.5.1 Primary sources
- 1.5.2 Data mining sources
Chapter 2 Executive Summary
- 2.1 Industry synopsis, 2021-2034
Chapter 3 Industry Insights
- 3.1 Industry ecosystem analysis
- 3.1.1 Factor affecting the value chain
- 3.1.2 Profit margin analysis
- 3.1.3 Disruptions
- 3.1.4 Future outlook
- 3.1.5 Manufacturers
- 3.1.6 Distributors
- 3.2 Supplier landscape
- 3.3 Profit margin analysis
- 3.4 Key news & initiatives
- 3.5 Regulatory landscape
- 3.6 Impact forces
- 3.6.1 Growth drivers
- 3.6.1.1 Rising demand for lightweight materials in automotive
- 3.6.1.2 Expanding low-carbon aluminium production initiatives
- 3.6.1.3 Increasing aluminium recycling and circular economy focus
- 3.6.1.4 Growth in construction and infrastructure projects
- 3.6.1.5 Strong demand from the packaging industry
- 3.6.1.6 Advancements in aluminium processing technologies
- 3.6.1.7 Government policies supporting sustainable metal production
- 3.6.2 Industry pitfalls & challenges
- 3.6.2.1 Energy restrictions and environmental regulations
- 3.6.2.2 Volatility in raw material prices
- 3.6.2.3 Trade tensions affecting global supply chains
- 3.6.1 Growth drivers
- 3.7 Growth potential analysis
- 3.8 Porter's analysis
- 3.9 PESTEL analysis
Chapter 4 Competitive Landscape, 2024
- 4.1 Introduction
- 4.2 Company market share analysis
- 4.3 Competitive positioning matrix
- 4.4 Strategic outlook matrix
Chapter 5 Market Estimates and Forecast, By Product, 2021 – 2034 (USD Billion) (Carats)
- 5.1 Key trends
- 5.2 Flat products
- 5.3 Extruded products
- 5.4 Forged products
- 5.5 Long products
- 5.6 Cast products
- 5.7 Others
Chapter 6 Market Estimates and Forecast, By Processing Method, 2021 – 2034 (USD Billion) (Carats)
- 6.1 Key trends
- 6.2 Rolling
- 6.3 Extruding
- 6.4 Drawn
- 6.5 Casting
- 6.6 Forging
Chapter 7 Market Estimates and Forecast, By Application, 2021 – 2034 (USD Billion) (Carats)
- 7.1 Key trends
- 7.2 Transport
- 7.3 Construction
- 7.4 Electrical & electronics
- 7.5 Packaging
- 7.6 Equipment & machinery
- 7.7 Consumer durables
- 7.8 Foil stock
- 7.9 Others
Chapter 8 Market Estimates and Forecast, By Region, 2021 – 2034 (USD Billion) (Carats)
- 8.1 Key trends
- 8.2 North America
- 8.2.1 U.S.
- 8.2.2 Canada
- 8.3 Europe
- 8.3.1 Germany
- 8.3.2 UK
- 8.3.3 France
- 8.3.4 Spain
- 8.3.5 Italy
- 8.3.6 Russia
- 8.4 Asia Pacific
- 8.4.1 China
- 8.4.2 India
- 8.4.3 Japan
- 8.4.4 Australia
- 8.4.5 South Korea
- 8.5 Latin America
- 8.5.1 Brazil
- 8.5.2 Mexico
- 8.6 Middle East and Africa
- 8.6.1 Saudi Arabia
- 8.6.2 South Africa
- 8.6.3 UAE
Chapter 9 Company Profiles
- 9.1 Alcoa
- 9.2 Aleris Rolled Products
- 9.3 Arconic
- 9.4 Emirates Global Aluminum
- 9.5 Hangzhou Century Aluminium
- 9.6 Hindalco
- 9.7 Hongqiao Group
- 9.8 JW Aluminium
- 9.9 Logan Aluminium
- 9.10 Norsk Hydro
- 9.11 Novelis
- 9.12 Rio Tinto
- 9.13 Rusal
- 9.14 Shandong Xinfa Aluminium Group
- 9.15 South32
- 9.16 SPIC
- 9.17 Vedanta Limited

