
PUBLISHER: Global Market Insights Inc. | PRODUCT CODE: 1936579

PUBLISHER: Global Market Insights Inc. | PRODUCT CODE: 1936579
North America Residential Heat Pump Market Opportunity, Growth Drivers, Industry Trend Analysis, and Forecast 2026 - 2035
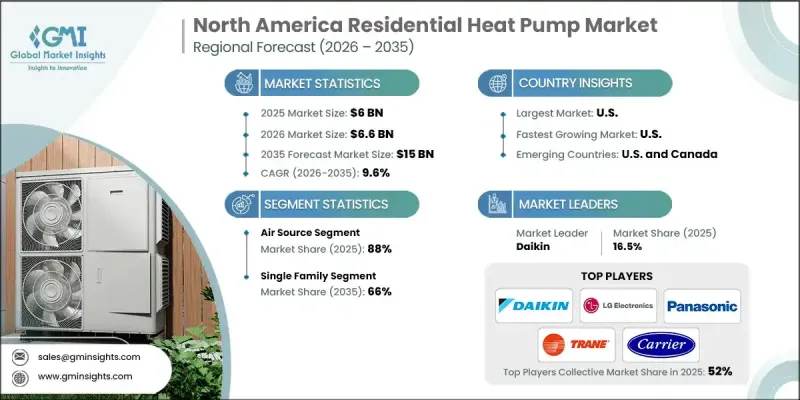
North America Residential Heat Pump Market was valued at USD 6 billion in 2025 and is estimated to grow at a CAGR of 9.6% to reach USD 15 billion by 2035.
Rising consumer demand for energy-efficient heating, cooling, and hot water solutions across homes, coupled with supportive government initiatives, is driving market growth. Regulatory efforts focused on reducing emissions, phasing out traditional heating systems like furnaces and boilers, and promoting low-carbon alternatives are further accelerating adoption. Financial incentives, including tax credits, rebates, and grants, are encouraging households to invest in modern heat pump systems. Growth in residential infrastructure projects and advances in technology, such as integration with renewable energy sources, are positively shaping the market. Increasing environmental awareness and cost-efficiency, combined with smart control features, artificial intelligence integration, and monitoring capabilities, make heat pumps a preferred choice for modern residential buildings. Continuous innovations in IoT-enabled systems and compliance with energy-efficiency and zero-emission standards further enhance adoption, offering reliable performance, reduced operating costs, and improved energy savings for homeowners.
| Market Scope | |
|---|---|
| Start Year | 2025 |
| Forecast Year | 2026-2035 |
| Start Value | $6 Billion |
| Forecast Value | $15 Billion |
| CAGR | 9.6% |
The air source segment held 88% share in 2025 and is expected to grow at a CAGR of 10% through 2035. Air source heat pumps are gaining traction due to their ability to provide heating, cooling, and hot water across varying climates, combined with easy installation and dual functionality. Financial incentives and clean energy promotion programs are further boosting adoption in residential sectors.
The single-family homes segment accounted for 66% share in 2025 and is projected to grow at a CAGR of 9.5% through 2035. Rising urbanization, rapid development of housing infrastructure, favorable regulatory initiatives, and financial rebates are driving growth. Increasing awareness of heat pumps' efficiency and versatility for both heating and cooling applications is further supporting market expansion.
U.S. Residential Heat Pump Market held 96.1% share, generating USD 5.8 billion in 2025. Efforts to reduce reliance on fossil fuels, stringent energy-efficiency regulations for buildings, and ongoing technological innovations in optimized designs, eco-friendly refrigerants, and intelligent control systems are fueling adoption. Collaborative efforts to improve system performance, reliability, and integration with smart home infrastructure are shaping the regional market landscape.
Key players operating in the North America Residential Heat Pump Market include Lennox International Inc., Bosch Thermotechnology Corp., Carrier, Panasonic Corporation of North America, Johnson Controls, Daikin, Trane, WaterFurnace, LG Electronics USA Inc., Midea, Frigidaire HVAC, American Standard Heating, Bard HVAC, Arctic Heat Pumps, Blue Star Limited, ClimateMaster, Inc, FUJITSU GENERAL, Nordic Heat Pumps, Samsung HVAC, and Rheem Manufacturing Company. Companies in the North America residential heat pump market are strengthening their market foothold through continuous product innovation, integration of smart controls, and AI-enabled monitoring systems. Many are focusing on energy efficiency and compliance with regulatory standards to appeal to environmentally conscious consumers. Strategic partnerships with residential construction firms and HVAC distributors help broaden market access. Offering installation services, after-sales support, and customizable solutions enhances customer satisfaction. Firms are also leveraging government incentives, financing options, and marketing programs to expand adoption.
Table of Contents
Chapter 1 Methodology & Scope
- 1.1 Research approach
- 1.2 Quality commitments
- 1.2.1 GMI AI policy & data integrity commitment
- 1.2.1.1 Source consistency protocol
- 1.2.1 GMI AI policy & data integrity commitment
- 1.3 Research trail & confidence scoring
- 1.3.1 Research trail components
- 1.3.2 Scoring components
- 1.4 Data collection
- 1.4.1 Partial list of primary sources
- 1.5 Data mining sources
- 1.5.1 Paid sources
- 1.5.1.1 Sources, by region
- 1.5.1 Paid sources
- 1.6 Base estimates and calculations
- 1.6.1 Base year calculation for any one approach
- 1.7 Market estimates & forecasts parameters
- 1.8 Forecast model
- 1.8.1 Quantified market impact analysis
- 1.8.1.1 Mathematical impact of growth parameters on forecast
- 1.8.1 Quantified market impact analysis
- 1.9 Research transparency addendum
- 1.9.1 Source attribution framework
- 1.9.2 Quality assurance metrics
- 1.9.3 Our commitment to trust
- 1.10 Market definitions
Chapter 2 Executive Summary
- 2.1 Industry synopsis, 2022 - 2035
- 2.2 Business trends
- 2.3 Product trends
- 2.4 Application trends
- 2.5 Country trends
Chapter 3 Industry Insights
- 3.1 Industry ecosystem analysis
- 3.1.1 Raw material availability & sourcing analysis
- 3.1.2 Key factors affecting the value chain
- 3.1.3 Disruptions
- 3.2 Regulatory landscape
- 3.3 Industry impact forces
- 3.3.1 Growth drivers
- 3.3.2 Industry pitfalls & challenges
- 3.4 Growth potential analysis
- 3.5 Porter's analysis
- 3.5.1 Bargaining power of suppliers
- 3.5.2 Bargaining power of buyers
- 3.5.3 Threat of new entrants
- 3.5.4 Threat of substitutes
- 3.6 PESTEL analysis
- 3.6.1 Political factors
- 3.6.2 Economic factors
- 3.6.3 Social factors
- 3.6.4 Technological factors
- 3.6.5 Legal factors
- 3.6.6 Environmental factors
- 3.7 Cost structure analysis of residential heat pump
- 3.8 Price trend analysis (USD/Unit)
- 3.8.1 By product
- 3.8.2 By country
- 3.9 Emerging opportunities & trends
- 3.9.1 Digital transformation with IoT technologies
- 3.9.2 Emerging market penetration
- 3.10 Investment analysis & future outlook
Chapter 4 Competitive Landscape, 2025
- 4.1 Introduction
- 4.2 Company market share analysis, by country, 2025
- 4.2.1 U.S.
- 4.2.2 Canada
- 4.3 Strategic initiatives
- 4.3.1 Key partnerships & collaborations
- 4.3.2 Major M&A activities
- 4.3.3 Product innovations & launches
- 4.3.4 Market expansion strategies
- 4.4 Competitive benchmarking
- 4.5 Strategic dashboard
- 4.6 Innovation & sustainability landscape
Chapter 5 Market Size and Forecast, By Product, 2022 - 2035 (‘000 Units & USD Million)
- 5.1 Key trends
- 5.2 Air source
- 5.3 Ground source
- 5.4 Water source
Chapter 6 Market Size and Forecast, By Application, 2022 - 2035 (‘000 Units & USD Million)
- 6.1 Key trends
- 6.2 Single family
- 6.3 Multi family
Chapter 7 Market Size and Forecast, By Country, 2022 - 2035 (‘000 Units & USD Million)
- 7.1 Key trends
- 7.2 U.S.
- 7.3 Canada
Chapter 8 Company Profiles
- 8.1 American Standard Heating
- 8.2 Arctic Heat Pumps
- 8.3 Bard HVAC
- 8.4 Blue Star Limited
- 8.5 Bosch Thermotechnology Corp.
- 8.6 Carrier
- 8.7 ClimateMaster, Inc.
- 8.8 Daikin
- 8.9 Frigidaire HVAC
- 8.10 FUJITSU GENERAL
- 8.11 Johnson Controls
- 8.12 Lennox International Inc.
- 8.13 LG Electronics USA Inc.
- 8.14 Midea
- 8.15 Nordic Heat Pumps
- 8.16 Panasonic Corporation of North America
- 8.17 Rheem Manufacturing Company
- 8.18 Samsung HVAC
- 8.19 Trane
- 8.20 WaterFurnace

