
PUBLISHER: Global Market Insights Inc. | PRODUCT CODE: 1833644

PUBLISHER: Global Market Insights Inc. | PRODUCT CODE: 1833644
Set-Top Box Market Opportunity, Growth Drivers, Industry Trend Analysis, and Forecast 2025 - 2034
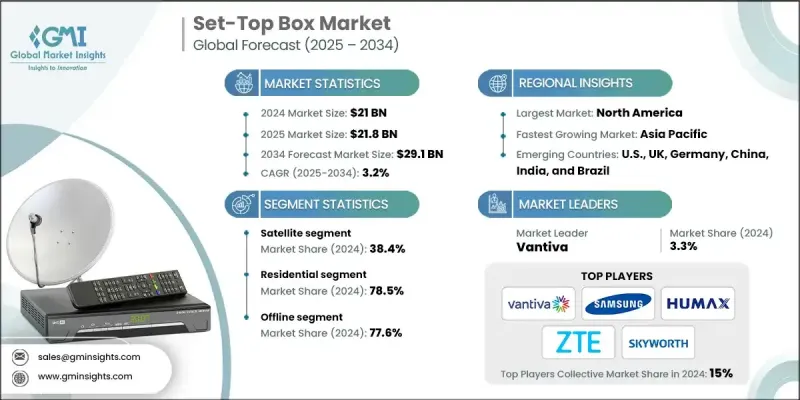
The global set-top box market was estimated at USD 21 billion in 2024 and is expected to grow from USD 21.8 billion in 2025 to USD 29.1 billion by 2034, at a CAGR of 3.2%, according to the latest report published by Global Market Insights Inc.
As consumer expectations for video quality increase, there's strong demand for set-top boxes that support HD, 4K, and even 8K resolution. Broadcasters and content providers are pushing upgrades to enhance viewing experiences, driving STB adoption.
| Market Scope | |
|---|---|
| Start Year | 2024 |
| Forecast Year | 2025-2034 |
| Start Value | $21 Billion |
| Forecast Value | $29.1 Billion |
| CAGR | 3.2% |
Satellite Segment
The satellite segment generated a significant share in 2024. These STBs are essential for delivering high-quality digital content to remote or underserved areas, offering a reliable alternative to traditional broadcasting. With advancements in compression technology and signal strength, satellite STBs now support HD and 4K content, enhancing the overall viewing experience.
Residential Segment
The residential segment held a sizeable share in 2024, fueled by households seeking access to diverse content, high-definition broadcasts, and seamless integration with home entertainment systems. Despite the rise of smart TVs and streaming platforms, many consumers still prefer STBs for live TV, DVR capabilities, and access to regional or premium content.
Rising Demand in Offline
The offline segment held a significant share in 2024. Many consumers still prefer in-person purchasing electronics, especially when technical setup assistance or after-sales support is a priority. Retailers often bundle STBs with promotional offers or installation services, adding value for buyers who may not be as tech-savvy. In response, manufacturers are investing in point-of-sale marketing, staff training programs, and in-store demos to enhance visibility and boost conversion rates. Maintaining a strong offline presence ensures that brands remain accessible in local markets where e-commerce penetration may be limited.
North America to Emerge as a Lucrative Region
North America set-top box market held a sizeable share in 2024, characterized by high household media consumption and intense competition from streaming technologies. While cord-cutting has reduced demand for traditional cable boxes, there's growing interest in hybrid STBs that combine over-the-air broadcast, on-demand streaming, and smart home integration. The market is also seeing upgrades to support 4K and voice-enabled remotes, reflecting changing consumer expectations.
Major players in the set-top box market are Skyworth, Humax, Apple, ZTE, Intek Digital, Samsung, Dish Network, Sagemcom, Huawei, Vestel, ARRIS, Kaon Media, EchoStar, Technicolor (Vantiva), and CommScope.
Leading players in the set-top box market are adopting a multi-layered approach to strengthen their market position. Key strategies include developing hybrid and Android-based STBs that bridge traditional TV and streaming, offering consumers a more versatile viewing experience. Companies are also prioritizing software updates, intuitive UIs, and integration with smart assistants to increase product stickiness. Strategic alliances with content providers and telecom operators help streamline distribution and expand user bases. Moreover, firms are embracing sustainability by designing energy-efficient hardware and recyclable packaging to align with eco-conscious consumer trends.
Table of Contents
Chapter 1 Methodology and Scope
- 1.1 Market scope and definition
- 1.2 Research design
- 1.2.1 Research approach
- 1.2.2 Data collection methods
- 1.3 Data mining sources
- 1.3.1 Global
- 1.3.2 Regional/country
- 1.4 Base estimates and calculations
- 1.4.1 Base year calculation
- 1.4.2 Key trends for market estimation
- 1.5 Primary research and validation
- 1.5.1 Primary sources
- 1.6 Forecast model
- 1.7 Research assumptions and limitations
Chapter 2 Executive Summary
- 2.1 Industry 360° synopsis
- 2.2 Key market trends
- 2.2.1 Regional
- 2.2.2 Product type
- 2.2.3 Recording
- 2.2.4 Technology
- 2.2.5 Service type
- 2.2.6 Speed
- 2.2.7 Application
- 2.2.8 End Use
- 2.2.9 Distribution channel
- 2.3 CXO perspectives: strategic imperatives
- 2.3.1 Key decision points for industry executives
- 2.3.2 Critical success factors for market players
- 2.4 Future outlook and strategic recommendations
Chapter 3 Industry Insights
- 3.1 Industry ecosystem analysis
- 3.1.1 Supplier landscape
- 3.1.2 Profit margin
- 3.1.3 Value addition at each stage
- 3.1.4 Factor affecting the value chain
- 3.2 Industry impact forces
- 3.2.1 Growth drivers
- 3.2.1.1 Growing demand for home entertainment and streaming services
- 3.2.1.2 Technological advancements
- 3.2.1.3 Increasing internet penetration and smart TV integration
- 3.2.2 Industry pitfalls & challenges
- 3.2.2.1 Price sensitivity and commoditization
- 3.2.2.2 Dependency on content providers and regional licensing
- 3.2.3 Opportunities
- 3.2.3.1 Integration with OTT platforms and app ecosystems
- 3.2.3.2 Smart home and IoT integration
- 3.2.1 Growth drivers
- 3.3 Growth potential analysis
- 3.4 Future market trends
- 3.5 Technology and Innovation landscape
- 3.5.1 Current technological trends
- 3.5.2 Emerging technologies
- 3.6 Price trends
- 3.6.1 By region
- 3.6.2 By product type
- 3.7 Regulatory framework
- 3.7.1 standards and compliance requirements
- 3.7.2 Regional regulatory frameworks
- 3.7.3 Certification standards
- 3.8 Trade statistics (HS code: 85287100)
- 3.8.1 Major importing countries
- 3.8.2 Major exporting countries
- 3.9 Porter's five forces analysis
- 3.10 PESTEL analysis
- 3.11 Consumer behaviour analysis
- 3.11.1 Purchasing patterns
- 3.11.2 Preference analysis
- 3.11.3 Regional variations in consumer behaviour
- 3.11.4 Impact of e-commerce on buying decisions
Chapter 4 Competitive Landscape, 2024
- 4.1 Introduction
- 4.2 Company market share analysis
- 4.2.1 By region
- 4.2.1.1 North America
- 4.2.1.2 Europe
- 4.2.1.3 Asia Pacific
- 4.2.1.4 Latin America
- 4.2.1.5 MEA
- 4.2.1 By region
- 4.3 Company matrix analysis
- 4.4 Competitive analysis of major market players
- 4.5 Competitive positioning matrix
- 4.6 Key developments
- 4.6.1 Mergers & acquisitions
- 4.6.2 Partnerships & collaborations
- 4.6.3 New product launches
- 4.6.4 Expansion plans
Chapter 5 Set-Top Box Market Estimates & Forecast, By Product Type, 2021-2034 (USD Billion) (Thousand Units)
- 5.1 Key trends
- 5.2 Cable
- 5.3 Satellite STB
- 5.4 IPTV/OTT
- 5.5 Hybrid
- 5.6 Others
Chapter 6 Set-Top Box Market Estimates & Forecast, By Recording, 2021-2034 (USD Billion) (Thousand Units)
- 6.1 Key trends
- 6.2 Standard definition
- 6.3 High definition
- 6.4 UHD
- 6.5 4K & above
Chapter 7 Set-Top Box Market Estimates & Forecast, By Technology, 2021-2034 (USD Billion) (Thousand Units)
- 7.1 Key trends
- 7.2 DVB-C
- 7.3 DVB-S
- 7.4 DVB-T
- 7.5 Hybrid
- 7.6 MPEG-2
- 7.7 MPEG-4
- 7.8 Android
- 7.9 USB storage
- 7.10 Others
Chapter 8 Set-Top Box Market Estimates & Forecast, By Service Type, 2021-2034 (USD Billion) (Thousand Units)
- 8.1 Key trends
- 8.2 Pay TV
- 8.3 Free to air
Chapter 9 Set-Top Box Market Estimates & Forecast, By Speed, 2021-2034 (USD Billion) (Thousand Units)
- 9.1 Key trends
- 9.2 Below 100 Mbps
- 9.3 100 Mbps to 500 Mbps
- 9.4 Above 500 Mbps
- 9.5 Gigabit Speed (1 Gbps and above)
Chapter 10 Set-Top Box Market Estimates & Forecast, By Application, 2021-2034 (USD Billion) (Thousand Units)
- 10.1 Key trends
- 10.2 Communication
- 10.3 Media content
- 10.4 Audio/video
- 10.5 Gaming
- 10.6 Web content
- 10.7 Cloud services
- 10.8 Others
Chapter 11 Set-Top Box Market Estimates & Forecast, By End Use, 2021-2034 (USD Billion) (Thousand Units)
- 11.1 Key trends
- 11.2 Residential
- 11.3 Commercial
Chapter 12 Set-Top Box Market Estimates & Forecast, By Distribution Channel, 2021-2034 (USD Billion) (Thousand Units)
- 12.1 Key trends
- 12.2 Online
- 12.2.1 Company website
- 12.2.2 E-commerce
- 12.3 Offline
- 12.3.1 Specialty stores
- 12.3.2 Hypermarket/supermarket
- 12.3.3 Retail stores
- 12.3.4 Others
Chapter 13 Set-Top Box Market Estimates & Forecast, By Region, 2021-2034 (USD Billion) (Thousand Units)
- 13.1 Key trends
- 13.2 North America
- 13.2.1 U.S.
- 13.2.2 Canada
- 13.3 Europe
- 13.3.1 Germany
- 13.3.2 UK
- 13.3.3 France
- 13.3.4 Italy
- 13.3.5 Spain
- 13.4 Asia Pacific
- 13.4.1 China
- 13.4.2 India
- 13.4.3 Japan
- 13.4.4 South Korea
- 13.4.5 Australia
- 13.5 Latin America
- 13.5.1 Brazil
- 13.5.2 Mexico
- 13.5.3 Argentina
- 13.6 MEA
- 13.6.1 South Africa
- 13.6.2 Saudi Arabia
- 13.6.3 UAE
Chapter 14 Company Profiles
- 14.1 Apple
- 14.2 ARRIS
- 14.3 CommScope
- 14.4 Dish Network
- 14.5 EchoStar
- 14.6 Huawei
- 14.7 Humax
- 14.8 Intek Digital
- 14.9 Kaon Media
- 14.10 Sagemcom
- 14.11 Samsung
- 14.12 Skyworth
- 14.13 Technicolor (Vantiva)
- 14.14 Vestel
- 14.15 ZTE

