
PUBLISHER: Global Market Insights Inc. | PRODUCT CODE: 1666941

PUBLISHER: Global Market Insights Inc. | PRODUCT CODE: 1666941
Photo Booth Market Opportunity, Growth Drivers, Industry Trend Analysis, and Forecast 2025 - 2034
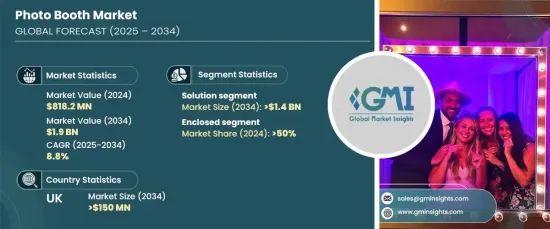
The Global Photo Booth Market was valued at USD 818.2 million in 2024 and is expected to grow at a CAGR of 8.8% from 2025 to 2034. One of the key drivers behind this growth is the increasing demand for interactive and customized experiences at events. People are looking for unique and fun ways to capture memories at weddings, parties, corporate events, and more. Photo booths, with their ability to offer personalized backdrops, props, and instant photo printouts, are becoming a popular feature at these events.
Social media also plays a significant role in driving this demand. Guests love to instantly share their photos and videos on platforms like Instagram and Facebook, which adds excitement to the event and creates buzz around it. The combination of customization and social media sharing has made photo booths a must-have for event organizers, further boosting the market's growth.
| Market Scope | |
|---|---|
| Start Year | 2024 |
| Forecast Year | 2025-2034 |
| Start Value | $818.2 Million |
| Forecast Value | $1.9 Billion |
| CAGR | 8.8% |
The increasing desire for immediate photo sharing is another important factor. Attendees at events want to capture and instantly share their memories with friends and followers online. With features like instant printing and digital sharing capabilities, photo booths perfectly meet this demand. This integration with social media not only enhances the event experience but also ensures that the popularity of photo booths continues to grow as more people look to capture and share moments quickly.
In terms of market segments, the photo booth industry is divided into solutions and services. The solution segment dominated in 2024, accounting for over 75% of the market share, and is expected to exceed USD 1.4 billion by 2034. This segment thrives due to its all-encompassing offerings, which include both hardware and software tailored to meet consumer needs. Solutions that offer customizable features, like digital sharing and instant prints, greatly enhance user experience. Moreover, integrated software helps manage and customize the booths, making them easier to operate at events.
The market is also divided by type, with two main categories: open and enclosed photo booths. The enclosed booth segment holds more than 50% of the market share. These booths are more popular due to their enhanced privacy and comfort features, which make users feel more at ease when taking photos. They offer a more personal experience, which is particularly appealing at events where guests want privacy and high-quality photos. Additionally, their compact and portable design allows them to be easily transported and set up at various event locations.
The photo booth market in the U.K. accounted for 20% of the global market share in 2024 and is expected to exceed USD 150 million by 2034. The demand for photo booths in the U.K. is driven by the country's strong event culture, with a particular focus on weddings, corporate functions, and parties. The country's advancements in technology, strong infrastructure, and social media trends also contribute to the growing popularity of photo booths.
Table of Contents
Chapter 1 Methodology & Scope
- 1.1 Research design
- 1.1.1 Research approach
- 1.1.2 Data collection methods
- 1.2 Base estimates and calculations
- 1.2.1 Base year calculation
- 1.2.2 Key trends for market estimates
- 1.3 Forecast model
- 1.4 Primary research & validation
- 1.4.1 Primary sources
- 1.4.2 Data mining sources
- 1.5 Market definitions
Chapter 2 Executive Summary
- 2.1 Industry 3600 synopsis, 2021 - 2034
Chapter 3 Industry Insights
- 3.1 Industry ecosystem analysis
- 3.2 Supplier landscape
- 3.2.1 Photo booth component manufacturers
- 3.2.2 Aftermarket providers
- 3.2.3 Distributors
- 3.2.4 End use
- 3.3 Profit margin analysis
- 3.4 Pricing analysis
- 3.5 Patent Landscape
- 3.6 Cost Breakdown
- 3.7 Technology & innovation landscape
- 3.8 Key news & initiatives
- 3.9 Regulatory landscape
- 3.10 Impact forces
- 3.10.1 Growth drivers
- 3.10.1.1 Growing demand for interactive and personalized event experiences
- 3.10.1.2 Increasing popularity of social media and the desire for instant sharing of photos
- 3.10.1.3 Technological advancements, such as high-quality cameras and customizable features
- 3.10.1.4 Rising popularity of photo booths in weddings, parties, corporate events, and marketing campaigns
- 3.10.2 Industry pitfalls & challenges
- 3.10.2.1 High initial investment costs for setting up and maintaining photobooth equipment
- 3.10.2.2 Intense competition in the market, making it difficult for new entrants to establish themselves
- 3.10.1 Growth drivers
- 3.11 Growth potential analysis
- 3.12 Porter’s analysis
- 3.13 PESTEL analysis
Chapter 4 Competitive Landscape, 2024
- 4.1 Introduction
- 4.2 Company market share analysis
- 4.3 Competitive positioning matrix
- 4.4 Strategic outlook matrix
Chapter 5 Market Estimates & Forecast, By Component, 2021 - 2034 ($Bn)
- 5.1 Key trends
- 5.2 Solution
- 5.3 Service
Chapter 6 Market Estimates & Forecast, By Type, 2021 - 2034 ($Bn)
- 6.1 Key trends
- 6.2 Open
- 6.2.1 Mirror photo booth
- 6.2.2 Green screen photo booth
- 6.2.3 360 photobooth
- 6.3 Enclosed
- 6.3.1 Inflatable photo booth
- 6.3.2 Passport photo booth
Chapter 7 Market Estimates & Forecast, By Mode of Operation, 2021 - 2034 ($Bn)
- 7.1 Key trends
- 7.2 Fixed
- 7.3 Mobile/Rental
Chapter 8 Market Estimates & Forecast, By Application, 2021 - 2032 ($Bn)
- 8.1 Key trends
- 8.2 Document photo
- 8.3 Entertainment
- 8.3.1 Amusement parks
- 8.3.2 Shopping centers
- 8.3.3 Retail outlets
- 8.3.4 Events
- 8.3.5 Others
Chapter 9 Market Estimates & Forecast, By Region, 2021 - 2034 ($Bn)
- 9.1 Key trends
- 9.2 North America
- 9.2.1 U.S.
- 9.2.2 Canada
- 9.3 Europe
- 9.3.1 UK
- 9.3.2 Germany
- 9.3.3 France
- 9.3.4 Spain
- 9.3.5 Italy
- 9.3.6 Russia
- 9.3.7 Nordics
- 9.4 Asia Pacific
- 9.4.1 China
- 9.4.2 India
- 9.4.3 Japan
- 9.4.4 South Korea
- 9.4.5 ANZ
- 9.4.6 Southeast Asia
- 9.5 Latin America
- 9.5.1 Brazil
- 9.5.2 Mexico
- 9.5.3 Argentina
- 9.6 MEA
- 9.6.1 UAE
- 9.6.2 South Africa
- 9.6.3 Saudi Arabia
Chapter 10 Company Profiles
- 10.1 Breeze Systems
- 10.2 Bubbly Booths
- 10.3 Darkroom Booth
- 10.4 DEDEM
- 10.5 Face Place Photo Booths
- 10.6 Foto Master
- 10.7 Me-Group International
- 10.8 MyBooth
- 10.9 Open Air Photobooth
- 10.10 PBC Photobooths
- 10.11 Photo Booth International
- 10.12 Photobooth Supply
- 10.13 Photobooths.co.uk
- 10.14 Picture Pod
- 10.15 Pixster Photo Booths
- 10.16 Simple Booth
- 10.17 SnapShotz Photo Booths
- 10.18 Studio Foto Immagine
- 10.19 The Bosco
- 10.20 The Original Selfie Booth

