
PUBLISHER: Information Network | PRODUCT CODE: 1479762

PUBLISHER: Information Network | PRODUCT CODE: 1479762
Rare Earths Elements In High-Tech Industries: Market Analysis And Forecasts Amid China's Trade Embargo
Introduction
The report "Rare Earths Elements in High-Tech and Alternative Energy Industries: Market Analysis and Forecasts" presents a comprehensive exploration into the pivotal role of rare earth elements (REEs) within high-tech and alternative energy sectors.
Rare earth elements, a group of 17 chemically unique elements, are integral components in a wide array of cutting-edge technologies and renewable energy systems. From electric vehicles and wind turbines to smartphones and advanced medical devices, REEs play a vital role in enabling innovation and sustainability across various industries.
This report delves into the intricate dynamics of the REEs market, examining factors such as global supply chain resilience, evolving demand patterns, pricing dynamics, and geopolitical influences.
By providing in-depth insights and forecasts, the report aims to empower stakeholders with the knowledge and strategic insights necessary to navigate the complex landscape of high-tech and alternative energy industries amid challenges such as supply chain disruptions and geopolitical tensions.
High-Tech and Alternative Energy Industries Trends
The utilization of Rare Earth Elements (REEs) in high-tech and alternative energy industries is extensive, covering a wide range of applications essential for the advancement and efficiency of modern technologies and renewable energy solutions. Here's a detailed exploration:
High-Tech Industries Discussed in Report::
Electronics and Communication Devices: REEs are pivotal in manufacturing smartphones, computers, flat-screen monitors, and other electronic devices. Elements like neodymium, praseodymium, and dysprosium are used in magnets for speakers, hard drives, and small motors. Europium and terbium contribute to the vibrant displays of screens through their role in phosphors.
Advanced Optics and Lasers: Gadolinium, erbium, and ytterbium are used in optical fibers and laser technology. These elements are crucial for high-speed internet transmission and precision in medical lasers.
Defense and Aerospace: Samarium-cobalt magnets, made from samarium, are utilized in precision-guided munitions, and satellite communication systems. REEs like yttrium and terbium are used in radar systems and other defense electronics due to their unique optical and magnetic properties.
Alternative Energy Industries Discussed in Report
Wind Turbines: Neodymium, praseodymium, and dysprosium are essential for the powerful permanent magnets in the generators of wind turbines. These magnets allow the turbines to generate electricity efficiently, even at low wind speeds.

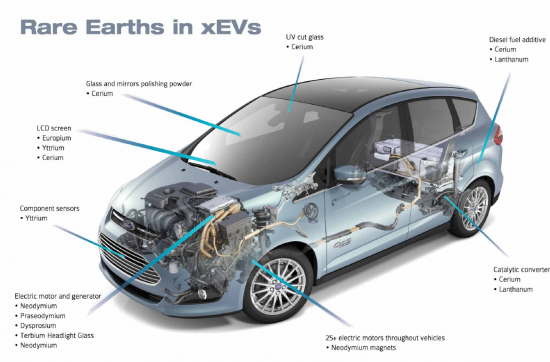
Electric Vehicles (EVs): The traction motors in electric and hybrid vehicles often use neodymium-iron-boron (NdFeB) magnets. The high performance of these magnets contributes to the efficiency and range of EVs.
Solar Panels: While REEs are not major components in photovoltaic cells, certain rare earth oxides like cerium are used for polishing the glass of solar panels. Additionally, lanthanum is used in the production of advanced batteries that store solar energy.
Energy Storage: REEs like lanthanum and cerium are used in nickel-metal hydride (NiMH) batteries, which are crucial for renewable energy storage solutions. These elements help improve the battery's capacity and longevity, essential for the stability of renewable energy sources.
Trends
The trends in Rare Earth Elements (REEs) within high-tech and alternative energy industries reflect their increasing importance as critical components in various applications.
One prominent trend is the growing demand for REEs in electric vehicles (EVs) and renewable energy technologies such as wind turbines and solar panels. As the global transition toward cleaner energy sources accelerates, the demand for REEs used in NdPr permanent magnets, catalysts, and battery technologies is expected to rise significantly.
Additionally, there is a growing emphasis on securing sustainable and diversified REE supplies to mitigate supply chain risks and reduce dependence on a few dominant producers, particularly in light of geopolitical tensions.
Another trend is the exploration of alternative sources and recycling methods to address supply constraints and environmental concerns associated with traditional REE mining and processing. Furthermore, advancements in material science and technological innovations are driving the development of more efficient and environmentally friendly processes for extracting, refining, and utilizing REEs in various applications.
Overall, the trends underscore the critical role of REEs in advancing high-tech and alternative energy industries while highlighting the need for strategic planning and collaboration to ensure a sustainable and resilient supply chain.
About This Report
Rare Earths Elements in High-Tech and Alternative Energy Industries report covers a wide range of topics related to the production, demand, market dynamics, technological advancements, and future prospects of REEs. Specifically, the report include:
Market Analysis: An overview of the global REE market, including historical trends, current market size, and growth projections, detailing market drivers, challenges, and opportunities.
Industry Trends: Exploration of key trends shaping the demand for REEs in high-tech and alternative energy sectors, such as electric vehicles, renewable energy technologies, consumer electronics, and advanced manufacturing.
Supply Chain Analysis: Examination of the REE supply chain, including major producers, mining projects, processing facilities, and distribution networks. This section also discusses geopolitical factors, trade policies, and supply chain risks affecting REE availability.
Application Segmentation: Detailed analysis of REE applications across various industries, highlighting their uses in magnets, batteries, catalysts, lighting, electronics, and other high-tech products.
Technology Innovation: Exploration of technological advancements and research initiatives aimed at improving REE extraction, processing, recycling, and substitution. This section also covers innovations in material science, manufacturing processes, and product design to enhance REE efficiency and sustainability.
Regulatory Environment: Overview of regulatory frameworks, environmental regulations, and policies impacting REE mining, production, trade, and usage. This section also addresses sustainability standards, responsible sourcing initiatives, and compliance requirements for REErelated industries.
Market Forecasts: Forecasting of future trends and growth opportunities in the REE market, including projections for demand, supply, prices, and market shares. This section provides insights into emerging technologies, market disruptions, and investment prospects in the REE sector.
Competitive Landscape: Analysis of key players in the REE industry, including mining companies, processors, manufacturers, and end-users. This section includes company profiles, market strategies, competitive positioning, and partnerships in the REE value chain. Overall, the comprehensive report aims to provide stakeholders with actionable insights, strategic recommendations, and data-driven analyses to navigate the complex landscape of REEs in high-tech and alternative energy industries.
Table of Contents
Chapter 1. Introduction
- 1.1. Rare Earth Element Characteristics
- 1.2. Rare Earth Element Resources
- 1.3. Overview of Rare Earth Element Applications
Chapter 2. Rare Earth Industry
- 2.1. China' Rare Earth Industry
- 2.1.1. China's Production
- 2.1.2. China Rare Earth Production Structure
- 2.1.3. China Rare Earth Consumption Structure
- 2.1.4. China Export of Rare Earths
- 2.1.5. Recent Activities Of China's Rare Earth Industry
- 2.1.5.1. Consolidation Of China's Rare Earth Industry
- 2.1.5.2. Export Quotas
- 2.2. Rest Of World's Rare Earth Industry
- 2.2.1. UNITED STATES
- 2.2.1.1. Mountain Pass
- 2.2.1.2. Utah Rare Earth Project
- 2.2.1.3. Bear Lodge Rare-Earth Project
- 2.2.1.4. Elk Creek
- 2.2.1.5. Bokan-Dotson Ridge
- 2.2.1.6. Diamond Creek
- 2.2.1.7. Lemhi Pass
- 2.2.2. CANADA
- 2.2.2.1. MacLeod Lake Project
- 2.2.2.2. Hoidas Lake
- 2.2.2.3. Benjamin River Project
- 2.2.2.4. Douglas River Project
- 2.2.2.5. Nechalacho Rare Earth Element Project
- 2.2.2.6. Archie Lake
- 2.2.2.7. Bulstrode Rare Earth Property
- 2.2.2.8. Mount Copeland
- 2.2.2.9. Cross Hills Newfoundland
- 2.2.2.10. Kipawa
- 2.2.2.11. Strange Lake
- 2.2.2.12. Ytterby
- 2.2.2.13. Grevet REE
- 2.2.2.14. Turner Falls
- 2.2.3. SOUTH AFRICA
- 2.2.3.1. Steenkampskraal Mine South Africa
- 2.2.4. AUSTRALIA
- 2.2.4.1. Nolans Bore
- 2.2.4.2. Mount Weld
- 2.2.4.3. Jungle Well/ Laverton
- 2.2.5. GREENLAND
- 2.2.5.1. Kvanefjeld Project
- 2.2.6. ARGENTINA
- 2.2.6.1. Cueva del Chacho
- 2.2.6.2. Susques Property - Jujuy Province
- 2.2.6.3. John Galt Project
- 2.2.7. INDIA
- 2.2.7.1. Indian Rare Earth
- 2.2.8. RUSSIA
- 2.2.8.1. Kutessay II
- 2.2.1. UNITED STATES
- 2.3. Profiles of Mining Corporations
Chapter 3. Rare Earth Market Analysis
- 3.1. Overview
- 3.2. Rare Earth Market
- 3.2.1. Domestic Production and Consumption
- 3.2.2. China Production and Consumption
- 3.3. Global Rare Earth Market Analysis
Chapter 4. Impact on Hi-Tech Applications
- 4.1. Overview
- 4.1.1. Rare Earth Market By Application
- 4.1.2. NdPr Magnets
- 4.2. Semiconductors
- 4.2.1. Technology Impacted
- 4.2.1.1. High-k Dielectrics
- 4.2.1.2. Polishing Powders
- 4.2.2. Rare Earth Material Used
- 4.2.3. Market Forecast of Impacted Semiconductor Devices/Materials
- 4.2.1. Technology Impacted
- 4.3. Hard Disk Drives (HDDs)
- 4.3.1. Technology Impacted
- 4.3.1.1. Neo Magnets for HDDs
- 4.3.1.2. High Strength Glass Substrates
- 4.3.1.3. Polishing Materials
- 4.3.2. Rare Earth Material Used
- 4.3.3. Market Forecast of Impacted HDD Devices/Materials
- 4.3.1. Technology Impacted
- 4.4. Mobile and Mobile Internet Devices
- 4.4.1. Technology Impacted
- 4.4.2. Rare Earth Material Used
- 4.4.3. Market Forecast of Impacted Mobile Devices/Materials
- 4.5. Solid State Lighting - LED/CFL
- 4.5.1. Technology Impacted
- 4.5.1.1. Phosphors for Light Emitting Diodes (LEDs)
- 4.5.1.2. Phosphors for Compact Fluorescent Lamps (CFL)
- 4.5.2. Rare Earth Material Used
- 4.5.3. Market Forecast of Impacted LED Devices/Materials
- 4.5.1. Technology Impacted
- 4.6. Green Technology
- 4.6.1. Technology Impacted
- 4.6.1.1. Magnets for Hybrid Vehicle Electric Motors and Brakes
- 4.6.1.2. Neo Magnets for Wind Turbines
- 4.6.1.3. Cerium for Catalytic Converters for Automobiles
- 4.6.2. Rare Earth Material Used
- 4.6.3. Market Forecast of Impacted Green Devices/Materials
- 4.6.4. Other Green Technologies
- 4.6.1. Technology Impacted
Chapter 5. U.S Strategic Metal Perspective
- 5.1. The Application of Rare Earth Metals in National Defense
- 5.2. Rare Earth Resources and Production Potential
- 5.3. Supply Chain Issues
- 5.4. Rare Earth Legislation
Chapter 6. European Strategic Metal Perspective
- 6.1. Assessing Criticality
- 6.2. The 2020 EU Critical Raw Materials List
- 6.3. Current And Past Initiatives
Chapter 7. Rebuilding a U.S. Supply Chain
- 7.1. Materials Supply Chain Challenges And Opportunities
- 7.2. Impact of Price Hikes by Application
- 7.2.1. REE/REO Recycling In U.S.
- 7.2.1.1. Overall Process
- 7.2.1.2. Recycling RE Magnets
- 7.2.1.3. Recycling Phosphors
- 7.2.1.4. Company Programs
- 7.2.1. REE/REO Recycling In U.S.
TABLES
- 1.1. Selected Rare Earth Element Bearing Products
- 1.2. Rare Earths Elements And Some Of Their End Uses
- 2.1. World Mine Production and Reserves
- 2.2. Global Rare Earth Supply/Demand
- 2.3. China's Rare Earth Export Volume And Export Amount
- 2.4. Rare Earth Projects Outside China
- 3.1. U.S. Rare Earth Statistics
- 3.2. Rare Earth Prices
- 3.3. Rare Earth Elements: World Production
- 3.4. Rare Earth Oxide Demand-Supply
- 3.5. Rare Earth Composition By End Use
- 4.1. NdPr Oxide Supply Market Forecast
- 4.2. NdPr Oxide Demand Market Forecast
- 4.3. Forecast of Ceria CMP Slurry for Semiconductors
- 4.4. Market Forecast for Hard Disk Drives
- 4.5. Neodymium Consumption For Hard Disk Drives
- 4.6. Market Forecast For Ceria Slurry For Glass Disks
- 4.7. Shipment Forecast of Smartphones
- 4.8. Neodymium Consumption For Smartphones
- 4.9. Market Forecast of LEDs by Application
- 4.10. Demand of Rare Earths in LEDs
- 4.11. Shipment Forecast Of Electric Vehicles
- 4.12. Neodymium Consumption For Electric Vehicles
- 4-13. Shipment Forecast Of Internal Combustion Engine Vehicles
- 4-14. Ceria Consumption For Catalytic Converters
- 4-15. Shipment Forecast Of Wind Turbines
- 4-16. Neodymium Consumption For Wind Turbines
- 5.1. Rare Earth Elements: World Production And Reserves
- 7.1. NdFeB Permanent Magnet Supply Chain Steps
FIGURES
- 1.1. Periodic Table Of Rare Earth Elements
- 1.2. Abundance Of The Rare Earth Elements
- 1.3. Rare Earth Production Since 1950
- 1.4. China's Rare Earth Dominance
- 2.1. Rare Earth Proportion And Distribution In China
- 2.2. Production Of Rare Earth Concentrates Since 1987
- 2.3. Production Of Rare Earth Oxides Since 1994
- 2.4. China Mining Quota By Company
- 2.5. China Rare Earth Oxide Exports By Destination
- 2.6. China Rare Earth Metal Exports By Destination
- 2.7. China's Rare-Earth Exports
- 3.1. U.S. Distribution Of Refined Rare Earth Products
- 3.2. Rare-Earth Price Index
- 3.3. Comparison Of Rare Earth Consumption Between China And The World
- 3.4. Global Supply-Demand Forecast
- 3.5. REE Demand By Volume
- 3.6. REE Demand By Value
- 3.7. REE Applications Global
- 3.8. REE Applications U.S.
- 3.9. REE Composition By End Use
- 3.10. Approximate % Content Of Current And Prospective Ores
- 4.1. Application Market Share by Volume
- 4.2. High-Performance Magnet Share by Application
- 4.3. High-Performance Magnet Share by Application - 2030
- 4.4. Illustration of MOSFET and Gate Oxide
- 4.5. STI CMP Using Ceria
- 4.6. Hafnium Demand for Semiconductors
- 4.7. HDD Drive and Neo Magnets
- 4.8. REE Usage in Phosphors
- 4.9. Scattered Photon Extraction white LED
- 4.10. Supply Chain for Fluorescent Lighting
- 4.11. EV Rare Earths Applications
- 4.12. Wind Turbine Motor
- 4.13. Supply Chain for Permanent Magnets
- 4.14. Catalytic Converter for Automobiles
- 5.1. Global Rare Earth Reserves
- 6.1. Supply Of Strategic Metals To The European Union

