
PUBLISHER: Information Network | PRODUCT CODE: 1473279

PUBLISHER: Information Network | PRODUCT CODE: 1473279
Global Semiconductor Equipment: Markets, Market Shares and Market Forecasts
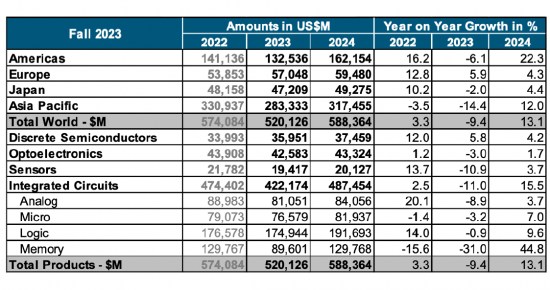
The Semiconductor Industry Association (SIA) announced global semiconductor industry sales totaled $526.8 billion in 2023, a decrease of 8.2% compared to the 2022 total of $574.1 billion, which was the industry's highest-ever annual total. Sales picked up during the second half of 2023. In fact, fourth-quarter sales of $146.0 billion were 11.6% more than the total from the fourth quarter of 2022 and 8.4% higher than the total from third quarter of 2023. And global sales for the month of December 2023 were $48.6 billion, an increase of 1.5% compared to November 2023 total. Monthly sales are compiled by the World Semiconductor Trade Statistics (WSTS) organization and represent a three-month moving average. SIA represents 99% of the U.S. semiconductor industry by revenue and nearly two-thirds of non-U.S. chip firms.
On a regional basis, Europe was the only regional market that experienced annual growth in 2023, with sales there increasing 4.0%. Annual sales into all other regional markets decreased in 2023: Japan (-3.1%), the Americas (-5.2%), Asia- Pacific/All Other (-10.1%), and China (-14.0%). Sales for the month of December 2023 increased compared to November 2023 in China (4.7%), the Americas (1.8%), and Asia Pacific/All Other (0.3%), but decreased in Japan (-2.4%) and Europe (-3.9%).
Several semiconductor product segments stood out in 2023. Sales of logic products totaled $178.5 billion in 2023, making it the largest product category by sales. Memory products were second in terms of sales, totaling $92.3 billion. Microcontroller units (MCUs) grew by 11.4% to a total of $27.9 billion. And sales of automotive ICs grew by 23.7% year-over-year to a record total of $42.2 billion.
Global economic slowdowns and capes overspend were catalysts for producing an oversupply of semiconductors and an equipment meltdown in 2023. A significant capacity expansion is underway as current fabs expand and new fabs are planned.
A push by the Biden administration to invest $50 billion on domestic manufacturing facilities to improve US self-sufficiency and reduce reliance on Asia has initiated a course that will likely result in oversupply and capacity expansion:
Intel
- Arizona - Fab 42 expansion for 7nm capacity
- Oregon - Fab D1X $3B Mod3 expansion; tools installed Aug. '21 to Feb. '22
- New Mexico - $3.5B spend for advanced packaging
- Israel - $10B 7nm fab; 2023 production
- Ireland - spent additional $7B from 2019-2021 to expand to 7nm
- Arizona Foundry $20B for 2 fabs (~35k wspm each) starting production in 2023 and 2024
- Malaysia - $7B for advanced packaging fab expansion; 2024 production
TSMC
- Fab 18 - 3nm $20B fab expected to be completed in 2023
- Arizona Fab -$12B over time; 5nm initial phase to produce 20k wspm starting in 1Q24 with equipment installation commencing in 2H2022
- Japan 22 / 28nm fab with Sony; $7B 45k wspm targeting late 2024 production
- 7/6nm & 28nm fab in Kaohsiung, Taiwan for 2024 production for a reported $10B; phase 1 = 40k wspm for 7nm and 6nm with phase 2 for 28nm
Samsung
- Pyeongtaek line 3 (P3) equipment move-in expected to start in April 2022; rst 40-50k wspm 176L 3D NAND line, 130k-140k wspm DRAM and 10k-20k wspm 5nm foundry lines in 2H2022
- Pyeongtaek P2 S5-1; 3nm 60k wspm in 2021 & ramp to 120k wspm in 2022
- Pyeongtaek P2 S5-2; 3nm 60k wspm targeted production in 2024
- U.S. $17B 5nm Foundry fab in Texas; expected 2H2024 production (120k wspm est.)
GlobalFoundries
- $4 billion Singapore Module 7H 38k wspm starting wafer production in early-2023; full ramp end of 2023
- $1B Malta New York fab expansion of 12,500 wspm; additional fab to double capacity
- Spending $1.4B to expand capacity in U.S., Singapore, and Germany
SMIC
- 100k wspm 28nm & above fab for $8.87B in Shanghai; timing unknown
- 40k wspm 28nm & above fab in Shenzhen for $2.35B; production starting 2022
UMC
- Fab 12A Phase 6 (P6) $3.5B plan for expansion; scheduled for production in 2Q23
Kioxia / Western Digital
- Fab 7 in Mie Prefecture, Japan; expected production in late 2022 / early 2023
- Kitakami (K2) fab at $18.4B expected completion in early 2023; use of Yokkaichi equip.?
Micron
- DRAM - $7B fab in Japan expected to commence production in 2024
SK Hynix
- $106B fab complex with 800k wspm capacity and 200k EUV - rst fab completed in 2025 Nanya
- DRAM - $10.7B 10nm 110k wspm fab expected to be completed in 2023; production in 2024
Powerchip Semi (PSMC)
- $10B 12-inch fab in the Tongluo Science Park; 100k wspm of 1x to 50nm technology will be put into production in stages beginning in 2023
Texas Instruments
- RFAB2 - $850M fab coming online in 2H2022 with equipment over next few years
- LFAB (acquired from Micron) - spend $3B of capex over time with target of coming online in early-2023 - more details in February at capital management call
- North Texas Fab site (option for up to 4 fabs over time) - 1st & 2nd fab construction commencing in 2022 with First fab targeting production in 2025 (70k wspm estimated)
Wafer Front End equipment spend between 2020 and 2024 by device end product is shown below:

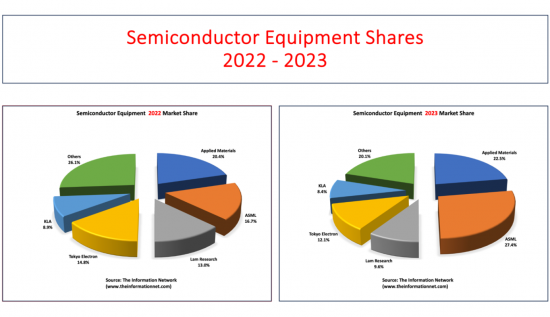
In Figure 1.1 below, we show market shares for the global WFE equipment market for 2022 and 2023, listing shares for the Top 5 global equipment companies and the other equipment companies in the market.
Report Coverage
This 325-page report analyzes and forecasts the semiconductor market for 24 different equipment types, including market shares for 2023 by type:
AMHS (Automated Material Handling Systems) Market
CMP (Chemical Mechanical Planarization) Market
Clean Market
- Plasma Strip
- Spray Processors
- Wet Stations
Deposition Market
- ALD
- Epitaxy
- MOCVD
- LPCVD (non-tube)
- LPCVD (tube)
- PECVD
- PVD
Ion Implantation Market
Lithography Market
- Direct-Write E-Beam Lithography
- Mask-Making Lithography
- Steppers
Oxidation/Diffusion Market
Photoresist Processing (Track) Market
RTP Market
Plasma Etch Market
- Dielectric
- Conductor
Process Control Market
- Lithography Metrology
- Thin-Film Metrology
- Wafer Inspection and Defect Review
The report in pdf format profiles 6 U.S., 11 European, and 26 Asian equipment companies.
An Excel File accompanies the report and covers Market Shares of each company by each equipment type between 2012 and 2023.
Driving forces of technology and geopolitics are analyzed and forecast by semiconductor type including China markets.
Table of Contents
Chapter 1. Introduction
Chapter 2. Semiconductor Industry Driving Forces
- 2.1. Introduction
- 2.2. Foundries
- 2.2.1. Foundry Capex Trends
- 2.2.2. Foundry Revenue Growth
- 2.2.3. Foundry Market Share
- 2.2.4. Revenue Growth by Foundry
- 2.2.5. Global Foundry / Logic Lithography Demand
- 2.2.6. Global Foundry Equipment Demand By Type
- 2.2.7. TSMC Wafer Price By Node
- 2.2.8. Foundry Technology Linewidth Roadmap
- 2.2.9. Capacity trend by linewidth
- 2.2.10. Capacity ratio by region
- 2.3. DRAM
- 2.3.1. Present and Future Capacity of DRAM by Manufacturer
- 2.3.2. DRAM Revenue Demand Forecast By Application
- 2.3.3. DRAM Market Shares
- 2.3.4. DRAM Capex
- 2.4. NAND
- 2.4.1. NAND Revenue Demand Forecast By Applications
- 2.4.2. NAND Market Shares
- 2.4.3 3D NAND Capacity
- 2.5. China
- 2.5.1. China's Semiconductor Infrastructure
- 2.5.2. China's Semiconductor Market
- 2.5.3. China's IC Production
- 2.5.4. China's IC Consumption
- 2.5.5. China's IC Production/Consumption Ratio
- 2.5.6. China's IC Import Requirements
- 2.5.7. China's IC Supply/Demand
- 2.5.8. China's IC Fab Capacity
- 2.5.9. China's IC Fab Capacity by Region
- 2.5.10. China's 8- And 12-Inch Fabs and Foundries
- 2.5.11. China's IC Fab Capacity by Wafer Size
- 2.5.12. China's IC Fab Capacity by Geometry
- 2.5.13. China's IC Production by Type
Chapter 3. Market Business Sectors Shares and Forecast
- 3.1. AMHS Market Shares and Forecast
- 3.2. CMP Market Shares and Forecast
- 3.3. Clean Market Shares and Forecast
- 3.3.1. Plasma Strip
- 3.3.2. Spray Processors
- 3.3.3. Wet Stations
- 3.4. Deposition Market Shares and Forecast
- 3.4.1. ALD
- 3.4.2. Epitaxy
- 3.4.3. MOCVD
- 3.4.4. LPCVD (non-tube)
- 3.4.5. LPCVD (tube)
- 3.4.6. PECVD
- 3.4.7. PVD
- 3.5. Ion Implantation Market Shares and Forecast
- 3.6. Lithography Market Shares and Forecast
- 3.6.1. Direct-Write E-Beam Lithography
- 3.6.2. Mask-Making Lithography
- 3.6.3. Steppers
- 3.7. Oxidation/Diffusion Market Shares and Forecast
- 3.8. Photoresist Processing (Track) Market Shares and Forecast
- 3.9. RTP Market Shares and Forecast
- 3.10. Plasma Etch Market Shares and Forecast
- 3.10.1. Dielectric
- 3.10.2. Conductor
- 3.11. Process Control Market Shares and Forecast
- 3.11.1. Lithography Metrology
- 3.11.2. Thin-Film Metrology
- 3.11.3. Wafer Inspection and Defect Review
Chapter 4. U.S. Semiconductor Equipment Suppliers - Profiles
- 4.1. Applied Materials
- 4.1.1. Business Sectors Covered In The Market Analysis Chapter
- 4.1.2. Company Profile
- 4.1.3. Company Financials
- 4.2. Axcelis Technologies
- 4.1.2. Business Sectors Covered In The Market Analysis Chapter
- 4.2.2. Company Profile
- 4.2.3. Company Financials
- 4.3. KLA
- 4.3.1. Business Sectors Covered In The Market Analysis Chapter
- 4.3.2. Company Profile
- 4.3.3. Company Financials
- 4.4. Lam Research
- 4.4.1. Business Sectors Covered In The Market Analysis Chapter
- 4.4.2. Company Profile
- 4.4.3. Company Financials
- 4.5. Mattson Technology
- 4.5.1. Business Sectors Covered In The Market Analysis Chapter
- 4.5.2. Company Profile
- 4.5.3. Company Financials
- 4.6. Opto Innovation
- 4.6.1. Business Sectors Covered In The Market Analysis Chapter
- 4.6.2. Company Profile - Nanometrics
- 4.6.3. Sectors Covered In The Market Analysis Chapter
- 4.6.4. Company Profile - Rudolph Technologies
- 4.6.5. Company Financials
- 4.7. Veeco
- 4.7.1. Business Sectors Covered In The Market Analysis Chapter
- 4.7.2. Company Profile
- 4.7.3. Company Financials
Chapter 5. European Semiconductor Equipment Suppliers - Profiles
- 5.1. Aixtron
- 5.1.1. Business Sectors Covered In The Market Analysis Chapter
- 5.1.2. Company Profile
- 5.1.3. Company Financials
- 5.2. ASM International
- 5.2.1. Business Sectors Covered In The Market Analysis Chapter
- 5.2.2. Company Profile
- 5.2.3. Company Financials
- 5.3. ASML
- 5.3.1. Business Sectors Covered In The Market Analysis Chapter
- 5.3.2. Company Profile
- 5.3.3. Company Financials
- 5.4. Carl Zeiss
- 5.4.1. Business Sectors Covered In The Market Analysis Chapter
- 5.4.2. Company Profile
- 5.4.3. Company Financials
- 5.5. Camtek
- 5.5.1. Business Sectors Covered In The Market Analysis Chapter
- 5.5.2. Company Profile
- 5.5.3. Company Financials
- 5.6. EV Group
- 5.6.1. Business Sectors Covered In The Market Analysis Chapter
- 5.6.2. Company Profile
- 5.6.3. Company Financials
- 5.7. LPE
- 5.7.1. Business Sectors Covered In The Market Analysis Chapter
- 5.7.2. Company Profile
- 5.7.3. Company Financials
- 5.8. Mycronic
- 5.8.1. Business Sectors Covered In The Market Analysis Chapter
- 5.8.2. Company Profile
- 5.8.3. Company Financials
- 5.9. Nova Measuring Instruments9
- 5.9.1. Business Sectors Covered In The Market Analysis Chapter
- 5.9.2. Company Profile
- 5.9.3. Company Financials
- 5.10. Oerlikon / Evatec
- 5.10.1. Business Sectors Covered In The Market Analysis Chapter
- 5.10.2. Company Profile
- 5.10.3. Company Financials
- 5.11. Semilab
- 5.11.1. Business Sectors Covered In The Market Analysis Chapter
- 5.11.2. Company Profile
- 5.11.3. Company Financials
Chapter 6. Asian Semiconductor Equipment Suppliers - Profiles
- 6.1. ACM Research
- 6.1.1. Business Sectors Covered In The Market Analysis Chapter
- 6.1.2. Company Profile
- 6.1.3. Company Financials
- 6.2. Advantest
- 6.2.1. Business Sectors Covered In The Market Analysis Chapter
- 6.2.2. Company Profile
- 6.2.3. Company Financials
- 6.3. AMEC
- 6.3.1. Business Sectors Covered In The Market Analysis Chapter
- 6.3.2. Company Profile
- 6.3.3. Company Financials
- 6.4. Avaco
- 6.4.1. Business Sectors Covered In The Market Analysis Chapter
- 6.4.2. Company Profile
- 6.4.3. Company Financials
- 6.5. Canon
- 6.5.1. Business Sectors Covered In The Market Analysis Chapter
- 6.5.2. Company Profile
- 6.5.3. Company Financials
- 6.5.6. Canon Anelva
- 6.6.1. Business Sectors Covered In The Market Analysis Chapter
- 6.6.2. Company Profile
- 6.6.3. Company Financials
- 6.7. Daifuku
- 6.7.1. Business Sectors Covered In The Market Analysis Chapter
- 6.7.2. Company Profile
- 6.7.3. Company Financials
- 6.8. Ebara
- 6.8.1. Business Sectors Covered In The Market Analysis Chapter
- 6.8.2. Company Profile
- 6.8.3. Company Financials
- 6.9. Eugene Technology
- 6.9.1. Business Sectors Covered In The Market Analysis Chapter
- 6.9.2. Company Profile
- 6.9.3. Company Financials
- 6.10. Hitachi High-Technologies
- 6.10.1. Business Sectors Covered In The Market Analysis Chapter
- 6.10.2. Company Profile
- 6.1.3. Company Financials
- 6.10. Hitachi Kokusai Electric
- 6.11.1. Business Sectors Covered In The Market Analysis Chapter
- 6.11.2. Company Profile
- 6.11.3. Company Financials
- 6.12. Hwatsing
- 6.12.1. Business Sectors Covered In The Market Analysis Chapter
- 6.12.2. Company Profile
- 6.12.3. Company Financials
- 6.13. JEOL
- 6.13.1. Business Sectors Covered In The Market Analysis Chapter
- 6.13.2. Company Profile
- 6.13.3. Company Financials
- 6.14. Jusung Engineering
- 6.14.1. Business Sectors Covered In The Market Analysis Chapter
- 6.14.2. Company Profile
- 6.14.3. Company Financials
- 6.15. KC Tech
- 6.15.1. Business Sectors Covered In The Market Analysis Chapter
- 6.15.2. Company Profile
- 6.15.3. Company Financials
- 6.16. Lasertec
- 6.16.1. Business Sectors Covered In The Market Analysis Chapter
- 6.16.2. Company Profile
- 6.16.3. Company Financials
- 6.17. Murata Machinery
- 6.17.1. Business Sectors Covered In The Market Analysis Chapter
- 6.17.2. Company Profile
- 6.17.3. Company Financials
- 6.18. Murata Machinery
- 6.18.1. Business Sectors Covered In The Market Analysis Chapter
- 6.18.2. Company Profile
- 6.18.3. Company Financials
- 6.19. Nikon
- 6.19.1. Business Sectors Covered In The Market Analysis Chapter
- 6.19.2. Company Profile
- 6.19.3. Company Financials
- 6.20. Nippon Sanso
- 6.20.1. Business Sectors Covered In The Market Analysis Chapter
- 6.20.2. Company Profile
- 6.20.3. Company Financials
- 6.21. Nissin Ion Equipment
- 6.21.1. Business Sectors Covered In The Market Analysis Chapter
- 6.21.2. Company Profile
- 6.21.3. Company Financials
- 6.22. NuFlare Technology
- 6.22.1. Business Sectors Covered In The Market Analysis Chapter
- 6.22.2. Company Profile
- 6.22.3. Company Financials
- 6.23. Piotech
- 6.23.1. Business Sectors Covered In The Market Analysis Chapter
- 6.23.2. Company Profile
- 6.23.3. Company Financials
- 6.24. PSK
- 6.24.1. Business Sectors Covered In The Market Analysis Chapter
- 6.24.2. Company Profile
- 6.24.3. Company Financials
- 6.25. Raintree Scientific Instruments
- 6.25.1. Business Sectors Covered In The Market Analysis Chapter
- 6.25.2. Company Profile
- 6.25.3. Company Financials
- 6.26. Screen Semiconductor Solutions
- 6.26.1. Business Sectors Covered In The Market Analysis Chapter
- 6.26.2. Company Profile
- 6.26.3. Company Financials
- 6.27. SEMES
- 6.27.1. Business Sectors Covered In The Market Analysis Chapter
- 6.27.2. Company Profile
- 6.27.3. Company Financials
- 6.28. SEN
- 6.28.1. Business Sectors Covered In The Market Analysis Chapter
- 6.28.2. Company Profile
- 6.28.3. Company Financials
- 6.29. TES
- 6.29.1. Business Sectors Covered In The Market Analysis Chapter
- 6.29.2. Company Profile
- 6.29.3. Company Financials
- 6.30. Tokyo Electron
- 6.30.1. Business Sectors Covered In The Market Analysis Chapter
- 6.30.2. Company Profile
- 6.30.3. Company Financials
- 6.31. Tokyo Seimitsu
- 6.31.1. Business Sectors Covered In The Market Analysis Chapter
- 6.31.2. Company Profile
- 6.31.3. Company Financials
- 6.32. Topcon Technohouse
- 6.32.1. Business Sectors Covered In The Market Analysis Chapter
- 6.32.2. Company Profile
- 6.32.3. Company Financials
- 6.33. Toray Engineering
- 6.33.1. Business Sectors Covered In The Market Analysis Chapter
- 6.33.2. Company Profile
- 6.33.3. Company Financials
- 6.34. Ulvac
- 6.34.1. Business Sectors Covered In The Market Analysis Chapter
- 6.34.2. Company Profile
- 6.34.3. Company Financials
- 6.35. Ushio
- 6.35.1. Business Sectors Covered In The Market Analysis Chapter
- 6.35.2. Company Profile
- 6.35.3. Company Financials
- 6.36. Wonik IPS
- 6.36.1. Business Sectors Covered In The Market Analysis Chapter
- 6.36.2. Company Profile
- 6.36.3. Company Financials
LIST OF TABLES
- 1.1. Global Wafer Front End Equipment Companies
- 1.2. Capex By Company
- 2.1. Foundry Capex ($ Millions)
- 2.2. Pure Play Foundry Forecast
- 2.3. Pure Play Foundry Revenue Shares
- 2.4. Foundry / Logic Lithography Demand
- 2.5. New Capacity Equipment Demand By Type
- 2.6. TSMC Wafer Price By Node - 2020-2025
- 2.7. TSMC Wafer Price By Node - 2025
- 2.8. TSMC Chip Features By Node
- 2.9. TSMC Top Customers By Revenue
- 2.10. Technology Roadmaps For China Foundries
- 2.11. Global Foundry Market By Linewidth
- 2.12. Foundry Capacity By Region
- 2.13. DRAM Wafer Capacity Forecast by Fab - Wafers
- 2.14. DRAM Earnings Comparisons by Company
- 2.15. DRAM Revenue Demand Forecast by Application
- 2.16. DRAM Market Shares
- 2.17. DRAM Capex Forecast by Company
- 2.18. NAND Wafer Capacity by Fab
- 2.19. NAND Earnings Comparison by Company
- 2.20. NAND Bit Growth Demand Forecast by Application
- 2.21. NAND Market Shares
- 2.22. Average Selling Prices (ASPs) Forecast
- 2.23. NAND Capex Forecast By Company
- 2.24. China Manufacturing Capacity
- 2.25. Chinese Equipment Suppliers And Top Foreign Supplier
- 2-26. China's 8- And 12-Inch Fabs and Foundries
- 3.1. AMHS Market Forecast
- 3.2. CMP Market Forecast
- 3.3. Plasma Strip Market Forecast
- 3.4. Spray Processors Market Forecast
- 3.5. Wet Stations Market Forecast
- 3.6. ALD Market Forecast
- 3.7. Epitaxy Market Forecast
- 3.8. MOCVD Market Forecast
- 3.9. LPCVD (non-tube) Market Forecast
- 3.10. LPCVD (tube) Market Forecast
- 3.11. PECVD Market Forecast
- 3.12. PVD Market Forecast
- 3.13. Ion Implantation Market Forecast
- 3.14. Direct-Write E-Beam Lithography Market Forecast
- 3.15. Mask-Making Lithography Market Forecast
- 3.16. Steppers Market Forecast
- 3.17. Oxidation Market Forecast
- 3.18. Photoresist Processing (Track) Market Forecast
- 3.19. RTP Market Forecast
- 3.20. Dielectric Etch Market Forecast
- 3.21. Conductive Etch Market Forecast
- 3.22. Lithography Metrology Market Forecast
- 3.23. Thin-Film Metrology Market Forecast
- 3.24. Wafer Inspection and Defect Review Market Forecast
LIST OF FIGURES
- 1.1. Semiconductor Equipment Billings
- 2.1. China's IC Production Forecast
- 2.2. China's IC Consumption
- 2.3. China's IC Production/Consumption Ratio
- 2.4. IC Import to China
- 2.5. China's IC Supply/Demand
- 2.6. China's IC Fab Capacity
- 2.7. China's IC Fab Capacity by Region
- 2.8. China's IC Fab Capacity by Wafer Size
- 2.9. China's IC Fab Capacity by Geometry
- 2.10. China's IC Production by Application
- 3.1. AMHS Market Shares
- 3.2. CMP Market Shares
- 3.3. Plasma Strip Market Shares
- 3.4. Spray Processors Market Shares
- 3.5. Wet Stations Market Shares
- 3.6. ALD Market Shares
- 3.7. Epitaxy Market Shares
- 3.8. MOCVD Market Shares
- 3.9. LPCVD (non-tube) Market Shares
- 3.10. LPCVD (tube) Market Shares
- 3.11. PECVD Market Shares
- 3.12. PVD Market Shares
- 3.13. Ion Implantation Market Shares
- 3.14. Direct-Write E-Beam Lithography Market Shares
- 3.15. Mask-Making Lithography Market Shares
- 3.16. Steppers Market Shares
- 3.17. Oxidation Market Shares
- 3.18. Photoresist Processing (Track) Market Shares
- 3.19. RTP Market Shares
- 3.20. Dielectric Etch Market Shares
- 3.21. Conductive Etch Market Shares
- 3.22. Lithography Metrology Market Shares
- 3.23. Thin-Film Metrology Market Shares
- 3.24. Wafer Inspection and Defect Review Market Shares

