
PUBLISHER: Industry Experts | PRODUCT CODE: 1747988

PUBLISHER: Industry Experts | PRODUCT CODE: 1747988
Application Performance Monitoring (APM) - A Global Market Overview
Global Application Performance Monitoring (APM) Market Trends and Outlook
Several evolving trends are shaping the dynamic market for Application Performance Monitoring, one of which is cloud-native APM. A growth in the adoption of cloud computing and microservices architectures has increased demand for APM solutions that have been especially designed for these dynamic and distributed environments. These solutions offer scalability, flexibility and seamless integration with cloud platforms, such as AWS, Azure and Google Cloud. APM tools are being integrated with artificial intelligence (AI) and machine learning (ML) for automating tasks, such as anomaly detection, root cause analysis, predictive analytics and intelligent alerting, thereby allowing IT teams to proactively identify and resolve issues faster by minimizing manual intervention. Another trend is a shift from traditional APM, which mainly monitors application code and infrastructure, to broader "observability" solutions. Apart from covering APM, observability also integrates data from logs, metrics and traces across the entire IT stack to offer a more holistic view of system behavior. The importance of understanding end-user experience has increased considerably.
INFOGRAPHICS
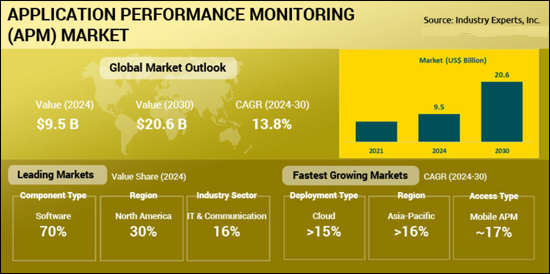
The global market for Application Performance Monitoring is estimated at US$9.5 billion in 2024 and is likely to register a 2024-2030 CAGR of 13.8% in reaching a projected US$20.6 billion by 2030. Several factors are driving growth of the APM market. Complex architectures, including microservices, containers and hybrid cloud deployments are being increasingly used to build modern applications. Because of this complexity, managing performance using traditional monitoring methods becomes challenging, driving the need for sophisticated APM solutions. As businesses recognize that a positive digital experience is crucial for customer satisfaction and retention, APM is becoming essential to ensure optimal user experiences, since poor application performance can erode customer base and lead to revenue losses. Companies in a majority of the industries have initiated a move towards digital transformation, which depend heavily on software applications for core business operations.
Application Performance Monitoring (APM) Regional Market Analysis
With an estimated 2024 share of 30.2%, North America leads the global market for Application Performance Monitoring. The region's, especially the United States', highly developed IT ecosystem fosters widespread adoption of cloud computing, IoT and AI-driven technologies, all of which need robust APM tools for ensuring application efficiency. North America is also home to leading APM vendors, such as AppDynamics, Dynatrace and New Relic, among others, which promote innovation, competitive offerings and localized support to support market growth. However, Asia-Pacific is likely to emerge as the fastest growing market for Application Performance Monitoring, forecast to maintain a compounded annual rate of 16.3% over 2024-2030. China, India and several Southeast Asian countries are expediting their digital transformation journey across sectors, such as e-commerce, finance and manufacturing, which is driving the need for APM to ensure application reliability. The region's upsurge in adopting cloud computing and SaaS, especially in hybrid and multi-cloud environments, is another factor pushing the market for APM solutions that can monitor and optimize distributed applications. Strong growth in IT services, telecom infrastructure and 5G rollout in countries, such as India, Japan and South Korea is furthering the need for APM to manage complex, high-performance applications.
Application Performance Monitoring (APM) Market Analysis by Component
By component, the global market for Application Performance Monitoring has been segmented into Software and Services, of which the former holds the dominant share estimated at 70.1% in 2024. Being the foundational technology, APM software helps organizations in monitoring, analyzing and optimizing application performance. The most important functions covered by these tools include real-time monitoring, diagnostics, dependency mapping and analytics, which makes it a key component of APM deployments. IT environments, driven by cloud computing, microservices and distributed architectures, have become increasingly complex, for which robust software-based APM solutions are needed. These solutions can monitor performance across diverse infrastructures, including on-premises, cloud & hybrid, which contributes to the leading position of Software in the APM market. As regards growth, though, the worldwide demand for the Services component in APM is likely to record a faster 2024-2030 compounded annual rate of 14.7%, a major factor for which is growing demand for implementation and support services. The adoption of complex APM solutions by enterprises requires professional services that include including implementation, integration, training and ongoing support. These services are essential for making sure that deployment and optimization have been successful, thereby propelling the market for APM Services.
Application Performance Monitoring (APM) Market Analysis by Deployment
Whereas the global demand for Application Performance Monitoring in terms of Deployment is larger for On-Premises (54.8% estimated in 2024), Cloud Deployment of APM solutions is anticipated to clock a faster 2024-2030 CAGR of 15.5%. Legacy systems deeply integrated with on-premises infrastructure form the basis for a number of large enterprises, especially in the finance, healthcare and government sectors. The use of ON-PREMISES APM solutions by such organizations involves monitoring complex, multi-tier applications, which cannot be easily migrated to the cloud. Additional advantages include the full control over infrastructure provided by on-premise deployment that is crucial for businesses managing sensitive or critical applications, wherein priority is given to compliance and risk management. Industries with stringent data privacy and compliance regulations, such as HIPAA in healthcare and GDPR in Europe, are more comfortable with on-premises deployments for ensuring data locality and governance. Data maintained within an organization's premises, rather than on multi-tenant cloud architectures, makes the process of adhering to regulatory standards simpler.
Application Performance Monitoring (APM) Market Analysis by Company Type
Cornering an estimated share of 63.1% in 2024, Large Enterprises dominate the global demand for Application Performance Monitoring (APM) tools. The operation of large enterprises is typically based on complex, multi-tier IT environments with legacy systems, hybrid cloud setups and distributed applications, which need robust APM solutions for monitoring performance covering various platforms to minimize downtime and optimize user experience. Examples include finance, healthcare and retail organizations using APM for managing mission-critical and operationally central applications, such as banking systems or ecommerce platforms. Large enterprises have the advantage of substantial budgetary allocations for investing in comprehensive, tailored APM tools with advanced features, including on-premises and hybrid solutions, which can be procured from leading vendors, such as AppDynamics or Dynatrace.
Application Performance Monitoring (APM) Market Analysis by Access Type
Analyzing the global APM market by type of access reveals that Web APM is the clear leader, estimated to account for a share of 68.7% in 2024. Web applications form the mainstay of several business operations, including e-commerce platforms, enterprise portals and customer-facing services in industries, such as finance, healthcare and retail. Web APM is critical for monitoring the performance of these applications, ensuring fast load times and seamless user experiences. Additionally, web APM has become indispensable in enterprise IT environments because of the wide adoption of web-based applications, especially for desktop and browser-based access. The well-established presence of web APM has made it a core component of the APM market, in which mobile APM is a new entrant. Web applications often involve complex, multi-tier architectures, such as front-end, back-end, APIs and databases, which need complete monitoring for identifying any obstacles in performance.
Application Performance Monitoring (APM) Market Analysis by Industry Sector
Estimated to account for a share of 16.4% in 2024, IT & Communication leads the global demand for Application Performance Monitoring by industry sector. The heavy reliance of this sector on complex, high-performance IT systems, including data centers, cloud environments and telecommunications networks makes it imperative to have APM tools in place to monitor these systems and ensure uptime, low latency and seamless performance for services, such as cloud computing, VoIP, and network infrastructure. However, the worldwide demand for APM in the Education sector is likely to log the fastest CAGR of 17.3% over 2024-2030, a major factor for which is the rapidly ongoing digital transformation in this area. Following the COVID-19 pandemic, online learning platforms, virtual classrooms and learning management systems (LMS) have become the norm, for which APM is required to monitor the performance of these platforms, such as Canvas, Blackboard & Google Classroom, for ensuring that students and educators have reliable accessibility. Educational institutions, including K-12 schools, universities and EdTech companies, are increasing their adoption of cloud-based applications for cost efficiency and scalability. Cloud-based APM tools, such as AWS CloudWatch or New Relic, are ideal for monitoring these environments, offering affordable and easy-to-deploy solutions.
Application Performance Monitoring Market Report Scope
This global report on Application Performance Monitoring analyzes the global and regional market based on component, deployment, organization type, access type and industry sector for the period 2021-2030 with projection from 2024 to 2030 in terms of value in US$. In addition to providing profiles of major companies operating in this space, the latest corporate and industrial developments have been covered to offer a clear panorama of how and where the market is progressing.
| Key Metrics | |
|---|---|
| Historical Period: | 2021-2023 |
| Base Year: | 2024 |
| Forecast Period: | 2024-2030 |
| Units: | Value market in US$ |
| Companies Mentioned: | 24 |
Application Performance Monitoring (APM) Market by Geographic Region
- North America (The United States, Canada and Mexico)
- Europe (Germany, the United Kingdom, France, Italy, the Netherlands, Spain, Russia, Switzerland and Rest of Europe)
- Asia-Pacific (China, Japan, India, Australia, Singapore, South Korea and Rest of Asia-Pacific)
- South America (Brazil, Argentina, Colombia, Chile, Peru and Rest of South America)
- Middle East & Africa (the United Arab Emirates, South Africa, Egypt, Saudi Arabia, Morocco, Kuwait, Qatar and Rest of Middle East & Africa)
Application Performance Monitoring (APM) Market by Component
- Software
- Services
Application Performance Monitoring (APM) Market by Deployment
- On-Premises
- Cloud
Application Performance Monitoring (APM) Market by Organization Type
- Large Enterprises
- Small & Medium-Sized Enterprises (SMEs)
Application Performance Monitoring (APM) Market by Access Type
- Web APM
- Mobile APM
Application Performance Monitoring (APM) Market by Industry Sector
- IT & Communication
- BFSI
- Healthcare & Life Sciences
- Media & Entertainment
- Retail & Ecommerce
- Energy & Utilities
- Manufacturing
- Education
- Government
- Transportation
- Construction
- Tourism & Hospitality
- Others
Major Market Players:
|
|
TABLE OF CONTENTS
PART A: GLOBAL MARKET PERSPECTIVE
1. EXECUTIVE SUMMARY
- 1.1. A Roundup on Application Performance Monitoring (APM)
- 1.1.1. Market Segmentation for APM
- 1.1.1.1. Components
- 1.1.1.2. Deployment Types
- 1.1.1.3. Company Types
- 1.1.1.4. Access Types
- 1.1.1.5. Industry Sectors
- 1.1.2. Key Trends in Application Performance Monitoring (APM)
- 1.1.2.1. Traditional Monitoring Gives Way to Full-Stack Observability
- 1.1.2.2. Integration of Artificial Intelligence (AI) and Machine Learning (ML)
- 1.1.2.3. Cloud-Native and Microservices Monitoring Now the Norm
- 1.1.2.4. End-User Experience Monitoring (EUM) Gains Traction
- 1.1.2.5. AI-Powered Automated Incident Response and Remediation Powering APM
- 1.1.2.6. Open-Source and Hybrid Solutions Adoption Growing
- 1.1.2.7. Security Observability in an Expansion Mode
- 1.1.1. Market Segmentation for APM
2. INDUSTRY LANDSCAPE
- 2.1. Global Application Performance Monitoring (APM) Market Outlook
- 2.1.1. Comprehensive APM Industry Analysis - Growth Drivers and Inhibitors
- 2.1.1.1. Growth Drivers
- 2.1.1.1.1. Growth in Cloud Computing Adoption
- 2.1.1.1.2. Move to Microservices and Containerized Architectures
- 2.1.1.1.3. Customer Experience (CX) and User Satisfaction Become Key Focus Points
- 2.1.1.1.4. Real-Time Data and Predictive Analytics Gain Significance
- 2.1.1.1.5. Adoption of DevOps and Continuous Delivery Increasing
- 2.1.1.1.6. Customers Demand Ease of Use and Deployment
- 2.1.1.1.7. Need for Compliance and Regulatory Requirements
- 2.1.1.2. Growth Inhibitors
- 2.1.1.2.1. Implementation and Maintenance Costs Quite High
- 2.1.1.2.2. Challenge of Integrating APM with Legacy Systems
- 2.1.1.2.3. Concerns Regarding Data Privacy and Security
- 2.1.1.2.4. Dearth of Skilled Professionals
- 2.1.1.1. Growth Drivers
- 2.1.1. Comprehensive APM Industry Analysis - Growth Drivers and Inhibitors
- 2.2. Technology Advancements & Consumer Behaviors - Impact on APM
- 2.2.1. Technological Advancements
- 2.2.1.1. Integration of Artificial Intelligence (AI) and Machine Learning (ML)
- 2.2.1.2. Cloud-Native Architectures and Containerization
- 2.2.1.3. Real-User Monitoring (RUM) and Synthetic Monitoring
- 2.2.1.4. Observability and Full-Stack Monitoring
- 2.2.1.5. Edge Computing and IoT Monitoring
- 2.2.2. Changes in Consumer Behavior
- 2.2.2.1. Instant Gratification and Low Latency Grow in Demand
- 2.2.2.2. Move Toward Mobile-First and Multi-Device Access
- 2.2.2.3. Focus on Security and Privacy on the Rise
- 2.2.1. Technological Advancements
- 2.3. Market Entry Strategies for APM Industry
- 2.3.1. Organic Growth the Feasible Option for Smaller Organizations
- 2.3.2. Forming Collaborations and Alliances
- 2.3.3. Acquiring Existing or Startup Companies
- 2.3.4. Licensing of Technology and White Labeling
- 2.3.5. Global Expansion
- 2.4. Startup Strategies for APM Industry
- 2.4.1. Strategies to be Adopted by Startups When Entering the APM Industry
- 2.4.2. Strategies to be Adopted by Startups After Entering the APM Industry
- 2.4.3. OBSTACLES TO STARTUPS IN ENTERING THE APM INDUSTRY
- 2.4.3.1. Competition from Established Players
- 2.4.3.2. Acquiring and Retaining Customers
- 2.4.3.3. High Capital Investment
- 2.4.3.4. Challenges of Scalability and Performance
- 2.4.3.5. Challenges of Funding and Managing Cash Flow
- 2.4.3.6. Complexity in Integration
- 2.4.3.7. Concerns of Data Privacy and Security
- 2.4.3.8. Striking a Balance Between Innovation with Reliability
- 2.4.3.9. Acquiring Skilled Professionals
- 2.4.3.10. Creating Customer Awareness
- 2.5. SWOT Analysis of Application Performance Monitoring (APM) Industry
- 2.5.1. Strengths
- 2.5.2. Weaknesses
- 2.5.3. Opportunities
- 2.5.4. Threats
- 2.6. Porter's Five Forces Analysis
- 2.7. PESTEL Analysis
3. COMPETITIVE LANDSCAPE
- 3.1. Market Positioning of Key APM Companies
- 3.1.1. DYNATRACE
- 3.1.2. NEW RELIC
- 3.1.3. APPDYNAMICS (CISCO)
- 3.1.4. DATADOG
- 3.1.5. SOLARWINDS
- 3.1.6. INSTANA (IBM)
- 3.2. Market Share Analysis of APM
- 3.3. Categorization of Major Market Players
- 3.4. A Deep Dive into APM Customer's Perception
- 3.4.1. Objectives of Clients
- 3.4.2. Performance and Quality
- 3.4.3. Factors that Shape Customer Decision-Making
- 3.4.4. Target Customer Segments
- 3.5. SWOT Analysis of Key Players in the APM Industry
- 3.6. Key Market Players
- 3.6.1. APPDYNAMICS (UNITED STATES)
- 3.6.2. CATCHPOINT SYSTEMS, INC. (UNITED STATES)
- 3.6.3. CORALOGIX LTD (UNITED STATES)
- 3.6.4. DATADOG, INC. (UNITED STATES)
- 3.6.5. DYNATRACE LLC (UNITED STATES)
- 3.6.6. ELASTIC NV (NETHERLANDS)
- 3.6.7. ENSONO LTD (UNITED STATES)
- 3.6.8. HONEYCOMB.IO (UNITED STATES)
- 3.6.9. INTERNATIONAL BUSINESS MACHINES (IBM) CORP (UNITED STATES)
- 3.6.10. LOGICMONITOR, INC. (UNITED STATES)
- 3.6.11. NAGIOS ENTERPRISES LLC (THE UNITED STATES)
- 3.6.12. NEW RELIC, INC. (UNITED STATES)
- 3.6.13. NEXTHINK SA (SWITZERLAND)
- 3.6.14. ORACLE CORP (UNITED STATES)
- 3.6.15. PLATFORM.SH SAS (FRANCE)
- 3.6.16. QUEST SOFTWARE, INC. (UNITED STATES)
- 3.6.17. RIVERBED TECHNOLOGY LLC (UNITED STATES)
- 3.6.18. SEMATEXT GROUP, INC. (UNITED STATES)
- 3.6.19. SERVICENOW, INC. (UNITED STATES)
- 3.6.20. SITE24X7 (UNITED STATES)
- 3.6.21. SOLARWINDS WORLDWIDE, LLC (UNITED STATES)
- 3.6.22. SPLUNK, LLC. (UNITED STATES)
- 3.6.23. THUNDRA, INC. (UNITED STATES)
- 3.6.24. ZOHO CORPORATION PVT LTD (INDIA)
4. KEY BUSINESS & PRODUCT TRENDS
- 4.1. April 2025
- 4.1.1. Datadog Acquires Metaplane to Accelerate Data Observability
- 4.1.2. Elastic Announces Launch of LLM Observability
- 4.1.3. Datadog Enhances BigQuery Monitoring and Unveils New Integrations at Google Cloud Next
- 4.1.4. Nexthink Unveils Nexthink Adopt on Infinity
- 4.1.5. Elastic Announces Elastic Distributions of OpenTelemetry (EDOT)
- 4.1.6. Splunk Unveils OpenTelemetry Enhancements and Advanced Kubernetes Monitoring
- 4.2. March 2025
- 4.2.1. LogicMonitor Boosts Application Performance Monitoring with AI-Driven Enhancements
- 4.2.2. Coralogix Launches AI Center to Expand Cross-Stack Observability and AI Monitoring
- 4.3. February 2025
- 4.3.1. Catchpoint Introduces Internet Stack Map
- 4.3.2. Riverbed Unveils Riverbed Smart OTelTM
- 4.4. January 2025
- 4.4.1. Dynatrace Collaborates with Visa Cash App Racing Bulls (VCARB) Formula One(TM) Team
- 4.5. December 2024
- 4.5.1. Coralogix Announces Acquisition of Aporia
- 4.5.2. Quest Software Unveils New Solutions to Accelerate PostgreSQL Adoption and Performance
- 4.5.3. OpenText Partners with Secure Code Warrior
- 4.5.4. Datadog Expands Database Monitoring to Support MongoDB
- 4.6. November 2024
- 4.6.1. Splunk Launches Security and Observability Solutions on Microsoft Azure
- 4.6.2. Elastic Unveils OpenTelemetry Experience for Kubernetes
- 4.6.3. Splunk Expands Observability Portfolio with New Innovations
- 4.7. October 2024
- 4.7.1. Catchpoint Unveils new offering AppAssure
- 4.7.2. Honeycomb Announces Launch of new Innovations
- 4.7.3. Riverbed and Intel Collaborate for Deep Telemetry
- 4.8. September 2024
- 4.8.1. Honeycomb Unveils Frontend Observability Solution
- 4.9. August 2024
- 4.9.1. Elastic Announces Launch of Distributions of OpenTelemetry
- 4.10. July 2024
- 4.10.1. Coralogix Introduces Mobile Real User Monitoring (RUM) solution
- 4.11. June 2024
- 4.11.1. Datadog Integrates Datadog Agent and OpenTelemetry Collector
- 4.11.2. Elastic Donates its Universal Profiling Agent to OpenTelemetry
- 4.12. May 2024
- 4.12.1. IBM Instana Unveils Intelligent Remediation Solution
- 4.12.2. Catchpoint Announced Launch of Catchpoint Tracing
- 4.12.3. Riverbed Launches AI-Powered Observability Platform to Boost Digital Experience and IT Visibility
- 4.13. April 2024
- 4.13.1. New Relic Launches APM for AI
- 4.14. March 2024
- 4.14.1. Cisco Announces Acquisition of Splunk
- 4.15. January 2024
- 4.15.1. Honeycomb Deploys SaaS Cloud in EU
- 4.16. December 2023
- 4.16.1. Quest Software Announces Launch of Foglight Cloud
- 4.17. November 2023
- 4.17.1. Elastic Announces Acquisition of Opster
- 4.17.2. Turtlemint Enhances APM Capabilities with IBM Instana Observability
- 4.17.3. Honeycomb Announces Launch of Honeycomb for Kubernetes
- 4.18. June 2023
- 4.18.1. New Relic Announces Launch of New Relic APM 360
5. GLOBAL MARKET OVERVIEW
- 5.1. Global Application Performance Monitoring Market Overview by Component
- 5.1.1. Application Performance Monitoring Component Market Overview by Global Region
- 5.1.1.1. Software
- 5.1.1.2. Services
- 5.1.1. Application Performance Monitoring Component Market Overview by Global Region
- 5.2. Global Application Performance Monitoring Market Overview by Deployment
- 5.2.1. Application Performance Monitoring Deployment Market Overview by Global Region
- 5.2.1.1. On-Premises
- 5.2.1.2. Cloud
- 5.2.1. Application Performance Monitoring Deployment Market Overview by Global Region
- 5.3. Global Application Performance Monitoring Market Overview by Company Type
- 5.3.1. Application Performance Monitoring Company Type Market Overview by Global Region
- 5.3.1.1. Large Enterprises
- 5.3.1.2. SMEs
- 5.3.1. Application Performance Monitoring Company Type Market Overview by Global Region
- 5.4. Global Application Performance Monitoring Market Overview by Access Type
- 5.4.1. Application Performance Monitoring Access Type Market Overview by Global Region
- 5.4.1.1. Web APM
- 5.4.1.2. Mobile APM
- 5.4.1. Application Performance Monitoring Access Type Market Overview by Global Region
- 5.5. Global Application Performance Monitoring Market Overview by Industry Sector
- 5.5.1. Application Performance Monitoring Industry Sector Market Overview by Global Region
- 5.5.1.1. IT & Communication
- 5.5.1.2. BFSI
- 5.5.1.3. Healthcare & Life Sciences
- 5.5.1.4. Media & Entertainment
- 5.5.1.5. Retail & Ecommerce
- 5.5.1.6. Energy & Utilities
- 5.5.1.7. Manufacturing
- 5.5.1.8. Education
- 5.5.1.9. Government
- 5.5.1.10. Transportation
- 5.5.1.11. Construction
- 5.5.1.12. Tourism & Hospitality
- 5.5.1.13. Other Industry Sectors
- 5.5.1. Application Performance Monitoring Industry Sector Market Overview by Global Region
PART B: REGIONAL MARKET PERSPECTIVE
REGIONAL MARKET OVERVIEW
6. NORTH AMERICA
- 6.1. North American Application Performance Monitoring Market Overview by Geographic Region
- 6.2. North American Application Performance Monitoring Market Overview by Component
- 6.3. North American Application Performance Monitoring Market Overview by Deployment
- 6.4. North American Application Performance Monitoring Market Overview by Company Type
- 6.5. North American Application Performance Monitoring Market Overview by Access Type
- 6.6. North American Application Performance Monitoring Market Overview by Industry Sector
- 6.7. Country-wise Analysis of North American Application Performance Monitoring Market
- 6.7.1. THE UNITED STATES
- 6.7.1.1. United States Application Performance Monitoring Market Overview by Component
- 6.7.1.2. United States Application Performance Monitoring Market Overview by Deployment
- 6.7.1.3. United States Application Performance Monitoring Market Overview by Company Type
- 6.7.1.4. United States Application Performance Monitoring Market Overview by Access Type
- 6.7.1.5. United States Application Performance Monitoring Market Overview by Industry Sector
- 6.7.2. CANADA
- 6.7.2.1. Canadian Application Performance Monitoring Market Overview by Component
- 6.7.2.2. Canadian Application Performance Monitoring Market Overview by Deployment
- 6.7.2.3. Canadian Application Performance Monitoring Market Overview by Company Type
- 6.7.2.4. Canadian Application Performance Monitoring Market Overview by Access Type
- 6.7.2.5. Canadian Application Performance Monitoring Market Overview by Industry Sector
- 6.7.3. MEXICO
- 6.7.3.1. Mexican Application Performance Monitoring Market Overview by Component
- 6.7.3.2. Mexican Application Performance Monitoring Market Overview by Deployment
- 6.7.3.3. Mexican Application Performance Monitoring Market Overview by Company Type
- 6.7.3.4. Mexican Application Performance Monitoring Market Overview by Access Type
- 6.7.3.5. Mexican Application Performance Monitoring Market Overview by Industry Sector
- 6.7.1. THE UNITED STATES
7. EUROPE
- 7.1. European Application Performance Monitoring Market Overview by Geographic Region
- 7.2. European Application Performance Monitoring Market Overview by Component
- 7.3. European Application Performance Monitoring Market Overview by Deployment
- 7.4. European Application Performance Monitoring Market Overview by Company Type
- 7.5. European Application Performance Monitoring Market Overview by Access Type
- 7.6. European Application Performance Monitoring Market Overview by Industry Sector
- 7.7. Country-wise Analysis of European Application Performance Monitoring Market
- 7.7.1. GERMANY
- 7.7.1.1. German Application Performance Monitoring Market Overview by Component
- 7.7.1.2. German Application Performance Monitoring Market Overview by Deployment
- 7.7.1.3. German Application Performance Monitoring Market Overview by Company Type
- 7.7.1.4. German Application Performance Monitoring Market Overview by Access Type
- 7.7.1.5. German Application Performance Monitoring Market Overview by Industry Sector
- 7.7.2. THE UNITED KINGDOM
- 7.7.2.1. United Kingdom Application Performance Monitoring Market Overview by Component
- 7.7.2.2. United Kingdom Application Performance Monitoring Market Overview by Deployment
- 7.7.2.3. United Kingdom Application Performance Monitoring Market Overview by Company Type
- 7.7.2.4. United Kingdom Application Performance Monitoring Market Overview by Access Type
- 7.7.2.5. United Kingdom Application Performance Monitoring Market Overview by Industry Sector
- 7.7.3. FRANCE
- 7.7.3.1. French Application Performance Monitoring Market Overview by Component
- 7.7.3.2. French Application Performance Monitoring Market Overview by Deployment
- 7.7.3.3. French Application Performance Monitoring Market Overview by Company Type
- 7.7.3.4. French Application Performance Monitoring Market Overview by Access Type
- 7.7.3.5. French Application Performance Monitoring Market Overview by Industry Sector
- 7.7.4. ITALY
- 7.7.4.1. Italian Application Performance Monitoring Market Overview by Component
- 7.7.4.2. Italian Application Performance Monitoring Market Overview by Deployment
- 7.7.4.3. Italian Application Performance Monitoring Market Overview by Company Type
- 7.7.4.4. Italian Application Performance Monitoring Market Overview by Access Type
- 7.7.4.5. Italian Application Performance Monitoring Market Overview by Industry Sector
- 7.7.5. THE NETHERLANDS
- 7.7.5.1. Dutch Application Performance Monitoring Market Overview by Component
- 7.7.5.2. Dutch Application Performance Monitoring Market Overview by Deployment
- 7.7.5.3. Dutch Application Performance Monitoring Market Overview by Company Type
- 7.7.5.4. Dutch Application Performance Monitoring Market Overview by Access Type
- 7.7.5.5. Dutch Application Performance Monitoring Market Overview by Industry Sector
- 7.7.6. SPAIN
- 7.7.6.1. Spanish Application Performance Monitoring Market Overview by Component
- 7.7.6.2. Spanish Application Performance Monitoring Market Overview by Deployment
- 7.7.6.3. Spanish Application Performance Monitoring Market Overview by Company Type
- 7.7.6.4. Spanish Application Performance Monitoring Market Overview by Access Type
- 7.7.6.5. Spanish Application Performance Monitoring Market Overview by Industry Sector
- 7.7.7. RUSSIA
- 7.7.7.1. Russian Application Performance Monitoring Market Overview by Component
- 7.7.7.2. Russian Application Performance Monitoring Market Overview by Deployment
- 7.7.7.3. Russian Application Performance Monitoring Market Overview by Company Type
- 7.7.7.4. Russian Application Performance Monitoring Market Overview by Access Type
- 7.7.7.5. Russian Application Performance Monitoring Market Overview by Industry Sector
- 7.7.8. SWITZERLAND
- 7.7.8.1. Swiss Application Performance Monitoring Market Overview by Component
- 7.7.8.2. Swiss Application Performance Monitoring Market Overview by Deployment
- 7.7.8.3. Swiss Application Performance Monitoring Market Overview by Company Type
- 7.7.8.4. Swiss Application Performance Monitoring Market Overview by Access Type
- 7.7.8.5. Swiss Application Performance Monitoring Market Overview by Industry Sector
- 7.7.9. REST OF EUROPE
- 7.7.9.1. Rest of Europe Application Performance Monitoring Market Overview by Component
- 7.7.9.2. Rest of Europe Application Performance Monitoring Market Overview by Deployment
- 7.7.9.3. Rest of Europe Application Performance Monitoring Market Overview by Company Type
- 7.7.9.4. Rest of Europe Application Performance Monitoring Market Overview by Access Type
- 7.7.9.5. Rest of Europe Application Performance Monitoring Market Overview by Industry Sector
- 7.7.1. GERMANY
8. ASIA-PACIFIC
- 8.1. Asia-Pacific Application Performance Monitoring Market Overview by Geographic Region
- 8.2. Asia-Pacific Application Performance Monitoring Market Overview by Component
- 8.3. Asia-Pacific Application Performance Monitoring Market Overview by Deployment
- 8.4. Asia-Pacific Application Performance Monitoring Market Overview by Company Type
- 8.5. Asia-Pacific Application Performance Monitoring Market Overview by Access Type
- 8.6. Asia-Pacific Application Performance Monitoring Market Overview by Industry Sector
- 8.7. Country-wise Analysis of Asia-Pacific Application Performance Monitoring Market
- 8.7.1. CHINA
- 8.7.1.1. Chinese Application Performance Monitoring Market Overview by Component
- 8.7.1.2. Chinese Application Performance Monitoring Market Overview by Deployment
- 8.7.1.3. Chinese Application Performance Monitoring Market Overview by Company Type
- 8.7.1.4. Chinese Application Performance Monitoring Market Overview by Access Type
- 8.7.1.5. Chinese Application Performance Monitoring Market Overview by Industry Sector
- 8.7.2. JAPAN
- 8.7.2.1. Japanese Application Performance Monitoring Market Overview by Component
- 8.7.2.2. Japanese Application Performance Monitoring Market Overview by Deployment
- 8.7.2.3. Japanese Application Performance Monitoring Market Overview by Company Type
- 8.7.2.4. Japanese Application Performance Monitoring Market Overview by Access Type
- 8.7.2.5. Japanese Application Performance Monitoring Market Overview by Industry Sector
- 8.7.3. INDIA
- 8.7.3.1. Indian Application Performance Monitoring Market Overview by Component
- 8.7.3.2. Indian Application Performance Monitoring Market Overview by Deployment
- 8.7.3.3. Indian Application Performance Monitoring Market Overview by Company Type
- 8.7.3.4. Indian Application Performance Monitoring Market Overview by Access Type
- 8.7.3.5. Indian Application Performance Monitoring Market Overview by Industry Sector
- 8.7.4. AUSTRALIA
- 8.7.4.1. Australia Application Performance Monitoring Market Overview by Component
- 8.7.4.2. Australia Application Performance Monitoring Market Overview by Deployment
- 8.7.4.3. Australia Application Performance Monitoring Market Overview by Company Type
- 8.7.4.4. Australia Application Performance Monitoring Market Overview by Access Type
- 8.7.4.5. Australia Application Performance Monitoring Market Overview by Industry Sector
- 8.7.5. SINGAPORE
- 8.7.5.1. Singaporean Application Performance Monitoring Market Overview by Component
- 8.7.5.2. Singaporean Application Performance Monitoring Market Overview by Deployment
- 8.7.5.3. Singaporean Application Performance Monitoring Market Overview by Company Type
- 8.7.5.4. Singaporean Application Performance Monitoring Market Overview by Access Type
- 8.7.5.5. Singaporean Application Performance Monitoring Market Overview by Industry Sector
- 8.7.6. SOUTH KOREA
- 8.7.6.1. South Korean Application Performance Monitoring Market Overview by Component
- 8.7.6.2. South Korean Application Performance Monitoring Market Overview by Deployment
- 8.7.6.3. South Korean Application Performance Monitoring Market Overview by Company Type
- 8.7.6.4. South Korean Application Performance Monitoring Market Overview by Access Type
- 8.7.6.5. South Korean Application Performance Monitoring Market Overview by Industry Sector
- 8.7.7. REST OF ASIA-PACIFIC
- 8.7.7.1. Rest of Asia-Pacific Application Performance Monitoring Market Overview by Component
- 8.7.7.2. Rest of Asia-Pacific Application Performance Monitoring Market Overview by Deployment
- 8.7.7.3. Rest of Asia-Pacific Application Performance Monitoring Market Overview by Company Type
- 8.7.7.4. Rest of Asia-Pacific Application Performance Monitoring Market Overview by Access Type
- 8.7.7.5. Rest of Asia-Pacific Application Performance Monitoring Market Overview by Industry Sector
- 8.7.1. CHINA
9. SOUTH AMERICA
- 9.1. South American Application Performance Monitoring Market Overview by Geographic Region
- 9.2. South American Application Performance Monitoring Market Overview by Component
- 9.3. South American Application Performance Monitoring Market Overview by Deployment
- 9.4. South American Application Performance Monitoring Market Overview by Company Type
- 9.5. South American Application Performance Monitoring Market Overview by Access Type
- 9.6. South American Application Performance Monitoring Market Overview by Industry Sector
- 9.7. Country-wise Analysis of South American Application Performance Monitoring Market
- 9.7.1. BRAZIL
- 9.7.1.1. Brazilian Application Performance Monitoring Market Overview by Component
- 9.7.1.2. Brazilian Application Performance Monitoring Market Overview by Deployment
- 9.7.1.3. Brazilian Application Performance Monitoring Market Overview by Company Type
- 9.7.1.4. Brazilian Application Performance Monitoring Market Overview by Access Type
- 9.7.1.5. Brazilian Application Performance Monitoring Market Overview by Industry Sector
- 9.7.2. ARGENTINA
- 9.7.2.1. Argentine Application Performance Monitoring Market Overview by Component
- 9.7.2.2. Argentine Application Performance Monitoring Market Overview by Deployment
- 9.7.2.3. Argentine Application Performance Monitoring Market Overview by Company Type
- 9.7.2.4. Argentine Application Performance Monitoring Market Overview by Access Type
- 9.7.2.5. Argentine Application Performance Monitoring Market Overview by Industry Sector
- 9.7.3. COLOMBIA
- 9.7.3.1. Colombian Application Performance Monitoring Market Overview by Component
- 9.7.3.2. Colombian Application Performance Monitoring Market Overview by Deployment
- 9.7.3.3. Colombian Application Performance Monitoring Market Overview by Company Type
- 9.7.3.4. Colombian Application Performance Monitoring Market Overview by Access Type
- 9.7.3.5. Colombian Application Performance Monitoring Market Overview by Industry Sector
- 9.7.4. CHILE
- 9.7.4.1. Chilean Application Performance Monitoring Market Overview by Component
- 9.7.4.2. Chilean Application Performance Monitoring Market Overview by Deployment
- 9.7.4.3. Chilean Application Performance Monitoring Market Overview by Company Type
- 9.7.4.4. Chilean Application Performance Monitoring Market Overview by Access Type
- 9.7.4.5. Chilean Application Performance Monitoring Market Overview by Industry Sector
- 9.7.5. PERU
- 9.7.5.1. Peruvian Application Performance Monitoring Market Overview by Component
- 9.7.5.2. Peruvian Application Performance Monitoring Market Overview by Deployment
- 9.7.5.3. Peruvian Application Performance Monitoring Market Overview by Company Type
- 9.7.5.4. Peruvian Application Performance Monitoring Market Overview by Access Type
- 9.7.5.5. Peruvian Application Performance Monitoring Market Overview by Industry Sector
- 9.7.6. REST OF SOUTH AMERICA
- 9.7.6.1. Rest of South America Application Performance Monitoring Market Overview by Component
- 9.7.6.2. Rest of South America Application Performance Monitoring Market Overview by Deployment
- 9.7.6.3. Rest of South America Application Performance Monitoring Market Overview by Company Type
- 9.7.6.4. Rest of South America Application Performance Monitoring Market Overview by Access Type
- 9.7.6.5. Rest of South America Application Performance Monitoring Market Overview by Industry Sector
- 9.7.1. BRAZIL
10. MIDDLE EAST & AFRICA
- 10.1. Middle East & Africa Application Performance Monitoring Market Overview by Geographic Region
- 10.2. Middle East & Africa Application Performance Monitoring Market Overview by Component
- 10.3. Middle East & Africa Application Performance Monitoring Market Overview by Deployment
- 10.4. Middle East & Africa Application Performance Monitoring Market Overview by Company Type
- 10.5. Middle East & Africa Application Performance Monitoring Market Overview by Access Type
- 10.6. Middle East & Africa Application Performance Monitoring Market Overview by Industry Sector
- 10.7. Country-wise Analysis of Middle East & Africa Application Performance Monitoring Market
- 10.7.1. THE UNITED ARAB EMIRATES
- 10.7.1.1. United Arab Emirates Application Performance Monitoring Market Overview by Component
- 10.7.1.2. United Arab Emirates Application Performance Monitoring Market Overview by Deployment
- 10.7.1.3. United Arab Emirates Application Performance Monitoring Market Overview by Company Type
- 10.7.1.4. United Arab Emirates Application Performance Monitoring Market Overview by Access Type
- 10.7.1.5. United Arab Emirates Application Performance Monitoring Market Overview by Industry Sector
- 10.7.2. SOUTH AFRICA
- 10.7.2.1. South African Application Performance Monitoring Market Overview by Component
- 10.7.2.2. South African Application Performance Monitoring Market Overview by Deployment
- 10.7.2.3. South African Application Performance Monitoring Market Overview by Company Type
- 10.7.2.4. South African Application Performance Monitoring Market Overview by Access Type
- 10.7.2.5. South African Application Performance Monitoring Market Overview by Industry Sector
- 10.7.3. EGYPT
- 10.7.3.1. Egyptian Application Performance Monitoring Market Overview by Component
- 10.7.3.2. Egyptian Application Performance Monitoring Market Overview by Deployment
- 10.7.3.3. Egyptian Application Performance Monitoring Market Overview by Company Type
- 10.7.3.4. Egyptian Application Performance Monitoring Market Overview by Access Type
- 10.7.3.5. Egyptian Application Performance Monitoring Market Overview by Industry Sector
- 10.7.4. SAUDI ARABIA
- 10.7.4.1. Saudi Arabian Application Performance Monitoring Market Overview by Component
- 10.7.4.2. Saudi Arabian Application Performance Monitoring Market Overview by Deployment
- 10.7.4.3. Saudi Arabian Application Performance Monitoring Market Overview by Company Type
- 10.7.4.4. Saudi Arabian Application Performance Monitoring Market Overview by Access Type
- 10.7.4.5. Saudi Arabian Application Performance Monitoring Market Overview by Industry Sector
- 10.7.5. MOROCCO
- 10.7.5.1. Moroccan Application Performance Monitoring Market Overview by Component
- 10.7.5.2. Moroccan Application Performance Monitoring Market Overview by Deployment
- 10.7.5.3. Moroccan Application Performance Monitoring Market Overview by Company Type
- 10.7.5.4. Moroccan Application Performance Monitoring Market Overview by Access Type
- 10.7.5.5. Moroccan Application Performance Monitoring Market Overview by Industry Sector
- 10.7.6. KUWAIT
- 10.7.6.1. Kuwaiti Application Performance Monitoring Market Overview by Component
- 10.7.6.2. Kuwaiti Application Performance Monitoring Market Overview by Deployment
- 10.7.6.3. Kuwaiti Application Performance Monitoring Market Overview by Company Type
- 10.7.6.4. Kuwaiti Application Performance Monitoring Market Overview by Access Type
- 10.7.6.5. Kuwaiti Application Performance Monitoring Market Overview by Industry Sector
- 10.7.7. QATAR
- 10.7.7.1. Qatari Application Performance Monitoring Market Overview by Component
- 10.7.7.2. Qatari Application Performance Monitoring Market Overview by Deployment
- 10.7.7.3. Qatari Application Performance Monitoring Market Overview by Company Type
- 10.7.7.4. Qatari Application Performance Monitoring Market Overview by Access Type
- 10.7.7.5. Qatari Application Performance Monitoring Market Overview by Industry Sector
- 10.7.8. REST OF MIDDLE EAST & AFRICA
- 10.7.8.1. Rest of Middle East & Africa Application Performance Monitoring Market Overview by Component
- 10.7.8.2. Rest of Middle East & Africa Application Performance Monitoring Market Overview by Deployment
- 10.7.8.3. Rest of Middle East & Africa Application Performance Monitoring Market Overview by Company Type
- 10.7.8.4. Rest of Middle East & Africa Application Performance Monitoring Market Overview by Access Type
- 10.7.8.5. Rest of Middle East & Africa Application Performance Monitoring Market Overview by Industry Sector
- 10.7.1. THE UNITED ARAB EMIRATES
PART C: ANNEXURE
- 1. RESEARCH METHODOLOGY
- 2. FEEDBACK
Charts & Graphs
PART A: GLOBAL MARKET PERSPECTIVE
- Chart 1: Global Application Performance Monitoring Market (2024 & 2030) by Geographic Region
- Chart 2: Global Application Performance Monitoring Market (2024 & 2030) by Component
- Chart 3: Global Application Performance Monitoring Market (2024 & 2030) by Deployment
- Chart 4: Global Application Performance Monitoring Market (2024 & 2030) by Company Type
- Chart 5: Global Application Performance Monitoring Market (2024 & 2030) by Access Type
- Chart 6: Global Application Performance Monitoring Market (2024 & 2030) by Industry Sector
- Chart 7: Global Application Performance Monitoring Market Share (2024) by Company
GLOBAL MARKET OVERVIEW
- Chart 8: Global Application Performance Monitoring Market Analysis (2021-2030) in US$ Million
- Chart 9: Global Application Performance Monitoring Market Analysis (2021-2030) by Component - Software and Services in US$ Million
- Chart 10: Glance at 2021, 2024 and 2030 Global Application Performance Monitoring Market Share (%) by Component - Software and Services
- Chart 11: Global Application Performance Monitoring Software Market Analysis (2021-2030) by Geographic Region - North America, Europe, Asia-Pacific, South America and Middle East & Africa in US$ Million
- Chart 12: Glance at 2021, 2024 and 2030 Global Application Performance Monitoring Software Market Share (%) by Geographic Region - North America, Europe, Asia-Pacific, South America and Middle East & Africa
- Chart 13: Global Application Performance Monitoring Services Market Analysis (2021-2030) by Geographic Region - North America, Europe, Asia-Pacific, South America and Middle East & Africa in US$ Million
- Chart 14: Glance at 2021, 2024 and 2030 Global Application Performance Monitoring Services Market Share (%) by Geographic Region - North America, Europe, Asia-Pacific, South America and Middle East & Africa
- Chart 15: Global Application Performance Monitoring Market Analysis (2021-2030) by Deployment - On-Premises and Cloud in US$ Million
- Chart 16: Glance at 2021, 2024 and 2030 Global Application Performance Monitoring Market Share (%) by Deployment - On-Premises and Cloud
- Chart 17: Global On-Premises Application Performance Monitoring Market Analysis (2021-2030) by Geographic Region - North America, Europe, Asia-Pacific, South America and Middle East & Africa in US$ Million
- Chart 18: Glance at 2021, 2024 and 2030 Global On-Premises Application Performance Monitoring Market Share (%) by Geographic Region - North America, Europe, Asia-Pacific, South America and Middle East & Africa
- Chart 19: Global Cloud-based Application Performance Monitoring Market Analysis (2021-2030) by Geographic Region - North America, Europe, Asia-Pacific, South America and Middle East & Africa in US$ Million
- Chart 20: Glance at 2021, 2024 and 2030 Global Cloud-based Application Performance Monitoring Market Share (%) by Geographic Region - North America, Europe, Asia-Pacific, South America and Middle East & Africa
- Chart 21: Global Application Performance Monitoring Market Analysis (2021-2030) by Company Type - Large Enterprises and SMEs in US$ Million
- Chart 22: Glance at 2021, 2024 and 2030 Global Application Performance Monitoring Market Share (%) by Company Type - Large Enterprises and SMEs
- Chart 23: Global Application Performance Monitoring Market Analysis (2021-2030) for Large Enterprises by Geographic Region - North America, Europe, Asia-Pacific, South America and Middle East & Africa in US$ Million
- Chart 24: Glance at 2021, 2024 and 2030 Global Application Performance Monitoring Market Share (%) for Large Enterprises by Geographic Region - North America, Europe, Asia-Pacific, South America and Middle East & Africa
- Chart 25: Global Application Performance Monitoring Market Analysis (2021-2030) for SMEs by Geographic Region - North America, Europe, Asia-Pacific, South America and Middle East & Africa in US$ Million
- Chart 26: Glance at 2021, 2024 and 2030 Global Application Performance Monitoring Market Share (%) for SMEs by Geographic Region - North America, Europe, Asia-Pacific, South America and Middle East & Africa
- Chart 27: Global Application Performance Monitoring Market Analysis (2021-2030) by Access Type - Web APM and Mobile APM in US$ Million
- Chart 28: Glance at 2021, 2024 and 2030 Global Application Performance Monitoring Market Share (%) by Access Type - Web APM and Mobile APM
- Chart 29: Global Web APM Market Analysis (2021-2030) by Geographic Region - North America, Europe, Asia-Pacific, South America and Middle East & Africa in US$ Million
- Chart 30: Glance at 2021, 2024 and 2030 Global Web APM Market Share (%) by Geographic Region - North America, Europe, Asia-Pacific, South America and Middle East & Africa
- Chart 31: Global Mobile APM Market Analysis (2021-2030) by Geographic Region - North America, Europe, Asia-Pacific, South America and Middle East & Africa in US$ Million
- Chart 32: Glance at 2021, 2024 and 2030 Global Mobile APM Market Share (%) by Geographic Region - North America, Europe, Asia-Pacific, South America and Middle East & Africa
- Chart 33: Global Application Performance Monitoring Market Analysis (2021-2030) by Industry Sector - IT & Communication, BFSI, Healthcare & Life Sciences, Media & Entertainment, Retail & Ecommerce, Energy & Utilities, Manufacturing, Education, Government, Transportation, Construction, Tourism & Hospitality and Others in US$ Million
- Chart 34: Glance at 2021, 2024 and 2030 Global Application Performance Monitoring Market Share (%) by Industry Sector - IT & Communication, BFSI, Healthcare & Life Sciences, Media & Entertainment, Retail & Ecommerce, Energy & Utilities, Manufacturing, Education, Government, Transportation, Construction, Tourism & Hospitality and Others
- Chart 35: Global Application Performance Monitoring Market Analysis (2021-2030) in IT & Communication Sector by Geographic Region - North America, Europe, Asia-Pacific, South America and Middle East & Africa in US$ Million
- Chart 36: Glance at 2021, 2024 and 2030 Global Application Performance Monitoring Market Share (%) in IT & Communication Sector by Geographic Region - North America, Europe, Asia-Pacific, South America and Middle East & Africa
- Chart 37: Global Application Performance Monitoring Market Analysis (2021-2030) in BFSI Sector by Geographic Region - North America, Europe, Asia-Pacific, South America and Middle East & Africa in US$ Million
- Chart 38: Glance at 2021, 2024 and 2030 Global Application Performance Monitoring Market Share (%) in BFSI Sector by Geographic Region - North America, Europe, Asia-Pacific, South America and Middle East & Africa
- Chart 39: Global Application Performance Monitoring Market Analysis (2021-2030) in Healthcare & Life Sciences Sector by Geographic Region - North America, Europe, Asia-Pacific, South America and Middle East & Africa in US$ Million
- Chart 40: Glance at 2021, 2024 and 2030 Global Application Performance Monitoring Market Share (%) in Healthcare & Life Sciences Sector by Geographic Region - North America, Europe, Asia-Pacific, South America and Middle East & Africa
- Chart 41: Global Application Performance Monitoring Market Analysis (2021-2030) in Media & Entertainment Sector by Geographic Region - North America, Europe, Asia-Pacific, South America and Middle East & Africa in US$ Million
- Chart 42: Glance at 2021, 2024 and 2030 Global Application Performance Monitoring Market Share (%) in Media & Entertainment Sector by Geographic Region - North America, Europe, Asia-Pacific, South America and Middle East & Africa
- Chart 43: Global Application Performance Monitoring Market Analysis (2021-2030) in Retail & Ecommerce Sector by Geographic Region - North America, Europe, Asia-Pacific, South America and Middle East & Africa in US$ Million
- Chart 44: Glance at 2021, 2024 and 2030 Global Application Performance Monitoring Market Share (%) in Retail & Ecommerce Sector by Geographic Region - North America, Europe, Asia-Pacific, South America and Middle East & Africa
- Chart 45: Global Application Performance Monitoring Market Analysis (2021-2030) in Energy & Utilities Sector by Geographic Region - North America, Europe, Asia-Pacific, South America and Middle East & Africa in US$ Million
- Chart 46: Glance at 2021, 2024 and 2030 Global Application Performance Monitoring Market Share (%) in Energy & Utilities Sector by Geographic Region - North America, Europe, Asia-Pacific, South America and Middle East & Africa
- Chart 47: Global Application Performance Monitoring Market Analysis (2021-2030) in Manufacturing Sector by Geographic Region - North America, Europe, Asia-Pacific, South America and Middle East & Africa in US$ Million
- Chart 48: Glance at 2021, 2024 and 2030 Global Application Performance Monitoring Market Share (%) in Manufacturing Sector by Geographic Region - North America, Europe, Asia-Pacific, South America and Middle East & Africa
- Chart 49: Global Application Performance Monitoring Market Analysis (2021-2030) in Education Sector by Geographic Region - North America, Europe, Asia-Pacific, South America and Middle East & Africa in US$ Million
- Chart 50: Glance at 2021, 2024 and 2030 Global Application Performance Monitoring Market Share (%) in Education Sector by Geographic Region - North America, Europe, Asia-Pacific, South America and Middle East & Africa
- Chart 51: Global Application Performance Monitoring Market Analysis (2021-2030) in Government Sector by Geographic Region - North America, Europe, Asia-Pacific, South America and Middle East & Africa in US$ Million
- Chart 52: Glance at 2021, 2024 and 2030 Global Application Performance Monitoring Market Share (%) in Government Sector by Geographic Region - North America, Europe, Asia-Pacific, South America and Middle East & Africa
- Chart 53: Global Application Performance Monitoring Market Analysis (2021-2030) in Transportation Sector by Geographic Region - North America, Europe, Asia-Pacific, South America and Middle East & Africa in US$ Million
- Chart 54: Glance at 2021, 2024 and 2030 Global Application Performance Monitoring Market Share (%) in Transportation Sector by Geographic Region - North America, Europe, Asia-Pacific, South America and Middle East & Africa
- Chart 55: Global Application Performance Monitoring Market Analysis (2021-2030) in Construction Sector by Geographic Region - North America, Europe, Asia-Pacific, South America and Middle East & Africa in US$ Million
- Chart 56: Glance at 2021, 2024 and 2030 Global Application Performance Monitoring Market Share (%) in Construction Sector by Geographic Region - North America, Europe, Asia-Pacific, South America and Middle East & Africa
- Chart 57: Global Application Performance Monitoring Market Analysis (2021-2030) in Tourism & Hospitality Sector by Geographic Region - North America, Europe, Asia-Pacific, South America and Middle East & Africa in US$ Million
- Chart 58: Glance at 2021, 2024 and 2030 Global Application Performance Monitoring Market Share (%) in Tourism & Hospitality Sector by Geographic Region - North America, Europe, Asia-Pacific, South America and Middle East & Africa
- Chart 59: Global Application Performance Monitoring Market Analysis (2021-2030) in Other Industry Sectors by Geographic Region - North America, Europe, Asia-Pacific, South America and Middle East & Africa in US$ Million
- Chart 60: Glance at 2021, 2024 and 2030 Global Application Performance Monitoring Market Share (%) in Other Industry Sectors by Geographic Region - North America, Europe, Asia-Pacific, South America and Middle East & Africa
PART B: REGIONAL MARKET PERSPECTIVE
- Chart 61: Global Application Performance Monitoring Market Analysis (2021-2030) by Geographic Region - North America, Europe, Asia-Pacific, South America and Middle East & Africa in US$ Million
- Chart 62: Glance at 2021, 2024 and 2030 Global Application Performance Monitoring Market Share (%) by Geographic Region - North America, Europe, Asia-Pacific, South America and Middle East & Africa
REGIONAL MARKET OVERVIEW
NORTH AMERICA
- Chart 63: North American Application Performance Monitoring Market Analysis (2021-2030) in US$ Million
- Chart 64: North American Application Performance Monitoring Market Analysis (2021-2030) by Geographic Region - United States, Canada and Mexico in US$ Million
- Chart 65: Glance at 2021, 2024 and 2030 North American Application Performance Monitoring Market Share (%) by Geographic Region - United States, Canada and Mexico
- Chart 66: North American Application Performance Monitoring Market Analysis (2021-2030) by Component - Software and Services in US$ Million
- Chart 67: Glance at 2021, 2024 and 2030 North American Application Performance Monitoring Market Share (%) by Component - Software and Services
- Chart 68: North American Application Performance Monitoring Market Analysis (2021-2030) by Deployment - On-Premises and Cloud in US$ Million
- Chart 69: Glance at 2021, 2024 and 2030 North American Application Performance Monitoring Market Share (%) by Deployment - On-Premises and Cloud
- Chart 70: North American Application Performance Monitoring Market Analysis (2021-2030) by Company Type - Large Enterprises and SMEs in US$ Million
- Chart 71: Glance at 2021, 2024 and 2030 North American Application Performance Monitoring Market Share (%) by Company Type - Large Enterprises and SMEs
- Chart 72: North American Application Performance Monitoring Market Analysis (2021-2030) by Access Type - Web APM and Mobile APM in US$ Million
- Chart 73: Glance at 2021, 2024 and 2030 North American Application Performance Monitoring Market Share (%) by Access Type - Web APM and Mobile APM
- Chart 74: North American Application Performance Monitoring Market Analysis (2021-2030) by Industry Sector - IT & Communication, BFSI, Healthcare & Life Sciences, Media & Entertainment, Retail & Ecommerce, Energy & Utilities, Manufacturing, Education, Government, Transportation, Construction, Tourism & Hospitality and Others in US$ Million
- Chart 75: Glance at 2021, 2024 and 2030 North American Application Performance Monitoring Market Share (%) by Industry Sector - IT & Communication, BFSI, Healthcare & Life Sciences, Media & Entertainment, Retail & Ecommerce, Energy & Utilities, Manufacturing, Education, Government, Transportation, Construction, Tourism & Hospitality and Others
THE UNITED STATES
- Chart 76: United States Application Performance Monitoring Market Analysis (2021-2030) by Component - Software and Services in US$ Million
- Chart 77: Glance at 2021, 2024 and 2030 United States Application Performance Monitoring Market Share (%) by Component - Software and Services
- Chart 78: United States Application Performance Monitoring Market Analysis (2021-2030) by Deployment - On-Premises and Cloud in US$ Million
- Chart 79: Glance at 2021, 2024 and 2030 United States Application Performance Monitoring Market Share (%) by Deployment - On-Premises and Cloud
- Chart 80: United States Application Performance Monitoring Market Analysis (2021-2030) by Company Type - Large Enterprises and SMEs in US$ Million
- Chart 81: Glance at 2021, 2024 and 2030 United States Application Performance Monitoring Market Share (%) by Company Type - Large Enterprises and SMEs
- Chart 82: United States Application Performance Monitoring Market Analysis (2021-2030) by Access Type - Web APM and Mobile APM in US$ Million
- Chart 83: Glance at 2021, 2024 and 2030 United States Application Performance Monitoring Market Share (%) by Access Type - Web APM and Mobile APM
- Chart 84: United States Application Performance Monitoring Market Analysis (2021-2030) by Industry Sector - IT & Communication, BFSI, Healthcare & Life Sciences, Media & Entertainment, Retail & Ecommerce, Energy & Utilities, Manufacturing, Education, Government, Transportation, Construction, Tourism & Hospitality and Others in US$ Million
- Chart 85: Glance at 2021, 2024 and 2030 United States Application Performance Monitoring Market Share (%) by Industry Sector - IT & Communication, BFSI, Healthcare & Life Sciences, Media & Entertainment, Retail & Ecommerce, Energy & Utilities, Manufacturing, Education, Government, Transportation, Construction, Tourism & Hospitality and Others
CANADA
- Chart 86: Canadian Application Performance Monitoring Market Analysis (2021-2030) by Component - Software and Services in US$ Million
- Chart 87: Glance at 2021, 2024 and 2030 Canadian Application Performance Monitoring Market Share (%) by Component - Software and Services
- Chart 88: Canadian Application Performance Monitoring Market Analysis (2021-2030) by Deployment - On-Premises and Cloud in US$ Million
- Chart 89: Glance at 2021, 2024 and 2030 Canadian Application Performance Monitoring Market Share (%) by Deployment - On-Premises and Cloud
- Chart 90: Canadian Application Performance Monitoring Market Analysis (2021-2030) by Company Type - Large Enterprises and SMEs in US$ Million
- Chart 91: Glance at 2021, 2024 and 2030 Canadian Application Performance Monitoring Market Share (%) by Company Type - Large Enterprises and SMEs
- Chart 92: Canadian Application Performance Monitoring Market Analysis (2021-2030) by Access Type - Web APM and Mobile APM in US$ Million
- Chart 93: Glance at 2021, 2024 and 2030 Canadian Application Performance Monitoring Market Share (%) by Access Type - Web APM and Mobile APM
- Chart 94: Canadian Application Performance Monitoring Market Analysis (2021-2030) by Industry Sector - IT & Communication, BFSI, Healthcare & Life Sciences, Media & Entertainment, Retail & Ecommerce, Energy & Utilities, Manufacturing, Education, Government, Transportation, Construction, Tourism & Hospitality and Others in US$ Million
- Chart 95: Glance at 2021, 2024 and 2030 Canadian Application Performance Monitoring Market Share (%) by Industry Sector - IT & Communication, BFSI, Healthcare & Life Sciences, Media & Entertainment, Retail & Ecommerce, Energy & Utilities, Manufacturing, Education, Government, Transportation, Construction, Tourism & Hospitality and Others
MEXICO
- Chart 96: Mexican Application Performance Monitoring Market Analysis (2021-2030) by Component - Software and Services in US$ Million
- Chart 97: Glance at 2021, 2024 and 2030 Mexican Application Performance Monitoring Market Share (%) by Component - Software and Services
- Chart 98: Mexican Application Performance Monitoring Market Analysis (2021-2030) by Deployment - On-Premises and Cloud in US$ Million
- Chart 99: Glance at 2021, 2024 and 2030 Mexican Application Performance Monitoring Market Share (%) by Deployment - On-Premises and Cloud
- Chart 100: Mexican Application Performance Monitoring Market Analysis (2021-2030) by Company Type - Large Enterprises and SMEs in US$ Million
- Chart 101: Glance at 2021, 2024 and 2030 Mexican Application Performance Monitoring Market Share (%) by Company Type - Large Enterprises and SMEs
- Chart 102: Mexican Application Performance Monitoring Market Analysis (2021-2030) by Access Type - Web APM and Mobile APM in US$ Million
- Chart 103: Glance at 2021, 2024 and 2030 Mexican Application Performance Monitoring Market Share (%) by Access Type - Web APM and Mobile APM
- Chart 104: Mexican Application Performance Monitoring Market Analysis (2021-2030) by Industry Sector - IT & Communication, BFSI, Healthcare & Life Sciences, Media & Entertainment, Retail & Ecommerce, Energy & Utilities, Manufacturing, Education, Government, Transportation, Construction, Tourism & Hospitality and Others in US$ Million
- Chart 105: Glance at 2021, 2024 and 2030 Mexican Application Performance Monitoring Market Share (%) by Industry Sector - IT & Communication, BFSI, Healthcare & Life Sciences, Media & Entertainment, Retail & Ecommerce, Energy & Utilities, Manufacturing, Education, Government, Transportation, Construction, Tourism & Hospitality and Others
EUROPE
- Chart 106: European Application Performance Monitoring Market Analysis (2021-2030) in US$ Million
- Chart 107: European Application Performance Monitoring Market Analysis (2021-2030) by Geographic Region - Germany, United Kingdom, France, Italy, Netherlands, Spain, Russia, Switzerland and Rest of Europe in US$ Million
- Chart 108: Glance at 2021, 2024 and 2030 European Application Performance Monitoring Market Share (%) by Geographic Region - Germany, United Kingdom, France, Italy, Netherlands, Spain, Russia, Switzerland and Rest of Europe
- Chart 109: European Application Performance Monitoring Market Analysis (2021-2030) by Component - Software and Services in US$ Million
- Chart 110: Glance at 2021, 2024 and 2030 European Application Performance Monitoring Market Share (%) by Component - Software and Services
- Chart 111: European Application Performance Monitoring Market Analysis (2021-2030) by Deployment - On-Premises and Cloud in US$ Million
- Chart 112: Glance at 2021, 2024 and 2030 European Application Performance Monitoring Market Share (%) by Deployment - On-Premises and Cloud
- Chart 113: European Application Performance Monitoring Market Analysis (2021-2030) by Company Type - Large Enterprises and SMEs in US$ Million
- Chart 114: Glance at 2021, 2024 and 2030 European Application Performance Monitoring Market Share (%) by Company Type - Large Enterprises and SMEs
- Chart 115: European Application Performance Monitoring Market Analysis (2021-2030) by Access Type - Web APM and Mobile APM in US$ Million
- Chart 116: Glance at 2021, 2024 and 2030 European Application Performance Monitoring Market Share (%) by Access Type - Web APM and Mobile APM
- Chart 117: European Application Performance Monitoring Market Analysis (2021-2030) by Industry Sector - IT & Communication, BFSI, Healthcare & Life Sciences, Media & Entertainment, Retail & Ecommerce, Energy & Utilities, Manufacturing, Education, Government, Transportation, Construction, Tourism & Hospitality and Others in US$ Million
- Chart 118: Glance at 2021, 2024 and 2030 European Application Performance Monitoring Market Share (%) by Industry Sector - IT & Communication, BFSI, Healthcare & Life Sciences, Media & Entertainment, Retail & Ecommerce, Energy & Utilities, Manufacturing, Education, Government, Transportation, Construction, Tourism & Hospitality and Others
GERMANY
- Chart 119: German Application Performance Monitoring Market Analysis (2021-2030) by Component - Software and Services in US$ Million
- Chart 120: Glance at 2021, 2024 and 2030 German Application Performance Monitoring Market Share (%) by Component - Software and Services
- Chart 121: German Application Performance Monitoring Market Analysis (2021-2030) by Deployment - On-Premises and Cloud in US$ Million
- Chart 122: Glance at 2021, 2024 and 2030 German Application Performance Monitoring Market Share (%) by Deployment - On-Premises and Cloud
- Chart 123: German Application Performance Monitoring Market Analysis (2021-2030) by Company Type - Large Enterprises and SMEs in US$ Million
- Chart 124: Glance at 2021, 2024 and 2030 German Application Performance Monitoring Market Share (%) by Company Type - Large Enterprises and SMEs
- Chart 125: German Application Performance Monitoring Market Analysis (2021-2030) by Access Type - Web APM and Mobile APM in US$ Million
- Chart 126: Glance at 2021, 2024 and 2030 German Application Performance Monitoring Market Share (%) by Access Type - Web APM and Mobile APM
- Chart 127: German Application Performance Monitoring Market Analysis (2021-2030) by Industry Sector - IT & Communication, BFSI, Healthcare & Life Sciences, Media & Entertainment, Retail & Ecommerce, Energy & Utilities, Manufacturing, Education, Government, Transportation, Construction, Tourism & Hospitality and Others in US$ Million
- Chart 128: Glance at 2021, 2024 and 2030 German Application Performance Monitoring Market Share (%) by Industry Sector - IT & Communication, BFSI, Healthcare & Life Sciences, Media & Entertainment, Retail & Ecommerce, Energy & Utilities, Manufacturing, Education, Government, Transportation, Construction, Tourism & Hospitality and Others
THE UNITED KINGDOM
- Chart 129: United Kingdom Application Performance Monitoring Market Analysis (2021-2030) by Component - Software and Services in US$ Million
- Chart 130: Glance at 2021, 2024 and 2030 United Kingdom Application Performance Monitoring Market Share (%) by Component - Software and Services
- Chart 131: United Kingdom Application Performance Monitoring Market Analysis (2021-2030) by Deployment - On-Premises and Cloud in US$ Million
- Chart 132: Glance at 2021, 2024 and 2030 United Kingdom Application Performance Monitoring Market Share (%) by Deployment - On-Premises and Cloud
- Chart 133: United Kingdom Application Performance Monitoring Market Analysis (2021-2030) by Company Type - Large Enterprises and SMEs in US$ Million
- Chart 134: Glance at 2021, 2024 and 2030 United Kingdom Application Performance Monitoring Market Share (%) by Company Type - Large Enterprises and SMEs
- Chart 135: United Kingdom Application Performance Monitoring Market Analysis (2021-2030) by Access Type - Web APM and Mobile APM in US$ Million
- Chart 136: Glance at 2021, 2024 and 2030 United Kingdom Application Performance Monitoring Market Share (%) by Access Type - Web APM and Mobile APM
- Chart 137: United Kingdom Application Performance Monitoring Market Analysis (2021-2030) by Industry Sector - IT & Communication, BFSI, Healthcare & Life Sciences, Media & Entertainment, Retail & Ecommerce, Energy & Utilities, Manufacturing, Education, Government, Transportation, Construction, Tourism & Hospitality and Others in US$ Million
- Chart 138: Glance at 2021, 2024 and 2030 United Kingdom Application Performance Monitoring Market Share (%) by Industry Sector - IT & Communication, BFSI, Healthcare & Life Sciences, Media & Entertainment, Retail & Ecommerce, Energy & Utilities, Manufacturing, Education, Government, Transportation, Construction, Tourism & Hospitality and Others
FRANCE
- Chart 139: French Application Performance Monitoring Market Analysis (2021-2030) by Component - Software and Services in US$ Million
- Chart 140: Glance at 2021, 2024 and 2030 French Application Performance Monitoring Market Share (%) by Component - Software and Services
- Chart 141: French Application Performance Monitoring Market Analysis (2021-2030) by Deployment - On-Premises and Cloud in US$ Million
- Chart 142: Glance at 2021, 2024 and 2030 French Application Performance Monitoring Market Share (%) by Deployment - On-Premises and Cloud
- Chart 143: French Application Performance Monitoring Market Analysis (2021-2030) by Company Type - Large Enterprises and SMEs in US$ Million
- Chart 144: Glance at 2021, 2024 and 2030 French Application Performance Monitoring Market Share (%) by Company Type - Large Enterprises and SMEs
- Chart 145: French Application Performance Monitoring Market Analysis (2021-2030) by Access Type - Web APM and Mobile APM in US$ Million
- Chart 146: Glance at 2021, 2024 and 2030 French Application Performance Monitoring Market Share (%) by Access Type - Web APM and Mobile APM
- Chart 147: French Application Performance Monitoring Market Analysis (2021-2030) by Industry Sector - IT & Communication, BFSI, Healthcare & Life Sciences, Media & Entertainment, Retail & Ecommerce, Energy & Utilities, Manufacturing, Education, Government, Transportation, Construction, Tourism & Hospitality and Others in US$ Million
- Chart 148: Glance at 2021, 2024 and 2030 French Application Performance Monitoring Market Share (%) by Industry Sector - IT & Communication, BFSI, Healthcare & Life Sciences, Media & Entertainment, Retail & Ecommerce, Energy & Utilities, Manufacturing, Education, Government, Transportation, Construction, Tourism & Hospitality and Others
ITALY
- Chart 149: Italian Application Performance Monitoring Market Analysis (2021-2030) by Component - Software and Services in US$ Million
- Chart 150: Glance at 2021, 2024 and 2030 Italian Application Performance Monitoring Market Share (%) by Component - Software and Services
- Chart 151: Italian Application Performance Monitoring Market Analysis (2021-2030) by Deployment - On-Premises and Cloud in US$ Million
- Chart 152: Glance at 2021, 2024 and 2030 Italian Application Performance Monitoring Market Share (%) by Deployment - On-Premises and Cloud
- Chart 153: Italian Application Performance Monitoring Market Analysis (2021-2030) by Company Type - Large Enterprises and SMEs in US$ Million
- Chart 154: Glance at 2021, 2024 and 2030 Italian Application Performance Monitoring Market Share (%) by Company Type - Large Enterprises and SMEs
- Chart 155: Italian Application Performance Monitoring Market Analysis (2021-2030) by Access Type - Web APM and Mobile APM in US$ Million
- Chart 156: Glance at 2021, 2024 and 2030 Italian Application Performance Monitoring Market Share (%) by Access Type - Web APM and Mobile APM
- Chart 157: Italian Application Performance Monitoring Market Analysis (2021-2030) by Industry Sector - IT & Communication, BFSI, Healthcare & Life Sciences, Media & Entertainment, Retail & Ecommerce, Energy & Utilities, Manufacturing, Education, Government, Transportation, Construction, Tourism & Hospitality and Others in US$ Million
- Chart 158: Glance at 2021, 2024 and 2030 Italian Application Performance Monitoring Market Share (%) by Industry Sector - IT & Communication, BFSI, Healthcare & Life Sciences, Media & Entertainment, Retail & Ecommerce, Energy & Utilities, Manufacturing, Education, Government, Transportation, Construction, Tourism & Hospitality and Others
THE NETHERLANDS
- Chart 159: Dutch Application Performance Monitoring Market Analysis (2021-2030) by Component - Software and Services in US$ Million
- Chart 160: Glance at 2021, 2024 and 2030 Dutch Application Performance Monitoring Market Share (%) by Component - Software and Services
- Chart 161: Dutch Application Performance Monitoring Market Analysis (2021-2030) by Deployment - On-Premises and Cloud in US$ Million
- Chart 162: Glance at 2021, 2024 and 2030 Dutch Application Performance Monitoring Market Share (%) by Deployment - On-Premises and Cloud
- Chart 163: Dutch Application Performance Monitoring Market Analysis (2021-2030) by Company Type - Large Enterprises and SMEs in US$ Million
- Chart 164: Glance at 2021, 2024 and 2030 Dutch Application Performance Monitoring Market Share (%) by Company Type - Large Enterprises and SMEs
- Chart 165: Dutch Application Performance Monitoring Market Analysis (2021-2030) by Access Type - Web APM and Mobile APM in US$ Million
- Chart 166: Glance at 2021, 2024 and 2030 Dutch Application Performance Monitoring Market Share (%) by Access Type - Web APM and Mobile APM
- Chart 167: Dutch Application Performance Monitoring Market Analysis (2021-2030) by Industry Sector - IT & Communication, BFSI, Healthcare & Life Sciences, Media & Entertainment, Retail & Ecommerce, Energy & Utilities, Manufacturing, Education, Government, Transportation, Construction, Tourism & Hospitality and Others in US$ Million
- Chart 168: Glance at 2021, 2024 and 2030 Dutch Application Performance Monitoring Market Share (%) by Industry Sector - IT & Communication, BFSI, Healthcare & Life Sciences, Media & Entertainment, Retail & Ecommerce, Energy & Utilities, Manufacturing, Education, Government, Transportation, Construction, Tourism & Hospitality and Others
SPAIN
- Chart 169: Spanish Application Performance Monitoring Market Analysis (2021-2030) by Component - Software and Services in US$ Million
- Chart 170: Glance at 2021, 2024 and 2030 Spanish Application Performance Monitoring Market Share (%) by Component - Software and Services
- Chart 171: Spanish Application Performance Monitoring Market Analysis (2021-2030) by Deployment - On-Premises and Cloud in US$ Million
- Chart 172: Glance at 2021, 2024 and 2030 Spanish Application Performance Monitoring Market Share (%) by Deployment - On-Premises and Cloud
- Chart 173: Spanish Application Performance Monitoring Market Analysis (2021-2030) by Company Type - Large Enterprises and SMEs in US$ Million
- Chart 174: Glance at 2021, 2024 and 2030 Spanish Application Performance Monitoring Market Share (%) by Company Type - Large Enterprises and SMEs
- Chart 175: Spanish Application Performance Monitoring Market Analysis (2021-2030) by Access Type - Web APM and Mobile APM in US$ Million
- Chart 176: Glance at 2021, 2024 and 2030 Spanish Application Performance Monitoring Market Share (%) by Access Type - Web APM and Mobile APM
- Chart 177: Spanish Application Performance Monitoring Market Analysis (2021-2030) by Industry Sector - IT & Communication, BFSI, Healthcare & Life Sciences, Media & Entertainment, Retail & Ecommerce, Energy & Utilities, Manufacturing, Education, Government, Transportation, Construction, Tourism & Hospitality and Others in US$ Million
- Chart 178: Glance at 2021, 2024 and 2030 Spanish Application Performance Monitoring Market Share (%) by Industry Sector - IT & Communication, BFSI, Healthcare & Life Sciences, Media & Entertainment, Retail & Ecommerce, Energy & Utilities, Manufacturing, Education, Government, Transportation, Construction, Tourism & Hospitality and Others
RUSSIA
- Chart 179: Russian Application Performance Monitoring Market Analysis (2021-2030) by Component - Software and Services in US$ Million
- Chart 180: Glance at 2021, 2024 and 2030 Russian Application Performance Monitoring Market Share (%) by Component - Software and Services
- Chart 181: Russian Application Performance Monitoring Market Analysis (2021-2030) by Deployment - On-Premises and Cloud in US$ Million
- Chart 182: Glance at 2021, 2024 and 2030 Russian Application Performance Monitoring Market Share (%) by Deployment - On-Premises and Cloud
- Chart 183: Russian Application Performance Monitoring Market Analysis (2021-2030) by Company Type - Large Enterprises and SMEs in US$ Million
- Chart 184: Glance at 2021, 2024 and 2030 Russian Application Performance Monitoring Market Share (%) by Company Type - Large Enterprises and SMEs
- Chart 185: Russian Application Performance Monitoring Market Analysis (2021-2030) by Access Type - Web APM and Mobile APM in US$ Million
- Chart 186: Glance at 2021, 2024 and 2030 Russian Application Performance Monitoring Market Share (%) by Access Type - Web APM and Mobile APM
- Chart 187: Russian Application Performance Monitoring Market Analysis (2021-2030) by Industry Sector - IT & Communication, BFSI, Healthcare & Life Sciences, Media & Entertainment, Retail & Ecommerce, Energy & Utilities, Manufacturing, Education, Government, Transportation, Construction, Tourism & Hospitality and Others in US$ Million
- Chart 188: Glance at 2021, 2024 and 2030 Russian Application Performance Monitoring Market Share (%) by Industry Sector - IT & Communication, BFSI, Healthcare & Life Sciences, Media & Entertainment, Retail & Ecommerce, Energy & Utilities, Manufacturing, Education, Government, Transportation, Construction, Tourism & Hospitality and Others
SWITZERLAND
- Chart 189: Swiss Application Performance Monitoring Market Analysis (2021-2030) by Component - Software and Services in US$ Million
- Chart 190: Glance at 2021, 2024 and 2030 Swiss Application Performance Monitoring Market Share (%) by Component - Software and Services
- Chart 191: Swiss Application Performance Monitoring Market Analysis (2021-2030) by Deployment - On-Premises and Cloud in US$ Million
- Chart 192: Glance at 2021, 2024 and 2030 Swiss Application Performance Monitoring Market Share (%) by Deployment - On-Premises and Cloud
- Chart 193: Swiss Application Performance Monitoring Market Analysis (2021-2030) by Company Type - Large Enterprises and SMEs in US$ Million
- Chart 194: Glance at 2021, 2024 and 2030 Swiss Application Performance Monitoring Market Share (%) by Company Type - Large Enterprises and SMEs
- Chart 195: Swiss Application Performance Monitoring Market Analysis (2021-2030) by Access Type - Web APM and Mobile APM in US$ Million
- Chart 196: Glance at 2021, 2024 and 2030 Swiss Application Performance Monitoring Market Share (%) by Access Type - Web APM and Mobile APM
- Chart 197: Swiss Application Performance Monitoring Market Analysis (2021-2030) by Industry Sector - IT & Communication, BFSI, Healthcare & Life Sciences, Media & Entertainment, Retail & Ecommerce, Energy & Utilities, Manufacturing, Education, Government, Transportation, Construction, Tourism & Hospitality and Others in US$ Million
- Chart 198: Glance at 2021, 2024 and 2030 Swiss Application Performance Monitoring Market Share (%) by Industry Sector - IT & Communication, BFSI, Healthcare & Life Sciences, Media & Entertainment, Retail & Ecommerce, Energy & Utilities, Manufacturing, Education, Government, Transportation, Construction, Tourism & Hospitality and Others
REST OF EUROPE
- Chart 199: Rest of Europe Application Performance Monitoring Market Analysis (2021-2030) by Component - Software and Services in US$ Million
- Chart 200: Glance at 2021, 2024 and 2030 Rest of Europe Application Performance Monitoring Market Share (%) by Component - Software and Services
- Chart 201: Rest of Europe Application Performance Monitoring Market Analysis (2021-2030) by Deployment - On-Premises and Cloud in US$ Million
- Chart 202: Glance at 2021, 2024 and 2030 Rest of Europe Application Performance Monitoring Market Share (%) by Deployment - On-Premises and Cloud
- Chart 203: Rest of Europe Application Performance Monitoring Market Analysis (2021-2030) by Company Type - Large Enterprises and SMEs in US$ Million
- Chart 204: Glance at 2021, 2024 and 2030 Rest of Europe Application Performance Monitoring Market Share (%) by Company Type - Large Enterprises and SMEs
- Chart 205: Rest of Europe Application Performance Monitoring Market Analysis (2021-2030) by Access Type - Web APM and Mobile APM in US$ Million
- Chart 206: Glance at 2021, 2024 and 2030 Rest of Europe Application Performance Monitoring Market Share (%) by Access Type - Web APM and Mobile APM
- Chart 207: Rest of Europe Application Performance Monitoring Market Analysis (2021-2030) by Industry Sector - IT & Communication, BFSI, Healthcare & Life Sciences, Media & Entertainment, Retail & Ecommerce, Energy & Utilities, Manufacturing, Education, Government, Transportation, Construction, Tourism & Hospitality and Others in US$ Million
- Chart 208: Glance at 2021, 2024 and 2030 Rest of Europe Application Performance Monitoring Market Share (%) by Industry Sector - IT & Communication, BFSI, Healthcare & Life Sciences, Media & Entertainment, Retail & Ecommerce, Energy & Utilities, Manufacturing, Education, Government, Transportation, Construction, Tourism & Hospitality and Others
ASIA-PACIFIC
- Chart 209: Asia-Pacific Application Performance Monitoring Market Analysis (2021-2030) in US$ Million
- Chart 210: Asia-Pacific Application Performance Monitoring Market Analysis (2021-2030) by Geographic Region - China, Japan, India, Australia, Singapore, South Korea and Rest of Asia-Pacific in US$ Million
- Chart 211: Glance at 2021, 2024 and 2030 Asia-Pacific Application Performance Monitoring Market Share (%) by Geographic Region - China, Japan, India, Australia, Singapore, South Korea and Rest of Asia-Pacific
- Chart 212: Asia-Pacific Application Performance Monitoring Market Analysis (2021-2030) by Component - Software and Services in US$ Million
- Chart 213: Glance at 2021, 2024 and 2030 Asia-Pacific Application Performance Monitoring Market Share (%) by Component - Software and Services
- Chart 214: Asia-Pacific Application Performance Monitoring Market Analysis (2021-2030) by Deployment - On-Premises and Cloud in US$ Million
- Chart 215: Glance at 2021, 2024 and 2030 Asia-Pacific Application Performance Monitoring Market Share (%) by Deployment - On-Premises and Cloud
- Chart 216: Asia-Pacific Application Performance Monitoring Market Analysis (2021-2030) by Company Type - Large Enterprises and SMEs in US$ Million
- Chart 217: Glance at 2021, 2024 and 2030 Asia-Pacific Application Performance Monitoring Market Share (%) by Company Type - Large Enterprises and SMEs
- Chart 218: Asia-Pacific Application Performance Monitoring Market Analysis (2021-2030) by Access Type - Web APM and Mobile APM in US$ Million
- Chart 219: Glance at 2021, 2024 and 2030 Asia-Pacific Application Performance Monitoring Market Share (%) by Access Type - Web APM and Mobile APM
- Chart 220: Asia-Pacific Application Performance Monitoring Market Analysis (2021-2030) by Industry Sector - IT & Communication, BFSI, Healthcare & Life Sciences, Media & Entertainment, Retail & Ecommerce, Energy & Utilities, Manufacturing, Education, Government, Transportation, Construction, Tourism & Hospitality and Others in US$ Million
- Chart 221: Glance at 2021, 2024 and 2030 Asia-Pacific Application Performance Monitoring Market Share (%) by Industry Sector - IT & Communication, BFSI, Healthcare & Life Sciences, Media & Entertainment, Retail & Ecommerce, Energy & Utilities, Manufacturing, Education, Government, Transportation, Construction, Tourism & Hospitality and Others
CHINA
- Chart 222: Chinese Application Performance Monitoring Market Analysis (2021-2030) by Component - Software and Services in US$ Million
- Chart 223: Glance at 2021, 2024 and 2030 Chinese Application Performance Monitoring Market Share (%) by Component - Software and Services
- Chart 224: Chinese Application Performance Monitoring Market Analysis (2021-2030) by Deployment - On-Premises and Cloud in US$ Million
- Chart 225: Glance at 2021, 2024 and 2030 Chinese Application Performance Monitoring Market Share (%) by Deployment - On-Premises and Cloud
- Chart 226: Chinese Application Performance Monitoring Market Analysis (2021-2030) by Company Type - Large Enterprises and SMEs in US$ Million
- Chart 227: Glance at 2021, 2024 and 2030 Chinese Application Performance Monitoring Market Share (%) by Company Type - Large Enterprises and SMEs
- Chart 228: Chinese Application Performance Monitoring Market Analysis (2021-2030) by Access Type - Web APM and Mobile APM in US$ Million
- Chart 229: Glance at 2021, 2024 and 2030 Chinese Application Performance Monitoring Market Share (%) by Access Type - Web APM and Mobile APM
- Chart 230: Chinese Application Performance Monitoring Market Analysis (2021-2030) by Industry Sector - IT & Communication, BFSI, Healthcare & Life Sciences, Media & Entertainment, Retail & Ecommerce, Energy & Utilities, Manufacturing, Education, Government, Transportation, Construction, Tourism & Hospitality and Others in US$ Million
- Chart 231: Glance at 2021, 2024 and 2030 Chinese Application Performance Monitoring Market Share (%) by Industry Sector - IT & Communication, BFSI, Healthcare & Life Sciences, Media & Entertainment, Retail & Ecommerce, Energy & Utilities, Manufacturing, Education, Government, Transportation, Construction, Tourism & Hospitality and Others
JAPAN
- Chart 232: Japanese Application Performance Monitoring Market Analysis (2021-2030) by Component - Software and Services in US$ Million
- Chart 233: Glance at 2021, 2024 and 2030 Japanese Application Performance Monitoring Market Share (%) by Component - Software and Services
- Chart 234: Japanese Application Performance Monitoring Market Analysis (2021-2030) by Deployment - On-Premises and Cloud in US$ Million
- Chart 235: Glance at 2021, 2024 and 2030 Japanese Application Performance Monitoring Market Share (%) by Deployment - On-Premises and Cloud
- Chart 236: Japanese Application Performance Monitoring Market Analysis (2021-2030) by Company Type - Large Enterprises and SMEs in US$ Million
- Chart 237: Glance at 2021, 2024 and 2030 Japanese Application Performance Monitoring Market Share (%) by Company Type - Large Enterprises and SMEs
- Chart 238: Japanese Application Performance Monitoring Market Analysis (2021-2030) by Access Type - Web APM and Mobile APM in US$ Million
- Chart 239: Glance at 2021, 2024 and 2030 Japanese Application Performance Monitoring Market Share (%) by Access Type - Web APM and Mobile APM
- Chart 240: Japanese Application Performance Monitoring Market Analysis (2021-2030) by Industry Sector - IT & Communication, BFSI, Healthcare & Life Sciences, Media & Entertainment, Retail & Ecommerce, Energy & Utilities, Manufacturing, Education, Government, Transportation, Construction, Tourism & Hospitality and Others in US$ Million
- Chart 241: Glance at 2021, 2024 and 2030 Japanese Application Performance Monitoring Market Share (%) by Industry Sector - IT & Communication, BFSI, Healthcare & Life Sciences, Media & Entertainment, Retail & Ecommerce, Energy & Utilities, Manufacturing, Education, Government, Transportation, Construction, Tourism & Hospitality and Others
INDIA
- Chart 242: Indian Application Performance Monitoring Market Analysis (2021-2030) by Component - Software and Services in US$ Million
- Chart 243: Glance at 2021, 2024 and 2030 Indian Application Performance Monitoring Market Share (%) by Component - Software and Services
- Chart 244: Indian Application Performance Monitoring Market Analysis (2021-2030) by Deployment - On-Premises and Cloud in US$ Million
- Chart 245: Glance at 2021, 2024 and 2030 Indian Application Performance Monitoring Market Share (%) by Deployment - On-Premises and Cloud
- Chart 246: Indian Application Performance Monitoring Market Analysis (2021-2030) by Company Type - Large Enterprises and SMEs in US$ Million
- Chart 247: Glance at 2021, 2024 and 2030 Indian Application Performance Monitoring Market Share (%) by Company Type - Large Enterprises and SMEs
- Chart 248: Indian Application Performance Monitoring Market Analysis (2021-2030) by Access Type - Web APM and Mobile APM in US$ Million
- Chart 249: Glance at 2021, 2024 and 2030 Indian Application Performance Monitoring Market Share (%) by Access Type - Web APM and Mobile APM
- Chart 250: Indian Application Performance Monitoring Market Analysis (2021-2030) by Industry Sector - IT & Communication, BFSI, Healthcare & Life Sciences, Media & Entertainment, Retail & Ecommerce, Energy & Utilities, Manufacturing, Education, Government, Transportation, Construction, Tourism & Hospitality and Others in US$ Million
- Chart 251: Glance at 2021, 2024 and 2030 Indian Application Performance Monitoring Market Share (%) by Industry Sector - IT & Communication, BFSI, Healthcare & Life Sciences, Media & Entertainment, Retail & Ecommerce, Energy & Utilities, Manufacturing, Education, Government, Transportation, Construction, Tourism & Hospitality and Others
AUSTRALIA
- Chart 252: Australia Application Performance Monitoring Market Analysis (2021-2030) by Component - Software and Services in US$ Million
- Chart 253: Glance at 2021, 2024 and 2030 Australia Application Performance Monitoring Market Share (%) by Component - Software and Services
- Chart 254: Australia Application Performance Monitoring Market Analysis (2021-2030) by Deployment - On-Premises and Cloud in US$ Million
- Chart 255: Glance at 2021, 2024 and 2030 Australia Application Performance Monitoring Market Share (%) by Deployment - On-Premises and Cloud
- Chart 256: Australia Application Performance Monitoring Market Analysis (2021-2030) by Company Type - Large Enterprises and SMEs in US$ Million
- Chart 257: Glance at 2021, 2024 and 2030 Australia Application Performance Monitoring Market Share (%) by Company Type - Large Enterprises and SMEs
- Chart 258: Australia Application Performance Monitoring Market Analysis (2021-2030) by Access Type - Web APM and Mobile APM in US$ Million
- Chart 259: Glance at 2021, 2024 and 2030 Australia Application Performance Monitoring Market Share (%) by Access Type - Web APM and Mobile APM
- Chart 260: Australia Application Performance Monitoring Market Analysis (2021-2030) by Industry Sector - IT & Communication, BFSI, Healthcare & Life Sciences, Media & Entertainment, Retail & Ecommerce, Energy & Utilities, Manufacturing, Education, Government, Transportation, Construction, Tourism & Hospitality and Others in US$ Million
- Chart 261: Glance at 2021, 2024 and 2030 Australia Application Performance Monitoring Market Share (%) by Industry Sector - IT & Communication, BFSI, Healthcare & Life Sciences, Media & Entertainment, Retail & Ecommerce, Energy & Utilities, Manufacturing, Education, Government, Transportation, Construction, Tourism & Hospitality and Others
SINGAPORE
- Chart 262: Singaporean Application Performance Monitoring Market Analysis (2021-2030) by Component - Software and Services in US$ Million
- Chart 263: Glance at 2021, 2024 and 2030 Singaporean Application Performance Monitoring Market Share (%) by Component - Software and Services
- Chart 264: Singaporean Application Performance Monitoring Market Analysis (2021-2030) by Deployment - On-Premises and Cloud in US$ Million
- Chart 265: Glance at 2021, 2024 and 2030 Singaporean Application Performance Monitoring Market Share (%) by Deployment - On-Premises and Cloud
- Chart 266: Singaporean Application Performance Monitoring Market Analysis (2021-2030) by Company Type - Large Enterprises and SMEs in US$ Million
- Chart 267: Glance at 2021, 2024 and 2030 Singaporean Application Performance Monitoring Market Share (%) by Company Type - Large Enterprises and SMEs
- Chart 268: Singaporean Application Performance Monitoring Market Analysis (2021-2030) by Access Type - Web APM and Mobile APM in US$ Million
- Chart 269: Glance at 2021, 2024 and 2030 Singaporean Application Performance Monitoring Market Share (%) by Access Type - Web APM and Mobile APM
- Chart 270: Singaporean Application Performance Monitoring Market Analysis (2021-2030) by Industry Sector - IT & Communication, BFSI, Healthcare & Life Sciences, Media & Entertainment, Retail & Ecommerce, Energy & Utilities, Manufacturing, Education, Government, Transportation, Construction, Tourism & Hospitality and Others in US$ Million
- Chart 271: Glance at 2021, 2024 and 2030 Singaporean Application Performance Monitoring Market Share (%) by Industry Sector - IT & Communication, BFSI, Healthcare & Life Sciences, Media & Entertainment, Retail & Ecommerce, Energy & Utilities, Manufacturing, Education, Government, Transportation, Construction, Tourism & Hospitality and Others
SOUTH KOREA
- Chart 272: South Korean Application Performance Monitoring Market Analysis (2021-2030) by Component - Software and Services in US$ Million
- Chart 273: Glance at 2021, 2024 and 2030 South Korean Application Performance Monitoring Market Share (%) by Component - Software and Services
- Chart 274: South Korean Application Performance Monitoring Market Analysis (2021-2030) by Deployment - On-Premises and Cloud in US$ Million
- Chart 275: Glance at 2021, 2024 and 2030 South Korean Application Performance Monitoring Market Share (%) by Deployment - On-Premises and Cloud
- Chart 276: South Korean Application Performance Monitoring Market Analysis (2021-2030) by Company Type - Large Enterprises and SMEs in US$ Million
- Chart 277: Glance at 2021, 2024 and 2030 South Korean Application Performance Monitoring Market Share (%) by Company Type - Large Enterprises and SMEs
- Chart 278: South Korean Application Performance Monitoring Market Analysis (2021-2030) by Access Type - Web APM and Mobile APM in US$ Million
- Chart 279: Glance at 2021, 2024 and 2030 South Korean Application Performance Monitoring Market Share (%) by Access Type - Web APM and Mobile APM
- Chart 280: South Korean Application Performance Monitoring Market Analysis (2021-2030) by Industry Sector - IT & Communication, BFSI, Healthcare & Life Sciences, Media & Entertainment, Retail & Ecommerce, Energy & Utilities, Manufacturing, Education, Government, Transportation, Construction, Tourism & Hospitality and Others in US$ Million
- Chart 281: Glance at 2021, 2024 and 2030 South Korean Application Performance Monitoring Market Share (%) by Industry Sector - IT & Communication, BFSI, Healthcare & Life Sciences, Media & Entertainment, Retail & Ecommerce, Energy & Utilities, Manufacturing, Education, Government, Transportation, Construction, Tourism & Hospitality and Others
REST OF ASIA-PACIFIC
- Chart 282: Rest of Asia-Pacific Application Performance Monitoring Market Analysis (2021-2030) by Component - Software and Services in US$ Million
- Chart 283: Glance at 2021, 2024 and 2030 Rest of Asia-Pacific Application Performance Monitoring Market Share (%) by Component - Software and Services
- Chart 284: Rest of Asia-Pacific Application Performance Monitoring Market Analysis (2021-2030) by Deployment - On-Premises and Cloud in US$ Million
- Chart 285: Glance at 2021, 2024 and 2030 Rest of Asia-Pacific Application Performance Monitoring Market Share (%) by Deployment - On-Premises and Cloud
- Chart 286: Rest of Asia-Pacific Application Performance Monitoring Market Analysis (2021-2030) by Company Type - Large Enterprises and SMEs in US$ Million
- Chart 287: Glance at 2021, 2024 and 2030 Rest of Asia-Pacific Application Performance Monitoring Market Share (%) by Company Type - Large Enterprises and SMEs
- Chart 288: Rest of Asia-Pacific Application Performance Monitoring Market Analysis (2021-2030) by Access Type - Web APM and Mobile APM in US$ Million
- Chart 289: Glance at 2021, 2024 and 2030 Rest of Asia-Pacific Application Performance Monitoring Market Share (%) by Access Type - Web APM and Mobile APM
- Chart 290: Rest of Asia-Pacific Application Performance Monitoring Market Analysis (2021-2030) by Industry Sector - IT & Communication, BFSI, Healthcare & Life Sciences, Media & Entertainment, Retail & Ecommerce, Energy & Utilities, Manufacturing, Education, Government, Transportation, Construction, Tourism & Hospitality and Others in US$ Million
- Chart 291: Glance at 2021, 2024 and 2030 Rest of Asia-Pacific Application Performance Monitoring Market Share (%) by Industry Sector - IT & Communication, BFSI, Healthcare & Life Sciences, Media & Entertainment, Retail & Ecommerce, Energy & Utilities, Manufacturing, Education, Government, Transportation, Construction, Tourism & Hospitality and Others
SOUTH AMERICA
- Chart 292: South American Application Performance Monitoring Market Analysis (2021-2030) in US$ Million
- Chart 293: South American Application Performance Monitoring Market Analysis (2021-2030) by Geographic Region - Brazil, Argentina, Colombia, Chilean, Peru and Rest of South America in US$ Million
- Chart 294: Glance at 2021, 2024 and 2030 South American Application Performance Monitoring Market Share (%) by Geographic Region - Brazil, Argentina, Colombia, Chilean, Peru and Rest of South America
- Chart 295: South American Application Performance Monitoring Market Analysis (2021-2030) by Component - Software and Services in US$ Million
- Chart 296: Glance at 2021, 2024 and 2030 South American Application Performance Monitoring Market Share (%) by Component - Software and Services
- Chart 297: South American Application Performance Monitoring Market Analysis (2021-2030) by Deployment - On-Premises and Cloud in US$ Million
- Chart 298: Glance at 2021, 2024 and 2030 South American Application Performance Monitoring Market Share (%) by Deployment - On-Premises and Cloud
- Chart 299: South American Application Performance Monitoring Market Analysis (2021-2030) by Company Type - Large Enterprises and SMEs in US$ Million
- Chart 300: Glance at 2021, 2024 and 2030 South American Application Performance Monitoring Market Share (%) by Company Type - Large Enterprises and SMEs
- Chart 301: South American Application Performance Monitoring Market Analysis (2021-2030) by Access Type - Web APM and Mobile APM in US$ Million
- Chart 302: Glance at 2021, 2024 and 2030 South American Application Performance Monitoring Market Share (%) by Access Type - Web APM and Mobile APM
- Chart 303: South American Application Performance Monitoring Market Analysis (2021-2030) by Industry Sector - IT & Communication, BFSI, Healthcare & Life Sciences, Media & Entertainment, Retail & Ecommerce, Energy & Utilities, Manufacturing, Education, Government, Transportation, Construction, Tourism & Hospitality and Others in US$ Million
- Chart 304: Glance at 2021, 2024 and 2030 South American Application Performance Monitoring Market Share (%) by Industry Sector - IT & Communication, BFSI, Healthcare & Life Sciences, Media & Entertainment, Retail & Ecommerce, Energy & Utilities, Manufacturing, Education, Government, Transportation, Construction, Tourism & Hospitality and Others
BRAZIL
- Chart 305: Brazilian Application Performance Monitoring Market Analysis (2021-2030) by Component - Software and Services in US$ Million
- Chart 306: Glance at 2021, 2024 and 2030 Brazilian Application Performance Monitoring Market Share (%) by Component - Software and Services
- Chart 307: Brazilian Application Performance Monitoring Market Analysis (2021-2030) by Deployment - On-Premises and Cloud in US$ Million
- Chart 308: Glance at 2021, 2024 and 2030 Brazilian Application Performance Monitoring Market Share (%) by Deployment - On-Premises and Cloud
- Chart 309: Brazilian Application Performance Monitoring Market Analysis (2021-2030) by Company Type - Large Enterprises and SMEs in US$ Million
- Chart 310: Glance at 2021, 2024 and 2030 Brazilian Application Performance Monitoring Market Share (%) by Company Type - Large Enterprises and SMEs
- Chart 311: Brazilian Application Performance Monitoring Market Analysis (2021-2030) by Access Type - Web APM and Mobile APM in US$ Million
- Chart 312: Glance at 2021, 2024 and 2030 Brazilian Application Performance Monitoring Market Share (%) by Access Type - Web APM and Mobile APM
- Chart 313: Brazilian Application Performance Monitoring Market Analysis (2021-2030) by Industry Sector - IT & Communication, BFSI, Healthcare & Life Sciences, Media & Entertainment, Retail & Ecommerce, Energy & Utilities, Manufacturing, Education, Government, Transportation, Construction, Tourism & Hospitality and Others in US$ Million
- Chart 314: Glance at 2021, 2024 and 2030 Brazilian Application Performance Monitoring Market Share (%) by Industry Sector - IT & Communication, BFSI, Healthcare & Life Sciences, Media & Entertainment, Retail & Ecommerce, Energy & Utilities, Manufacturing, Education, Government, Transportation, Construction, Tourism & Hospitality and Others
ARGENTINA
- Chart 315: Argentine Application Performance Monitoring Market Analysis (2021-2030) by Component - Software and Services in US$ Million
- Chart 316: Glance at 2021, 2024 and 2030 Argentine Application Performance Monitoring Market Share (%) by Component - Software and Services
- Chart 317: Argentine Application Performance Monitoring Market Analysis (2021-2030) by Deployment - On-Premises and Cloud in US$ Million
- Chart 318: Glance at 2021, 2024 and 2030 Argentine Application Performance Monitoring Market Share (%) by Deployment - On-Premises and Cloud
- Chart 319: Argentine Application Performance Monitoring Market Analysis (2021-2030) by Company Type - Large Enterprises and SMEs in US$ Million
- Chart 320: Glance at 2021, 2024 and 2030 Argentine Application Performance Monitoring Market Share (%) by Company Type - Large Enterprises and SMEs
- Chart 321: Argentine Application Performance Monitoring Market Analysis (2021-2030) by Access Type - Web APM and Mobile APM in US$ Million
- Chart 322: Glance at 2021, 2024 and 2030 Argentine Application Performance Monitoring Market Share (%) by Access Type - Web APM and Mobile APM
- Chart 323: Argentine Application Performance Monitoring Market Analysis (2021-2030) by Industry Sector - IT & Communication, BFSI, Healthcare & Life Sciences, Media & Entertainment, Retail & Ecommerce, Energy & Utilities, Manufacturing, Education, Government, Transportation, Construction, Tourism & Hospitality and Others in US$ Million
- Chart 324: Glance at 2021, 2024 and 2030 Argentine Application Performance Monitoring Market Share (%) by Industry Sector - IT & Communication, BFSI, Healthcare & Life Sciences, Media & Entertainment, Retail & Ecommerce, Energy & Utilities, Manufacturing, Education, Government, Transportation, Construction, Tourism & Hospitality and Others
COLOMBIA
- Chart 325: Colombian Application Performance Monitoring Market Analysis (2021-2030) by Component - Software and Services in US$ Million
- Chart 326: Glance at 2021, 2024 and 2030 Colombian Application Performance Monitoring Market Share (%) by Component - Software and Services
- Chart 327: Colombian Application Performance Monitoring Market Analysis (2021-2030) by Deployment - On-Premises and Cloud in US$ Million
- Chart 328: Glance at 2021, 2024 and 2030 Colombian Application Performance Monitoring Market Share (%) by Deployment - On-Premises and Cloud
- Chart 329: Colombian Application Performance Monitoring Market Analysis (2021-2030) by Company Type - Large Enterprises and SMEs in US$ Million
- Chart 330: Glance at 2021, 2024 and 2030 Colombian Application Performance Monitoring Market Share (%) by Company Type - Large Enterprises and SMEs
- Chart 331: Colombian Application Performance Monitoring Market Analysis (2021-2030) by Access Type - Web APM and Mobile APM in US$ Million
- Chart 332: Glance at 2021, 2024 and 2030 Colombian Application Performance Monitoring Market Share (%) by Access Type - Web APM and Mobile APM
- Chart 333: Colombian Application Performance Monitoring Market Analysis (2021-2030) by Industry Sector - IT & Communication, BFSI, Healthcare & Life Sciences, Media & Entertainment, Retail & Ecommerce, Energy & Utilities, Manufacturing, Education, Government, Transportation, Construction, Tourism & Hospitality and Others in US$ Million
- Chart 334: Glance at 2021, 2024 and 2030 Colombian Application Performance Monitoring Market Share (%) by Industry Sector - IT & Communication, BFSI, Healthcare & Life Sciences, Media & Entertainment, Retail & Ecommerce, Energy & Utilities, Manufacturing, Education, Government, Transportation, Construction, Tourism & Hospitality and Others
CHILE
- Chart 335: Chilean Application Performance Monitoring Market Analysis (2021-2030) by Component - Software and Services in US$ Million
- Chart 336: Glance at 2021, 2024 and 2030 Chilean Application Performance Monitoring Market Share (%) by Component - Software and Services
- Chart 337: Chilean Application Performance Monitoring Market Analysis (2021-2030) by Deployment - On-Premises and Cloud in US$ Million
- Chart 338: Glance at 2021, 2024 and 2030 Chilean Application Performance Monitoring Market Share (%) by Deployment - On-Premises and Cloud
- Chart 339: Chilean Application Performance Monitoring Market Analysis (2021-2030) by Company Type - Large Enterprises and SMEs in US$ Million
- Chart 340: Glance at 2021, 2024 and 2030 Chilean Application Performance Monitoring Market Share (%) by Company Type - Large Enterprises and SMEs
- Chart 341: Chilean Application Performance Monitoring Market Analysis (2021-2030) by Access Type - Web APM and Mobile APM in US$ Million
- Chart 342: Glance at 2021, 2024 and 2030 Chilean Application Performance Monitoring Market Share (%) by Access Type - Web APM and Mobile APM
- Chart 343: Chilean Application Performance Monitoring Market Analysis (2021-2030) by Industry Sector - IT & Communication, BFSI, Healthcare & Life Sciences, Media & Entertainment, Retail & Ecommerce, Energy & Utilities, Manufacturing, Education, Government, Transportation, Construction, Tourism & Hospitality and Others in US$ Million
- Chart 344: Glance at 2021, 2024 and 2030 Chilean Application Performance Monitoring Market Share (%) by Industry Sector - IT & Communication, BFSI, Healthcare & Life Sciences, Media & Entertainment, Retail & Ecommerce, Energy & Utilities, Manufacturing, Education, Government, Transportation, Construction, Tourism & Hospitality and Others
PERU
- Chart 345: Peruvian Application Performance Monitoring Market Analysis (2021-2030) by Component - Software and Services in US$ Million
- Chart 346: Glance at 2021, 2024 and 2030 Peruvian Application Performance Monitoring Market Share (%) by Component - Software and Services
- Chart 347: Peruvian Application Performance Monitoring Market Analysis (2021-2030) by Deployment - On-Premises and Cloud in US$ Million
- Chart 348: Glance at 2021, 2024 and 2030 Peruvian Application Performance Monitoring Market Share (%) by Deployment - On-Premises and Cloud
- Chart 349: Peruvian Application Performance Monitoring Market Analysis (2021-2030) by Company Type - Large Enterprises and SMEs in US$ Million
- Chart 350: Glance at 2021, 2024 and 2030 Peruvian Application Performance Monitoring Market Share (%) by Company Type - Large Enterprises and SMEs
- Chart 351: Peruvian Application Performance Monitoring Market Analysis (2021-2030) by Access Type - Web APM and Mobile APM in US$ Million
- Chart 352: Glance at 2021, 2024 and 2030 Peruvian Application Performance Monitoring Market Share (%) by Access Type - Web APM and Mobile APM
- Chart 353: Peruvian Application Performance Monitoring Market Analysis (2021-2030) by Industry Sector - IT & Communication, BFSI, Healthcare & Life Sciences, Media & Entertainment, Retail & Ecommerce, Energy & Utilities, Manufacturing, Education, Government, Transportation, Construction, Tourism & Hospitality and Others in US$ Million
- Chart 354: Glance at 2021, 2024 and 2030 Peruvian Application Performance Monitoring Market Share (%) by Industry Sector - IT & Communication, BFSI, Healthcare & Life Sciences, Media & Entertainment, Retail & Ecommerce, Energy & Utilities, Manufacturing, Education, Government, Transportation, Construction, Tourism & Hospitality and Others
REST OF SOUTH AMERICA
- Chart 355: Rest of South America Application Performance Monitoring Market Analysis (2021-2030) by Component - Software and Services in US$ Million
- Chart 356: Glance at 2021, 2024 and 2030 Rest of South America Application Performance Monitoring Market Share (%) by Component - Software and Services
- Chart 357: Rest of South America Application Performance Monitoring Market Analysis (2021-2030) by Deployment - On-Premises and Cloud in US$ Million
- Chart 358: Glance at 2021, 2024 and 2030 Rest of South America Application Performance Monitoring Market Share (%) by Deployment - On-Premises and Cloud
- Chart 359: Rest of South America Application Performance Monitoring Market Analysis (2021-2030) by Company Type - Large Enterprises and SMEs in US$ Million
- Chart 360: Glance at 2021, 2024 and 2030 Rest of South America Application Performance Monitoring Market Share (%) by Company Type - Large Enterprises and SMEs
- Chart 361: Rest of South America Application Performance Monitoring Market Analysis (2021-2030) by Access Type - Web APM and Mobile APM in US$ Million
- Chart 362: Glance at 2021, 2024 and 2030 Rest of South America Application Performance Monitoring Market Share (%) by Access Type - Web APM and Mobile APM
- Chart 363: Rest of South America Application Performance Monitoring Market Analysis (2021-2030) by Industry Sector - IT & Communication, BFSI, Healthcare & Life Sciences, Media & Entertainment, Retail & Ecommerce, Energy & Utilities, Manufacturing, Education, Government, Transportation, Construction, Tourism & Hospitality and Others in US$ Million
- Chart 364: Glance at 2021, 2024 and 2030 Rest of South America Application Performance Monitoring Market Share (%) by Industry Sector - IT & Communication, BFSI, Healthcare & Life Sciences, Media & Entertainment, Retail & Ecommerce, Energy & Utilities, Manufacturing, Education, Government, Transportation, Construction, Tourism & Hospitality and Others
MIDDLE EAST & AFRICA
- Chart 365: Middle East & Africa Application Performance Monitoring Market Analysis (2021-2030) in US$ Million
- Chart 366: Middle East & Africa Application Performance Monitoring Market Analysis (2021-2030) by Geographic Region - United Arab Emirates, South Africa, Egypt, Saudi Arabia, Morocco, Kuwait, Qatar and Rest of Middle East & Africa in US$ Million
- Chart 367: Glance at 2021, 2024 and 2030 Middle East & Africa Application Performance Monitoring Market Share (%) by Geographic Region - United Arab Emirates, South Africa, Egypt, Saudi Arabia, Morocco, Kuwait, Qatar and Rest of Middle East & Africa
- Chart 368: Middle East & Africa Application Performance Monitoring Market Analysis (2021-2030) by Component - Software and Services in US$ Million
- Chart 369: Glance at 2021, 2024 and 2030 Middle East & Africa Application Performance Monitoring Market Share (%) by Component - Software and Services
- Chart 370: Middle East & Africa Application Performance Monitoring Market Analysis (2021-2030) by Deployment - On-Premises and Cloud in US$ Million
- Chart 371: Glance at 2021, 2024 and 2030 Middle East & Africa Application Performance Monitoring Market Share (%) by Deployment - On-Premises and Cloud
- Chart 372: Middle East & Africa Application Performance Monitoring Market Analysis (2021-2030) by Company Type - Large Enterprises and SMEs in US$ Million
- Chart 373: Glance at 2021, 2024 and 2030 Middle East & Africa Application Performance Monitoring Market Share (%) by Company Type - Large Enterprises and SMEs
- Chart 374: Middle East & Africa Application Performance Monitoring Market Analysis (2021-2030) by Access Type - Web APM and Mobile APM in US$ Million
- Chart 375: Glance at 2021, 2024 and 2030 Middle East & Africa Application Performance Monitoring Market Share (%) by Access Type - Web APM and Mobile APM
- Chart 376: Middle East & Africa Application Performance Monitoring Market Analysis (2021-2030) by Industry Sector - IT & Communication, BFSI, Healthcare & Life Sciences, Media & Entertainment, Retail & Ecommerce, Energy & Utilities, Manufacturing, Education, Government, Transportation, Construction, Tourism & Hospitality and Others in US$ Million
- Chart 377: Glance at 2021, 2024 and 2030 Middle East & Africa Application Performance Monitoring Market Share (%) by Industry Sector - IT & Communication, BFSI, Healthcare & Life Sciences, Media & Entertainment, Retail & Ecommerce, Energy & Utilities, Manufacturing, Education, Government, Transportation, Construction, Tourism & Hospitality and Others
THE UNITED ARAB EMIRATES
- Chart 378: United Arab Emirates Application Performance Monitoring Market Analysis (2021-2030) by Component - Software and Services in US$ Million
- Chart 379: Glance at 2021, 2024 and 2030 United Arab Emirates Application Performance Monitoring Market Share (%) by Component - Software and Services
- Chart 380: United Arab Emirates Application Performance Monitoring Market Analysis (2021-2030) by Deployment - On-Premises and Cloud in US$ Million
- Chart 381: Glance at 2021, 2024 and 2030 United Arab Emirates Application Performance Monitoring Market Share (%) by Deployment - On-Premises and Cloud
- Chart 382: United Arab Emirates Application Performance Monitoring Market Analysis (2021-2030) by Company Type - Large Enterprises and SMEs in US$ Million
- Chart 383: Glance at 2021, 2024 and 2030 United Arab Emirates Application Performance Monitoring Market Share (%) by Company Type - Large Enterprises and SMEs
- Chart 384: United Arab Emirates Application Performance Monitoring Market Analysis (2021-2030) by Access Type - Web APM and Mobile APM in US$ Million
- Chart 385: Glance at 2021, 2024 and 2030 United Arab Emirates Application Performance Monitoring Market Share (%) by Access Type - Web APM and Mobile APM
- Chart 386: United Arab Emirates Application Performance Monitoring Market Analysis (2021-2030) by Industry Sector - IT & Communication, BFSI, Healthcare & Life Sciences, Media & Entertainment, Retail & Ecommerce, Energy & Utilities, Manufacturing, Education, Government, Transportation, Construction, Tourism & Hospitality and Others in US$ Million
- Chart 387: Glance at 2021, 2024 and 2030 United Arab Emirates Application Performance Monitoring Market Share (%) by Industry Sector - IT & Communication, BFSI, Healthcare & Life Sciences, Media & Entertainment, Retail & Ecommerce, Energy & Utilities, Manufacturing, Education, Government, Transportation, Construction, Tourism & Hospitality and Others
SOUTH AFRICA
- Chart 388: South African Application Performance Monitoring Market Analysis (2021-2030) by Component - Software and Services in US$ Million
- Chart 389: Glance at 2021, 2024 and 2030 South African Application Performance Monitoring Market Share (%) by Component - Software and Services
- Chart 390: South African Application Performance Monitoring Market Analysis (2021-2030) by Deployment - On-Premises and Cloud in US$ Million
- Chart 391: Glance at 2021, 2024 and 2030 South African Application Performance Monitoring Market Share (%) by Deployment - On-Premises and Cloud
- Chart 392: South African Application Performance Monitoring Market Analysis (2021-2030) by Company Type - Large Enterprises and SMEs in US$ Million
- Chart 393: Glance at 2021, 2024 and 2030 South African Application Performance Monitoring Market Share (%) by Company Type - Large Enterprises and SMEs
- Chart 394: South African Application Performance Monitoring Market Analysis (2021-2030) by Access Type - Web APM and Mobile APM in US$ Million
- Chart 395: Glance at 2021, 2024 and 2030 South African Application Performance Monitoring Market Share (%) by Access Type - Web APM and Mobile APM
- Chart 396: South African Application Performance Monitoring Market Analysis (2021-2030) by Industry Sector - IT & Communication, BFSI, Healthcare & Life Sciences, Media & Entertainment, Retail & Ecommerce, Energy & Utilities, Manufacturing, Education, Government, Transportation, Construction, Tourism & Hospitality and Others in US$ Million
- Chart 397: Glance at 2021, 2024 and 2030 South African Application Performance Monitoring Market Share (%) by Industry Sector - IT & Communication, BFSI, Healthcare & Life Sciences, Media & Entertainment, Retail & Ecommerce, Energy & Utilities, Manufacturing, Education, Government, Transportation, Construction, Tourism & Hospitality and Others
EGYPT
- Chart 398: Egyptian Application Performance Monitoring Market Analysis (2021-2030) by Component - Software and Services in US$ Million
- Chart 399: Glance at 2021, 2024 and 2030 Egyptian Application Performance Monitoring Market Share (%) by Component - Software and Services
- Chart 400: Egyptian Application Performance Monitoring Market Analysis (2021-2030) by Deployment - On-Premises and Cloud in US$ Million
- Chart 401: Glance at 2021, 2024 and 2030 Egyptian Application Performance Monitoring Market Share (%) by Deployment - On-Premises and Cloud
- Chart 402: Egyptian Application Performance Monitoring Market Analysis (2021-2030) by Company Type - Large Enterprises and SMEs in US$ Million
- Chart 403: Glance at 2021, 2024 and 2030 Egyptian Application Performance Monitoring Market Share (%) by Company Type - Large Enterprises and SMEs
- Chart 404: Egyptian Application Performance Monitoring Market Analysis (2021-2030) by Access Type - Web APM and Mobile APM in US$ Million
- Chart 405: Glance at 2021, 2024 and 2030 Egyptian Application Performance Monitoring Market Share (%) by Access Type - Web APM and Mobile APM
- Chart 406: Egyptian Application Performance Monitoring Market Analysis (2021-2030) by Industry Sector - IT & Communication, BFSI, Healthcare & Life Sciences, Media & Entertainment, Retail & Ecommerce, Energy & Utilities, Manufacturing, Education, Government, Transportation, Construction, Tourism & Hospitality and Others in US$ Million
- Chart 407: Glance at 2021, 2024 and 2030 Egyptian Application Performance Monitoring Market Share (%) by Industry Sector - IT & Communication, BFSI, Healthcare & Life Sciences, Media & Entertainment, Retail & Ecommerce, Energy & Utilities, Manufacturing, Education, Government, Transportation, Construction, Tourism & Hospitality and Others
SAUDI ARABIA
- Chart 408: Saudi Arabian Application Performance Monitoring Market Analysis (2021-2030) by Component - Software and Services in US$ Million
- Chart 409: Glance at 2021, 2024 and 2030 Saudi Arabian Application Performance Monitoring Market Share (%) by Component - Software and Services
- Chart 410: Saudi Arabian Application Performance Monitoring Market Analysis (2021-2030) by Deployment - On-Premises and Cloud in US$ Million
- Chart 411: Glance at 2021, 2024 and 2030 Saudi Arabian Application Performance Monitoring Market Share (%) by Deployment - On-Premises and Cloud
- Chart 412: Saudi Arabian Application Performance Monitoring Market Analysis (2021-2030) by Company Type - Large Enterprises and SMEs in US$ Million
- Chart 413: Glance at 2021, 2024 and 2030 Saudi Arabian Application Performance Monitoring Market Share (%) by Company Type - Large Enterprises and SMEs
- Chart 414: Saudi Arabian Application Performance Monitoring Market Analysis (2021-2030) by Access Type - Web APM and Mobile APM in US$ Million
- Chart 415: Glance at 2021, 2024 and 2030 Saudi Arabian Application Performance Monitoring Market Share (%) by Access Type - Web APM and Mobile APM
- Chart 416: Saudi Arabian Application Performance Monitoring Market Analysis (2021-2030) by Industry Sector - IT & Communication, BFSI, Healthcare & Life Sciences, Media & Entertainment, Retail & Ecommerce, Energy & Utilities, Manufacturing, Education, Government, Transportation, Construction, Tourism & Hospitality and Others in US$ Million
- Chart 417: Glance at 2021, 2024 and 2030 Saudi Arabian Application Performance Monitoring Market Share (%) by Industry Sector - IT & Communication, BFSI, Healthcare & Life Sciences, Media & Entertainment, Retail & Ecommerce, Energy & Utilities, Manufacturing, Education, Government, Transportation, Construction, Tourism & Hospitality and Others
MOROCCO
- Chart 418: Moroccan Application Performance Monitoring Market Analysis (2021-2030) by Component - Software and Services in US$ Million
- Chart 419: Glance at 2021, 2024 and 2030 Moroccan Application Performance Monitoring Market Share (%) by Component - Software and Services
- Chart 420: Moroccan Application Performance Monitoring Market Analysis (2021-2030) by Deployment - On-Premises and Cloud in US$ Million
- Chart 421: Glance at 2021, 2024 and 2030 Moroccan Application Performance Monitoring Market Share (%) by Deployment - On-Premises and Cloud
- Chart 422: Moroccan Application Performance Monitoring Market Analysis (2021-2030) by Company Type - Large Enterprises and SMEs in US$ Million
- Chart 423: Glance at 2021, 2024 and 2030 Moroccan Application Performance Monitoring Market Share (%) by Company Type - Large Enterprises and SMEs
- Chart 424: Moroccan Application Performance Monitoring Market Analysis (2021-2030) by Access Type - Web APM and Mobile APM in US$ Million
- Chart 425: Glance at 2021, 2024 and 2030 Moroccan Application Performance Monitoring Market Share (%) by Access Type - Web APM and Mobile APM
- Chart 426: Moroccan Application Performance Monitoring Market Analysis (2021-2030) by Industry Sector - IT & Communication, BFSI, Healthcare & Life Sciences, Media & Entertainment, Retail & Ecommerce, Energy & Utilities, Manufacturing, Education, Government, Transportation, Construction, Tourism & Hospitality and Others in US$ Million
- Chart 427: Glance at 2021, 2024 and 2030 Moroccan Application Performance Monitoring Market Share (%) by Industry Sector - IT & Communication, BFSI, Healthcare & Life Sciences, Media & Entertainment, Retail & Ecommerce, Energy & Utilities, Manufacturing, Education, Government, Transportation, Construction, Tourism & Hospitality and Others
KUWAIT
- Chart 428: Kuwaiti Application Performance Monitoring Market Analysis (2021-2030) by Component - Software and Services in US$ Million
- Chart 429: Glance at 2021, 2024 and 2030 Kuwaiti Application Performance Monitoring Market Share (%) by Component - Software and Services
- Chart 430: Kuwaiti Application Performance Monitoring Market Analysis (2021-2030) by Deployment - On-Premises and Cloud in US$ Million
- Chart 431: Glance at 2021, 2024 and 2030 Kuwaiti Application Performance Monitoring Market Share (%) by Deployment - On-Premises and Cloud
- Chart 432: Kuwaiti Application Performance Monitoring Market Analysis (2021-2030) by Company Type - Large Enterprises and SMEs in US$ Million
- Chart 433: Glance at 2021, 2024 and 2030 Kuwaiti Application Performance Monitoring Market Share (%) by Company Type - Large Enterprises and SMEs
- Chart 434: Kuwaiti Application Performance Monitoring Market Analysis (2021-2030) by Access Type - Web APM and Mobile APM in US$ Million
- Chart 435: Glance at 2021, 2024 and 2030 Kuwaiti Application Performance Monitoring Market Share (%) by Access Type - Web APM and Mobile APM
- Chart 436: Kuwaiti Application Performance Monitoring Market Analysis (2021-2030) by Industry Sector - IT & Communication, BFSI, Healthcare & Life Sciences, Media & Entertainment, Retail & Ecommerce, Energy & Utilities, Manufacturing, Education, Government, Transportation, Construction, Tourism & Hospitality and Others in US$ Million
- Chart 437: Glance at 2021, 2024 and 2030 Kuwaiti Application Performance Monitoring Market Share (%) by Industry Sector - IT & Communication, BFSI, Healthcare & Life Sciences, Media & Entertainment, Retail & Ecommerce, Energy & Utilities, Manufacturing, Education, Government, Transportation, Construction, Tourism & Hospitality and Others
QATAR
- Chart 438: Qatari Application Performance Monitoring Market Analysis (2021-2030) by Component - Software and Services in US$ Million
- Chart 439: Glance at 2021, 2024 and 2030 Qatari Application Performance Monitoring Market Share (%) by Component - Software and Services
- Chart 440: Qatari Application Performance Monitoring Market Analysis (2021-2030) by Deployment - On-Premises and Cloud in US$ Million
- Chart 441: Glance at 2021, 2024 and 2030 Qatari Application Performance Monitoring Market Share (%) by Deployment - On-Premises and Cloud
- Chart 442: Qatari Application Performance Monitoring Market Analysis (2021-2030) by Company Type - Large Enterprises and SMEs in US$ Million
- Chart 443: Glance at 2021, 2024 and 2030 Qatari Application Performance Monitoring Market Share (%) by Company Type - Large Enterprises and SMEs
- Chart 444: Qatari Application Performance Monitoring Market Analysis (2021-2030) by Access Type - Web APM and Mobile APM in US$ Million
- Chart 445: Glance at 2021, 2024 and 2030 Qatari Application Performance Monitoring Market Share (%) by Access Type - Web APM and Mobile APM
- Chart 446: Qatari Application Performance Monitoring Market Analysis (2021-2030) by Industry Sector - IT & Communication, BFSI, Healthcare & Life Sciences, Media & Entertainment, Retail & Ecommerce, Energy & Utilities, Manufacturing, Education, Government, Transportation, Construction, Tourism & Hospitality and Others in US$ Million
- Chart 447: Glance at 2021, 2024 and 2030 Qatari Application Performance Monitoring Market Share (%) by Industry Sector - IT & Communication, BFSI, Healthcare & Life Sciences, Media & Entertainment, Retail & Ecommerce, Energy & Utilities, Manufacturing, Education, Government, Transportation, Construction, Tourism & Hospitality and Others
REST OF MIDDLE EAST & AFRICA
- Chart 448: Rest of Middle East & Africa Application Performance Monitoring Market Analysis (2021-2030) by Component - Software and Services in US$ Million
- Chart 449: Glance at 2021, 2024 and 2030 Rest of Middle East & Africa Application Performance Monitoring Market Share (%) by Component - Software and Services
- Chart 450: Rest of Middle East & Africa Application Performance Monitoring Market Analysis (2021-2030) by Deployment - On-Premises and Cloud in US$ Million
- Chart 451: Glance at 2021, 2024 and 2030 Rest of Middle East & Africa Application Performance Monitoring Market Share (%) by Deployment - On-Premises and Cloud
- Chart 452: Rest of Middle East & Africa Application Performance Monitoring Market Analysis (2021-2030) by Company Type - Large Enterprises and SMEs in US$ Million
- Chart 453: Glance at 2021, 2024 and 2030 Rest of Middle East & Africa Application Performance Monitoring Market Share (%) by Company Type - Large Enterprises and SMEs
- Chart 454: Rest of Middle East & Africa Application Performance Monitoring Market Analysis (2021-2030) by Access Type - Web APM and Mobile APM in US$ Million
- Chart 455: Glance at 2021, 2024 and 2030 Rest of Middle East & Africa Application Performance Monitoring Market Share (%) by Access Type - Web APM and Mobile APM
- Chart 456: Rest of Middle East & Africa Application Performance Monitoring Market Analysis (2021-2030) by Industry Sector - IT & Communication, BFSI, Healthcare & Life Sciences, Media & Entertainment, Retail & Ecommerce, Energy & Utilities, Manufacturing, Education, Government, Transportation, Construction, Tourism & Hospitality and Others
- Chart 457: Glance at 2021, 2024 and 2030 Rest of Middle East & Africa Application Performance Monitoring Market Share (%) by Industry Sector - IT & Communication, BFSI, Healthcare & Life Sciences, Media & Entertainment, Retail & Ecommerce, Energy & Utilities, Manufacturing, Education, Government, Transportation, Construction, Tourism & Hospitality and Others
Tables
- Table 1: Global APM Industry - Porter's Five Forces Analysis
- Table 2: Global APM Industry - PESTEL Analysis
- Table 3: Tier-1 Players in Application Performance Monitoring (APM) Industry
- Table 4: Tier-2 Players in Application Performance Monitoring (APM) Industry
- Table 5: Tier-3 Players in Application Performance Monitoring (APM) Industry
- Table 6: Tier-4 Players in Application Performance Monitoring (APM) Industry
- Table 7: Global APM Industry - SWOT Analysis of Market Leaders

