
PUBLISHER: 360iResearch | PRODUCT CODE: 1415400

PUBLISHER: 360iResearch | PRODUCT CODE: 1415400
Esters Market by Type (Acrylic Esters, Allyl & Aromatic Esters, Cellulose Esters), Application (Automotive & Transportation, Food & Beverages, Packaging) - Global Forecast 2024-2030
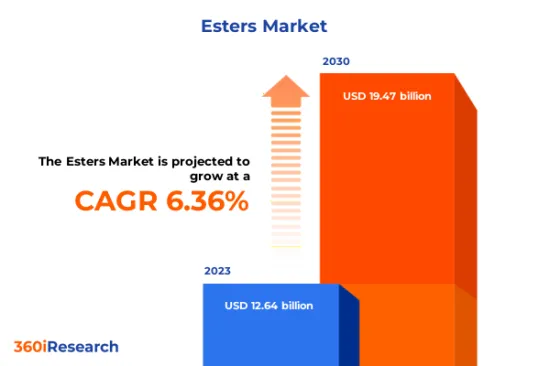
[197 Pages Report] The Esters Market size was estimated at USD 12.64 billion in 2023 and expected to reach USD 13.38 billion in 2024, at a CAGR 6.36% to reach USD 19.47 billion by 2030.
Global Esters Market
| KEY MARKET STATISTICS | |
|---|---|
| Base Year [2023] | USD 12.64 billion |
| Estimated Year [2024] | USD 13.38 billion |
| Forecast Year [2030] | USD 19.47 billion |
| CAGR (%) | 6.36% |
Esters are a class of chemical compounds derived from an organic or inorganic acid in which an alkoxy group replaces at least one hydroxyl group. Esters are versatile compounds used as plasticizers in manufacturing flexible plastics, synthetic machinery lubricants, paints, coatings solvents, and flavoring and fragrance agents in the food and perfume industries. In the pharmaceutical sector, esters are integral to various drugs and medicinal preparations. The unique properties of esters, such as low polarity, solubility in organic solvents, and capacity to form hydrogen bonds, make them suitable for numerous end-use applications. However, volatility in primary material prices and supply disruptions can adversely affect product availability. In addition, regulatory constraints regarding using certain types of esters due to environmental concerns pose significant hurdles to adopting esters across diverse end-use industries. Nevertheless, the demand for eco-friendly and sustainable materials has led to the opportunity for the development of bio-based esters. Moreover, the potential of using esters in exploring new application areas such as bioplastics and renewable energy sectors, particularly in solar panel manufacturing and wind turbines, has expanded the scope of the esters market. Advancements in chemical recycling technologies for plastics are slated to create new opportunities for ester applications in the circular economy.
Regional Insights
The Americas holds a significant share in the esters market, driven by robust industrial sectors such as automotive, aerospace, and pharmaceuticals. Consumer needs in the region primarily revolve around quality and sustainability, with trends showing growth in the preference for bio-based esters. Recent investments in research and development across the Americas indicate a concerted effort to produce eco-friendly alternatives to traditional petrochemical-derived esters. In Europe, the esters market is highly regulated with stringent environmental and safety standards. The EU countries are progressively leaning towards sustainability, with the European Commission incentivizing developing and using environmentally friendly esters. In the Middle East, petrochemical companies are investing in the production of esters as a way to diversify from traditional petroleum products. The Asia Pacific region has significant manufacturing capacities and a large consumer base characterized by competitive pricing and a high rate of innovation, with several new patents filed for advancements in ester production technologies. Increased industrial activities in sectors such as textiles and pharmaceuticals and the focus on affordability and the diversification of the product range are expected to spur domestic production and innovation in the field of esters.
FPNV Positioning Matrix
The FPNV Positioning Matrix is pivotal in evaluating the Esters Market. It offers a comprehensive assessment of vendors, examining key metrics related to Business Strategy and Product Satisfaction. This in-depth analysis empowers users to make well-informed decisions aligned with their requirements. Based on the evaluation, the vendors are then categorized into four distinct quadrants representing varying levels of success: Forefront (F), Pathfinder (P), Niche (N), or Vital (V).
Market Share Analysis
The Market Share Analysis is a comprehensive tool that provides an insightful and in-depth examination of the current state of vendors in the Esters Market. By meticulously comparing and analyzing vendor contributions in terms of overall revenue, customer base, and other key metrics, we can offer companies a greater understanding of their performance and the challenges they face when competing for market share. Additionally, this analysis provides valuable insights into the competitive nature of the sector, including factors such as accumulation, fragmentation dominance, and amalgamation traits observed over the base year period studied. With this expanded level of detail, vendors can make more informed decisions and devise effective strategies to gain a competitive edge in the market.
Key Company Profiles
The report delves into recent significant developments in the Esters Market, highlighting leading vendors and their innovative profiles. These include ABITEC Corporation, Archer-Daniels-Midland Company, Arkema S.A., BASF SE, Berg + Schmidt GmbH & Co. KG, Biotage, Cargill, Incorporated, CEM Corporation, Chemra GmbH, Croda International PLC, DuPont de Nemours, Inc., eChem Ltd., Gattefosse, Interfat SAU, Koninklijke DSM N.V., Lipotype GmbH, Merck KGaA, Solvay S.A., Stepan Company, Subhash Chemical Industries Private Ltd., Sumitomo Chemical Co., Ltd., The Dow Chemical Company, The Procter & Gamble Company, Thermo Fisher Scientific Inc., and Tokyo Chemical Industry Co., Ltd..
Market Segmentation & Coverage
This research report categorizes the Esters Market to forecast the revenues and analyze trends in each of the following sub-markets:
- Type
- Acrylic Esters
- Allyl & Aromatic Esters
- Cellulose Esters
- Fatty Esters
- Phosphate Esters
- Application
- Automotive & Transportation
- Food & Beverages
- Packaging
- Paints & Coatings
- Personal Care
- Pharmaceuticals
- Surfactants & Detergents
- Region
- Americas
- Argentina
- Brazil
- Canada
- Mexico
- United States
- California
- Florida
- Illinois
- New York
- Ohio
- Pennsylvania
- Texas
- Asia-Pacific
- Australia
- China
- India
- Indonesia
- Japan
- Malaysia
- Philippines
- Singapore
- South Korea
- Taiwan
- Thailand
- Vietnam
- Europe, Middle East & Africa
- Denmark
- Egypt
- Finland
- France
- Germany
- Israel
- Italy
- Netherlands
- Nigeria
- Norway
- Poland
- Qatar
- Russia
- Saudi Arabia
- South Africa
- Spain
- Sweden
- Switzerland
- Turkey
- United Arab Emirates
- United Kingdom
- Americas
The report offers valuable insights on the following aspects:
1. Market Penetration: It presents comprehensive information on the market provided by key players.
2. Market Development: It delves deep into lucrative emerging markets and analyzes the penetration across mature market segments.
3. Market Diversification: It provides detailed information on new product launches, untapped geographic regions, recent developments, and investments.
4. Competitive Assessment & Intelligence: It conducts an exhaustive assessment of market shares, strategies, products, certifications, regulatory approvals, patent landscape, and manufacturing capabilities of the leading players.
5. Product Development & Innovation: It offers intelligent insights on future technologies, R&D activities, and breakthrough product developments.
The report addresses key questions such as:
1. What is the market size and forecast of the Esters Market?
2. Which products, segments, applications, and areas should one consider investing in over the forecast period in the Esters Market?
3. What are the technology trends and regulatory frameworks in the Esters Market?
4. What is the market share of the leading vendors in the Esters Market?
5. Which modes and strategic moves are suitable for entering the Esters Market?
Table of Contents
1. Preface
- 1.1. Objectives of the Study
- 1.2. Market Segmentation & Coverage
- 1.3. Years Considered for the Study
- 1.4. Currency & Pricing
- 1.5. Language
- 1.6. Limitations
- 1.7. Assumptions
- 1.8. Stakeholders
2. Research Methodology
- 2.1. Define: Research Objective
- 2.2. Determine: Research Design
- 2.3. Prepare: Research Instrument
- 2.4. Collect: Data Source
- 2.5. Analyze: Data Interpretation
- 2.6. Formulate: Data Verification
- 2.7. Publish: Research Report
- 2.8. Repeat: Report Update
3. Executive Summary
4. Market Overview
- 4.1. Introduction
- 4.2. Esters Market, by Region
5. Market Insights
- 5.1. Market Dynamics
- 5.1.1. Drivers
- 5.1.1.1. Increasing demand for esters from cosmetic and personal care industries
- 5.1.1.2. Adoption across pharmaceutical and food processing sector
- 5.1.2. Restraints
- 5.1.2.1. High cost of production of esters
- 5.1.3. Opportunities
- 5.1.3.1. Ongoing shift toward natural and organic products
- 5.1.3.2. Development of bio-based esters
- 5.1.4. Challenges
- 5.1.4.1. Adverse health effects associated with exposure of esters
- 5.1.1. Drivers
- 5.2. Market Segmentation Analysis
- 5.2.1. Type: Increasing adoption of fatty esters across diverse end-use sectors
- 5.2.2. Application: High penetration of esters in pharmaceutical manufacturing procedures
- 5.3. Market Trend Analysis
- 5.4. Cumulative Impact of High Inflation
- 5.5. Porter's Five Forces Analysis
- 5.5.1. Threat of New Entrants
- 5.5.2. Threat of Substitutes
- 5.5.3. Bargaining Power of Customers
- 5.5.4. Bargaining Power of Suppliers
- 5.5.5. Industry Rivalry
- 5.6. Value Chain & Critical Path Analysis
- 5.7. Regulatory Framework
6. Esters Market, by Type
- 6.1. Introduction
- 6.2. Acrylic Esters
- 6.3. Allyl & Aromatic Esters
- 6.4. Cellulose Esters
- 6.5. Fatty Esters
- 6.6. Phosphate Esters
7. Esters Market, by Application
- 7.1. Introduction
- 7.2. Automotive & Transportation
- 7.3. Food & Beverages
- 7.4. Packaging
- 7.5. Paints & Coatings
- 7.6. Personal Care
- 7.7. Pharmaceuticals
- 7.8. Surfactants & Detergents
8. Americas Esters Market
- 8.1. Introduction
- 8.2. Argentina
- 8.3. Brazil
- 8.4. Canada
- 8.5. Mexico
- 8.6. United States
9. Asia-Pacific Esters Market
- 9.1. Introduction
- 9.2. Australia
- 9.3. China
- 9.4. India
- 9.5. Indonesia
- 9.6. Japan
- 9.7. Malaysia
- 9.8. Philippines
- 9.9. Singapore
- 9.10. South Korea
- 9.11. Taiwan
- 9.12. Thailand
- 9.13. Vietnam
10. Europe, Middle East & Africa Esters Market
- 10.1. Introduction
- 10.2. Denmark
- 10.3. Egypt
- 10.4. Finland
- 10.5. France
- 10.6. Germany
- 10.7. Israel
- 10.8. Italy
- 10.9. Netherlands
- 10.10. Nigeria
- 10.11. Norway
- 10.12. Poland
- 10.13. Qatar
- 10.14. Russia
- 10.15. Saudi Arabia
- 10.16. South Africa
- 10.17. Spain
- 10.18. Sweden
- 10.19. Switzerland
- 10.20. Turkey
- 10.21. United Arab Emirates
- 10.22. United Kingdom
11. Competitive Landscape
- 11.1. FPNV Positioning Matrix
- 11.2. Market Share Analysis, By Key Player
- 11.3. Competitive Scenario Analysis, By Key Player
- 11.3.1. Award, Recognition, & Expansion
- 11.3.1.1. OQ Chemicals Launches New Pilot Plant for Customized Esters
- 11.3.1.2. Petron Secures Regulatory Approval for Coconut Methyl Ester Plant in Philippines
- 11.3.1.3. Ester Industries Unit Begins Production at New Polyester Film Plant in Telangana
- 11.3.1. Award, Recognition, & Expansion
12. Competitive Portfolio
- 12.1. Key Company Profiles
- 12.1.1. ABITEC Corporation
- 12.1.2. Archer-Daniels-Midland Company
- 12.1.3. Arkema S.A.
- 12.1.4. BASF SE
- 12.1.5. Berg + Schmidt GmbH & Co. KG
- 12.1.6. Biotage
- 12.1.7. Cargill, Incorporated
- 12.1.8. CEM Corporation
- 12.1.9. Chemra GmbH
- 12.1.10. Croda International PLC
- 12.1.11. DuPont de Nemours, Inc.
- 12.1.12. eChem Ltd.
- 12.1.13. Gattefosse
- 12.1.14. Interfat SAU
- 12.1.15. Koninklijke DSM N.V.
- 12.1.16. Lipotype GmbH
- 12.1.17. Merck KGaA
- 12.1.18. Solvay S.A.
- 12.1.19. Stepan Company
- 12.1.20. Subhash Chemical Industries Private Ltd.
- 12.1.21. Sumitomo Chemical Co., Ltd.
- 12.1.22. The Dow Chemical Company
- 12.1.23. The Procter & Gamble Company
- 12.1.24. Thermo Fisher Scientific Inc.
- 12.1.25. Tokyo Chemical Industry Co., Ltd.
- 12.2. Key Product Portfolio
13. Appendix
- 13.1. Discussion Guide
- 13.2. License & Pricing
LIST OF FIGURES
- FIGURE 1. ESTERS MARKET RESEARCH PROCESS
- FIGURE 2. ESTERS MARKET SIZE, 2023 VS 2030
- FIGURE 3. ESTERS MARKET SIZE, 2018-2030 (USD MILLION)
- FIGURE 4. ESTERS MARKET SIZE, BY REGION, 2023 VS 2030 (%)
- FIGURE 5. ESTERS MARKET SIZE, BY REGION, 2023 VS 2024 VS 2030 (USD MILLION)
- FIGURE 6. ESTERS MARKET DYNAMICS
- FIGURE 7. ESTERS MARKET SIZE, BY TYPE, 2023 VS 2030 (%)
- FIGURE 8. ESTERS MARKET SIZE, BY TYPE, 2023 VS 2024 VS 2030 (USD MILLION)
- FIGURE 9. ESTERS MARKET SIZE, BY APPLICATION, 2023 VS 2030 (%)
- FIGURE 10. ESTERS MARKET SIZE, BY APPLICATION, 2023 VS 2024 VS 2030 (USD MILLION)
- FIGURE 11. AMERICAS ESTERS MARKET SIZE, BY COUNTRY, 2023 VS 2030 (%)
- FIGURE 12. AMERICAS ESTERS MARKET SIZE, BY COUNTRY, 2023 VS 2024 VS 2030 (USD MILLION)
- FIGURE 13. UNITED STATES ESTERS MARKET SIZE, BY STATE, 2023 VS 2030 (%)
- FIGURE 14. UNITED STATES ESTERS MARKET SIZE, BY STATE, 2023 VS 2024 VS 2030 (USD MILLION)
- FIGURE 15. ASIA-PACIFIC ESTERS MARKET SIZE, BY COUNTRY, 2023 VS 2030 (%)
- FIGURE 16. ASIA-PACIFIC ESTERS MARKET SIZE, BY COUNTRY, 2023 VS 2024 VS 2030 (USD MILLION)
- FIGURE 17. EUROPE, MIDDLE EAST & AFRICA ESTERS MARKET SIZE, BY COUNTRY, 2023 VS 2030 (%)
- FIGURE 18. EUROPE, MIDDLE EAST & AFRICA ESTERS MARKET SIZE, BY COUNTRY, 2023 VS 2024 VS 2030 (USD MILLION)
- FIGURE 19. ESTERS MARKET, FPNV POSITIONING MATRIX, 2023
- FIGURE 20. ESTERS MARKET SHARE, BY KEY PLAYER, 2023
LIST OF TABLES
- TABLE 1. ESTERS MARKET SEGMENTATION & COVERAGE
- TABLE 2. UNITED STATES DOLLAR EXCHANGE RATE, 2018-2023
- TABLE 3. ESTERS MARKET SIZE, 2018-2030 (USD MILLION)
- TABLE 4. GLOBAL ESTERS MARKET SIZE, BY REGION, 2018-2030 (USD MILLION)
- TABLE 5. ESTERS MARKET SIZE, BY TYPE, 2018-2030 (USD MILLION)
- TABLE 6. ESTERS MARKET SIZE, BY ACRYLIC ESTERS, BY REGION, 2018-2030 (USD MILLION)
- TABLE 7. ESTERS MARKET SIZE, BY ALLYL & AROMATIC ESTERS, BY REGION, 2018-2030 (USD MILLION)
- TABLE 8. ESTERS MARKET SIZE, BY CELLULOSE ESTERS, BY REGION, 2018-2030 (USD MILLION)
- TABLE 9. ESTERS MARKET SIZE, BY FATTY ESTERS, BY REGION, 2018-2030 (USD MILLION)
- TABLE 10. ESTERS MARKET SIZE, BY PHOSPHATE ESTERS, BY REGION, 2018-2030 (USD MILLION)
- TABLE 11. ESTERS MARKET SIZE, BY APPLICATION, 2018-2030 (USD MILLION)
- TABLE 12. ESTERS MARKET SIZE, BY AUTOMOTIVE & TRANSPORTATION, BY REGION, 2018-2030 (USD MILLION)
- TABLE 13. ESTERS MARKET SIZE, BY FOOD & BEVERAGES, BY REGION, 2018-2030 (USD MILLION)
- TABLE 14. ESTERS MARKET SIZE, BY PACKAGING, BY REGION, 2018-2030 (USD MILLION)
- TABLE 15. ESTERS MARKET SIZE, BY PAINTS & COATINGS, BY REGION, 2018-2030 (USD MILLION)
- TABLE 16. ESTERS MARKET SIZE, BY PERSONAL CARE, BY REGION, 2018-2030 (USD MILLION)
- TABLE 17. ESTERS MARKET SIZE, BY PHARMACEUTICALS, BY REGION, 2018-2030 (USD MILLION)
- TABLE 18. ESTERS MARKET SIZE, BY SURFACTANTS & DETERGENTS, BY REGION, 2018-2030 (USD MILLION)
- TABLE 19. AMERICAS ESTERS MARKET SIZE, BY TYPE, 2018-2030 (USD MILLION)
- TABLE 20. AMERICAS ESTERS MARKET SIZE, BY APPLICATION, 2018-2030 (USD MILLION)
- TABLE 21. AMERICAS ESTERS MARKET SIZE, BY COUNTRY, 2018-2030 (USD MILLION)
- TABLE 22. ARGENTINA ESTERS MARKET SIZE, BY TYPE, 2018-2030 (USD MILLION)
- TABLE 23. ARGENTINA ESTERS MARKET SIZE, BY APPLICATION, 2018-2030 (USD MILLION)
- TABLE 24. BRAZIL ESTERS MARKET SIZE, BY TYPE, 2018-2030 (USD MILLION)
- TABLE 25. BRAZIL ESTERS MARKET SIZE, BY APPLICATION, 2018-2030 (USD MILLION)
- TABLE 26. CANADA ESTERS MARKET SIZE, BY TYPE, 2018-2030 (USD MILLION)
- TABLE 27. CANADA ESTERS MARKET SIZE, BY APPLICATION, 2018-2030 (USD MILLION)
- TABLE 28. MEXICO ESTERS MARKET SIZE, BY TYPE, 2018-2030 (USD MILLION)
- TABLE 29. MEXICO ESTERS MARKET SIZE, BY APPLICATION, 2018-2030 (USD MILLION)
- TABLE 30. UNITED STATES ESTERS MARKET SIZE, BY TYPE, 2018-2030 (USD MILLION)
- TABLE 31. UNITED STATES ESTERS MARKET SIZE, BY APPLICATION, 2018-2030 (USD MILLION)
- TABLE 32. UNITED STATES ESTERS MARKET SIZE, BY STATE, 2018-2030 (USD MILLION)
- TABLE 33. ASIA-PACIFIC ESTERS MARKET SIZE, BY TYPE, 2018-2030 (USD MILLION)
- TABLE 34. ASIA-PACIFIC ESTERS MARKET SIZE, BY APPLICATION, 2018-2030 (USD MILLION)
- TABLE 35. ASIA-PACIFIC ESTERS MARKET SIZE, BY COUNTRY, 2018-2030 (USD MILLION)
- TABLE 36. AUSTRALIA ESTERS MARKET SIZE, BY TYPE, 2018-2030 (USD MILLION)
- TABLE 37. AUSTRALIA ESTERS MARKET SIZE, BY APPLICATION, 2018-2030 (USD MILLION)
- TABLE 38. CHINA ESTERS MARKET SIZE, BY TYPE, 2018-2030 (USD MILLION)
- TABLE 39. CHINA ESTERS MARKET SIZE, BY APPLICATION, 2018-2030 (USD MILLION)
- TABLE 40. INDIA ESTERS MARKET SIZE, BY TYPE, 2018-2030 (USD MILLION)
- TABLE 41. INDIA ESTERS MARKET SIZE, BY APPLICATION, 2018-2030 (USD MILLION)
- TABLE 42. INDONESIA ESTERS MARKET SIZE, BY TYPE, 2018-2030 (USD MILLION)
- TABLE 43. INDONESIA ESTERS MARKET SIZE, BY APPLICATION, 2018-2030 (USD MILLION)
- TABLE 44. JAPAN ESTERS MARKET SIZE, BY TYPE, 2018-2030 (USD MILLION)
- TABLE 45. JAPAN ESTERS MARKET SIZE, BY APPLICATION, 2018-2030 (USD MILLION)
- TABLE 46. MALAYSIA ESTERS MARKET SIZE, BY TYPE, 2018-2030 (USD MILLION)
- TABLE 47. MALAYSIA ESTERS MARKET SIZE, BY APPLICATION, 2018-2030 (USD MILLION)
- TABLE 48. PHILIPPINES ESTERS MARKET SIZE, BY TYPE, 2018-2030 (USD MILLION)
- TABLE 49. PHILIPPINES ESTERS MARKET SIZE, BY APPLICATION, 2018-2030 (USD MILLION)
- TABLE 50. SINGAPORE ESTERS MARKET SIZE, BY TYPE, 2018-2030 (USD MILLION)
- TABLE 51. SINGAPORE ESTERS MARKET SIZE, BY APPLICATION, 2018-2030 (USD MILLION)
- TABLE 52. SOUTH KOREA ESTERS MARKET SIZE, BY TYPE, 2018-2030 (USD MILLION)
- TABLE 53. SOUTH KOREA ESTERS MARKET SIZE, BY APPLICATION, 2018-2030 (USD MILLION)
- TABLE 54. TAIWAN ESTERS MARKET SIZE, BY TYPE, 2018-2030 (USD MILLION)
- TABLE 55. TAIWAN ESTERS MARKET SIZE, BY APPLICATION, 2018-2030 (USD MILLION)
- TABLE 56. THAILAND ESTERS MARKET SIZE, BY TYPE, 2018-2030 (USD MILLION)
- TABLE 57. THAILAND ESTERS MARKET SIZE, BY APPLICATION, 2018-2030 (USD MILLION)
- TABLE 58. VIETNAM ESTERS MARKET SIZE, BY TYPE, 2018-2030 (USD MILLION)
- TABLE 59. VIETNAM ESTERS MARKET SIZE, BY APPLICATION, 2018-2030 (USD MILLION)
- TABLE 60. EUROPE, MIDDLE EAST & AFRICA ESTERS MARKET SIZE, BY TYPE, 2018-2030 (USD MILLION)
- TABLE 61. EUROPE, MIDDLE EAST & AFRICA ESTERS MARKET SIZE, BY APPLICATION, 2018-2030 (USD MILLION)
- TABLE 62. EUROPE, MIDDLE EAST & AFRICA ESTERS MARKET SIZE, BY COUNTRY, 2018-2030 (USD MILLION)
- TABLE 63. DENMARK ESTERS MARKET SIZE, BY TYPE, 2018-2030 (USD MILLION)
- TABLE 64. DENMARK ESTERS MARKET SIZE, BY APPLICATION, 2018-2030 (USD MILLION)
- TABLE 65. EGYPT ESTERS MARKET SIZE, BY TYPE, 2018-2030 (USD MILLION)
- TABLE 66. EGYPT ESTERS MARKET SIZE, BY APPLICATION, 2018-2030 (USD MILLION)
- TABLE 67. FINLAND ESTERS MARKET SIZE, BY TYPE, 2018-2030 (USD MILLION)
- TABLE 68. FINLAND ESTERS MARKET SIZE, BY APPLICATION, 2018-2030 (USD MILLION)
- TABLE 69. FRANCE ESTERS MARKET SIZE, BY TYPE, 2018-2030 (USD MILLION)
- TABLE 70. FRANCE ESTERS MARKET SIZE, BY APPLICATION, 2018-2030 (USD MILLION)
- TABLE 71. GERMANY ESTERS MARKET SIZE, BY TYPE, 2018-2030 (USD MILLION)
- TABLE 72. GERMANY ESTERS MARKET SIZE, BY APPLICATION, 2018-2030 (USD MILLION)
- TABLE 73. ISRAEL ESTERS MARKET SIZE, BY TYPE, 2018-2030 (USD MILLION)
- TABLE 74. ISRAEL ESTERS MARKET SIZE, BY APPLICATION, 2018-2030 (USD MILLION)
- TABLE 75. ITALY ESTERS MARKET SIZE, BY TYPE, 2018-2030 (USD MILLION)
- TABLE 76. ITALY ESTERS MARKET SIZE, BY APPLICATION, 2018-2030 (USD MILLION)
- TABLE 77. NETHERLANDS ESTERS MARKET SIZE, BY TYPE, 2018-2030 (USD MILLION)
- TABLE 78. NETHERLANDS ESTERS MARKET SIZE, BY APPLICATION, 2018-2030 (USD MILLION)
- TABLE 79. NIGERIA ESTERS MARKET SIZE, BY TYPE, 2018-2030 (USD MILLION)
- TABLE 80. NIGERIA ESTERS MARKET SIZE, BY APPLICATION, 2018-2030 (USD MILLION)
- TABLE 81. NORWAY ESTERS MARKET SIZE, BY TYPE, 2018-2030 (USD MILLION)
- TABLE 82. NORWAY ESTERS MARKET SIZE, BY APPLICATION, 2018-2030 (USD MILLION)
- TABLE 83. POLAND ESTERS MARKET SIZE, BY TYPE, 2018-2030 (USD MILLION)
- TABLE 84. POLAND ESTERS MARKET SIZE, BY APPLICATION, 2018-2030 (USD MILLION)
- TABLE 85. QATAR ESTERS MARKET SIZE, BY TYPE, 2018-2030 (USD MILLION)
- TABLE 86. QATAR ESTERS MARKET SIZE, BY APPLICATION, 2018-2030 (USD MILLION)
- TABLE 87. RUSSIA ESTERS MARKET SIZE, BY TYPE, 2018-2030 (USD MILLION)
- TABLE 88. RUSSIA ESTERS MARKET SIZE, BY APPLICATION, 2018-2030 (USD MILLION)
- TABLE 89. SAUDI ARABIA ESTERS MARKET SIZE, BY TYPE, 2018-2030 (USD MILLION)
- TABLE 90. SAUDI ARABIA ESTERS MARKET SIZE, BY APPLICATION, 2018-2030 (USD MILLION)
- TABLE 91. SOUTH AFRICA ESTERS MARKET SIZE, BY TYPE, 2018-2030 (USD MILLION)
- TABLE 92. SOUTH AFRICA ESTERS MARKET SIZE, BY APPLICATION, 2018-2030 (USD MILLION)
- TABLE 93. SPAIN ESTERS MARKET SIZE, BY TYPE, 2018-2030 (USD MILLION)
- TABLE 94. SPAIN ESTERS MARKET SIZE, BY APPLICATION, 2018-2030 (USD MILLION)
- TABLE 95. SWEDEN ESTERS MARKET SIZE, BY TYPE, 2018-2030 (USD MILLION)
- TABLE 96. SWEDEN ESTERS MARKET SIZE, BY APPLICATION, 2018-2030 (USD MILLION)
- TABLE 97. SWITZERLAND ESTERS MARKET SIZE, BY TYPE, 2018-2030 (USD MILLION)
- TABLE 98. SWITZERLAND ESTERS MARKET SIZE, BY APPLICATION, 2018-2030 (USD MILLION)
- TABLE 99. TURKEY ESTERS MARKET SIZE, BY TYPE, 2018-2030 (USD MILLION)
- TABLE 100. TURKEY ESTERS MARKET SIZE, BY APPLICATION, 2018-2030 (USD MILLION)
- TABLE 101. UNITED ARAB EMIRATES ESTERS MARKET SIZE, BY TYPE, 2018-2030 (USD MILLION)
- TABLE 102. UNITED ARAB EMIRATES ESTERS MARKET SIZE, BY APPLICATION, 2018-2030 (USD MILLION)
- TABLE 103. UNITED KINGDOM ESTERS MARKET SIZE, BY TYPE, 2018-2030 (USD MILLION)
- TABLE 104. UNITED KINGDOM ESTERS MARKET SIZE, BY APPLICATION, 2018-2030 (USD MILLION)
- TABLE 105. ESTERS MARKET, FPNV POSITIONING MATRIX, 2023
- TABLE 106. ESTERS MARKET SHARE, BY KEY PLAYER, 2023
- TABLE 107. ESTERS MARKET LICENSE & PRICING

