
PUBLISHER: Juniper Research Ltd | PRODUCT CODE: 1674508

PUBLISHER: Juniper Research Ltd | PRODUCT CODE: 1674508
Global Virtual Cards Market 2025-2029
'Virtual Card Transactions to Soar Globally, Exceeding $17.4 Trillion by 2029'
| KEY STATISTICS | |
|---|---|
| Total virtual cards revenue in 2025: | $5.2tn |
| Total virtual cards revenue in 2029: | $17.4tn |
| 2025 to 2029 market growth: | 235% |
| Forecast period: | 2025-2029 |
Overview
Our "Virtual Cards" research suite provides a comprehensive and in-depth analysis of the role of virtual cards in the digital payments landscape; enabling stakeholders such as businesses, financial institutions, card networks and fintechs to understand future growth, key trends and the competitive environment. The report evaluates the features of virtual cards, highlights key market trends, and examines regional progress in virtual card adoption.
The suite includes several different options that can be purchased separately, including access to data mapping the future growth of virtual cards, an insightful study uncovering the latest trends and opportunities within the financial markets, and a document containing extensive analysis of the 18 market leaders facilitating virtual card provision. The coverage can also be purchased as a Full Research Suite, containing all these elements, at a substantial discount.
This report serves as an essential resource for understanding the rapidly evolving virtual cards market, empowering stakeholders to shape effective future strategies. With its comprehensive insights and extensive coverage, this research suite is an invaluable tool for navigating and planning in a fast-growing landscape.
Key Features
- Market Dynamics: Insights into key trends and market expansion challenges within the virtual cards market, including drivers and barriers for virtual card adoption. The report addresses the role of virtual cards in easing cashflow management, the use of virtual cards in eCommerce, and the distinctive benefits that virtual cards can bring to various industry segments. The research also features a Country Readiness Index on the current development and segment growth of the virtual cards market across eight key regions, as well as providing a future outlook.
- Key Takeaways & Strategic Recommendations: In-depth analysis of key development opportunities and findings within the virtual cards market, accompanied by strategic recommendations for stakeholders.
- Benchmark Industry Forecasts: The virtual cards dataset includes forecasts for the total value of the virtual card market, including the total revenue to be gained through provisioning and managing virtual cards, and the transaction volume of various market segments.
- Juniper Research Competitor Leaderboard: Key market player capability and capacity assessment for 18 virtual card vendors, via the Juniper Research Competitor Leaderboard; featuring market size for major players in the virtual card provisioning market.
SAMPLE VIEW
Market Data & Forecasting Report
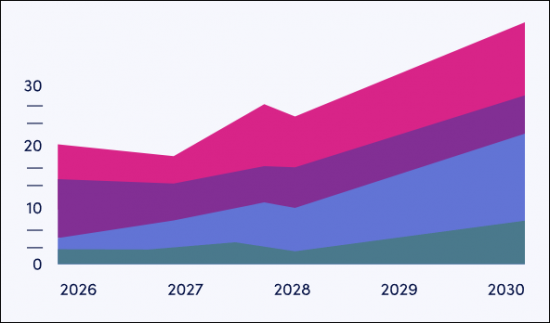
The numbers tell you what's happening, but our written report details why, alongside the methodologies.
SAMPLE VIEW
Market Trends & Strategies Report
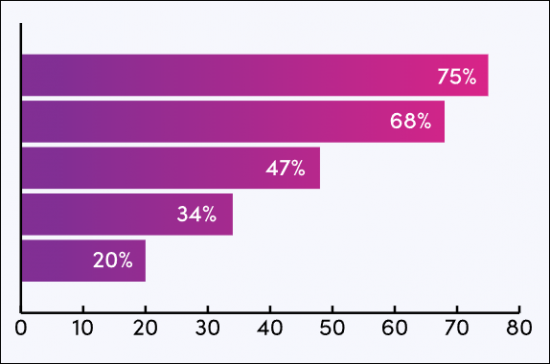
A comprehensive analysis of the current market landscape, alongside strategic recommendations.
Market Data & Forecasting Report
The market-leading research suite for the Virtual Cards market includes access to the full set of forecast data of 89 tables and 34,200 datapoints. Metrics in the research suite include:
- Total Transaction Volume, Value, and Revenue of the Virtual Cards Market
- Total Transaction Volume, Value and Revenue of the Virtual Cards Market, Split by the Following Market Segments:
- B2B Payments
- B2C POS Payments
- B2C Remote Payments
Juniper Research's Interactive Forecast Excel contains the following functionality:
- Statistics Analysis: Users benefit from the ability to search for specific metrics, displayed for all regions and countries across the data period. Graphs are easily modified and can be exported to the clipboard.
- Country Data Tool: This tool lets users look at metrics for all regions and countries in the forecast period. Users can refine the metrics displayed via a search bar.
- Country Comparison Tool: Users can select and compare specific countries. The ability to export graphs is included in this tool.
- What-if Analysis: Here, users can compare forecast metrics against their own assumptions, via five interactive scenarios.
Market Trends & Strategies Report
This report examines the "Virtual Cards" market landscape in depth; assessing trends and factors shaping the evolution of this rapidly growing market. The report delivers comprehensive analysis of the strategic opportunities for fintechs offering virtual cards; addressing key verticals such as government, healthcare, fleet, and travel. This report also includes evaluation of key country-level opportunities for stakeholders in the virtual cards market.
Competitor Leaderboard Report
The Competitor Leaderboard report provides a detailed evaluation and market positioning for 18 leading vendors in the virtual cards space. The vendors are positioned as established leaders, leading challengers, or disruptors and challengers, based on capacity and capability assessments:
|
|
This document is centred around the Juniper Research Competitor Leaderboard; a vendor positioning tool that provides an at-a-glance view of the competitive landscape in a market, backed by a robust methodology.
Table of Contents
Market Trends & Strategies
1. Market Summary
- 1.1. Key Takeaways
- 1.2. Strategic Recommendations
2. Market Summary
- 2.1.1. Introduction
- 2.1.2. Key Features of Virtual Cards
- Figure 2.1: Key Features of Virtual Cards
- 2.1.3. Key Actors Involved in Virtual Cards
- 2.1.4. Token Service Provisioning: Digital Cards
- 2.1.5. Virtual vs Physical Cards
- Figure 2.2: Virtual vs Physical Card Differences
- 2.2. Key Trends
- 2.2.1. Apple Cash
- Figure 2.3: Apple Cash
- 2.2.2. Tokenisation Blurs the Line Between Virtual and Physical Cards
- 2.2.3. Easy Integration Simplifies Institutional Adoption of Virtual Cards
- 2.2.4. How Will Other Payment Methods Challenge Virtual Cards?
- i. A2A payments
- ii. Cash
- iii. Mobile Money
- 2.2.1. Apple Cash
3. Sector Analysis
- 3.1. B2B Sector Analysis
- Figure 3.1: B2B Use Cases for Virtual Cards
- 3.1.1. Travel & Expense
- 3.1.2. Supply Chain
- 3.1.3. Fleet
- 3.1.4. Healthcare
- 3.1.5. Gig Economy
- 3.1.6. Real Estate
- 3.1.7. Travel Agencies
- 3.1.8. Government
- 3.1.9. Payroll
- 3.1.10. Consumer Sector
- i. Energy Bills & Utilities
- ii. eCommerce
4. Country Readiness Index
- 4.1. Introduction to Country Readiness Index
- Figure 4.1: Virtual Cards Country Readiness Index: Regional Definitions
- Figure 4.2: Juniper Research Country Readiness Scoring Index: Virtual Cards
- Figure 4.3: Juniper Research Country Readiness Index: Virtual Cards
- Figure 4.4: Virtual Cards Country Readiness Index: Market Segments
- 4.2. Focus Market
- i. Strong B2B Sectors
- Figure 4.5: Total Virtual Card Transactions (m), Split by Seven Key Focus Markets, 2025-2029
- ii. The US: Focus Market
- iii. Focus Market: India
- i. Strong B2B Sectors
- 4.3. Growth Markets
- Figure 4.6: Total Virtual Card Transactions (m), Split by Growth Markets, 2025-2029
- i. Development in Digital & Physical Infrastructure
- 4.4. Saturated Markets
- Figure 4.7: Total Virtual Card Transactions (m), Split by Eight Key Saturated Markets, 2025-2029
- i. Entrenched Competition from Instant Payment Services
- ii. Pockets of Growth
- 4.5. Developing Markets
- Figure 4.8: Total Virtual Card Transactions (m), Split by Key Developing Markets, 2025-2029
- i. Low Investment in Payments Innovations
- ii. Prevalence of Mobile Money
- Table 4.9: Juniper Research's Country Readiness Index Heatmap: North America
- Table 4.10: Juniper Research's Country Readiness Index Heatmap: Latin America
- Table 4.11: Juniper Research's Country Readiness Index Heatmap: West Europe
- Table 4.12: Juniper Research's Country Readiness Index Heatmap: Central & Eastern Europe
- Table 4.13: Juniper Research's Country Readiness Index Heatmap: Far East & China
- Figure 4.14: Juniper Research's Country Readiness Index Heatmap: Indian Subcontinent
- Figure 4.15: Juniper Research's Country Readiness Index Heatmap: Rest of Asia Pacific
- Table 4.16: Juniper Research's Country Readiness Index Heatmap: Africa & Middle East
Competitor Leaderboard
1. Competitor Leaderboard
- 1.1. Why Read This Report
- Figure 1.1: Juniper Research Competitor Leaderboard Vendors: Virtual Cards
- Figure 1.2: Juniper Research Competitor Leaderboard: Virtual Cards
- Figure 1.3: Juniper Research Competitor Leaderboard: Virtual Card Vendor Ranking
- Table 1.4: Juniper Research Competitor Leaderboard Virtual Cards - Heatmap
2. Company Profiles
- 2.1. Virtual Card Vendor Profiles
- 2.1.1. Adyen
- i. Corporate
- ii. Geographic Spread
- iii. Key Clients & Strategic Partnerships
- iv. High-level View of Offerings
- v. Juniper Research's View: Key Strengths and Strategic Development Opportunities
- 2.1.2. Airwallex
- i. Corporate
- ii. Geographical Spread
- iii. Key Clients & Partnerships
- iv. High-level View of Offerings
- v. Juniper Research's View: Key Strengths and Strategic Development Opportunities
- 2.1.3. American Express
- i. Corporate
- ii. Geographic Spread
- iii. Key Clients & Partnerships
- iv. High-level View of Offerings
- v. Juniper Research's View: Key Strengths & Strategic Development Opportunities
- 2.1.4. Conferma
- i. Corporate
- ii. Geographic Spread
- iii. Key Clients & Strategic Partnerships
- iv. High-level View of Offerings
- v. Juniper Research's View: Key Strengths & Strategic Development Opportunities
- 2.1.5. Discover
- i. Corporate
- ii. Geographic Spread
- iii. Key Clients & Strategic Partnerships
- iv. High-level View of Offerings
- v. Juniper Research's View: Key Strengths & Strategic Development Opportunities
- 2.1.6. Enfuce
- i. Corporate
- ii. Geographic Spread
- iii. Key Clients & Strategic Partnerships
- iv. High-level View of Offerings
- v. Juniper Research's View: Key Strengths & Strategic Development Opportunities
- 2.1.7. Flutterwave
- i. Corporate
- ii. Geographic Spread
- iii. Key Clients & Strategic Partnerships
- iv. High-level View of Offerings
- v. Juniper Research's View: Key Strengths & Strategic Development Opportunities
- 2.1.8. Nexi Group
- i. Corporate
- Figure 2.1: Nexi Group's Financial Snapshot, (Euro-bn), 2020-2023
- ii. Geographic Spread
- iii. Key Clients & Strategic Partnerships
- iv. High-level View of Offerings
- v. Juniper Research's View: Key Strengths & Strategic Development Opportunities
- i. Corporate
- 2.1.9. Marqeta
- i. Corporate
- ii. Geographic Spread
- iii. Key Clients & Strategic Partnerships
- iv. High-level View of Offerings
- v. Juniper Research's View: Key Strengths & Strategic Development Opportunities
- 2.1.10. Mastercard
- i. Corporate
- ii. Geographic Spread
- iii. Key Clients & Strategic Partnerships
- iv. High-level View of Offerings
- v. Juniper Research's View: Key Strengths & Strategic Development Opportunities
- 2.1.11. Payhawk
- i. Corporate
- ii. Geographic Spread
- iii. Key Clients & Strategic Partnerships
- iv. High-level View of Offerings
- v. Juniper Research's View: Key Strengths & Strategic Development Opportunities
- 2.1.12. Pleo
- i. Corporate
- ii. Geographic Spread
- iii. Key Clients & Strategic Partnerships
- iv. High-level View of Offerings
- Figure 2.2: Pleo's Company Spending Dashboard
- v. Juniper Research's View: Key Strengths & Strategic Development Opportunities
- 2.1.13. Stripe
- i. Corporate
- ii. Geographic Spread
- iii. Key Clients & Strategic Partnerships
- iv. High-level View of Offerings
- v. Juniper Research's View: Key Strengths & Strategic Development Opportunities
- 2.1.14. Visa
- i. Corporate
- ii. Geographic Spread
- iii. Key Clients & Strategic Partnerships
- iv. High-level View of Offerings
- v. Juniper Research's View: Key Strengths & Strategic Development Opportunities
- 2.1.15. Wallester
- i. Corporate
- ii. Geographic Spread
- iii. Key Clients & Strategic Partnerships
- iv. High-level View of Offerings
- v. Juniper Research's View: Key Strengths & Strategic Development Opportunities
- 2.1.16. WEX
- i. Corporate
- ii. Geographic Spread
- iii. Key Clients & Strategic Partnerships
- iv. High-level View of Offerings
- v. Juniper Research's View: Key Strengths & Strategic Development Opportunities
- 2.1.17. Wise
- i. Corporate
- ii. Geographic Spread
- iii. Key Clients & Strategic Partnerships
- iv. High-level View of Offerings
- Figure 2.3: Wise Dashboard Example
- v. Juniper Research's View: Key Strengths & Strategic Development Opportunities
- 2.1.1. Adyen
- 2.2. Juniper Research Leaderboard Assessment Methodology
- 2.2.1. Limitations & Interpretations
- Table 2.4: Juniper Research Leaderboard Assessment Criteria: Virtual Cards
- 2.2.1. Limitations & Interpretations
- 2.3. Related Research
Data & Forecasting
1. Market Overview
- 1.1.1. Introduction
- 1.1.2. Methodology & Assumptions
- Figure 1.1: B2C Virtual Cards Forecast Methodology
- Figure 1.2: B2B Virtual Cards Forecast Methodology
2. Market Forecast
- 2.1. Global Virtual Cards Forecast
- 2.1.1. Virtual Cards Transaction Volume
- Figure and Table 2.1: Virtual Card Transaction Volume (m), 2025-2029, Split by Sector
- 2.1.2. Virtual Cards Transaction Value
- Figure and Table 2.2: Virtual Card Transaction Value ($bn), Split by Sector, ($b), 2025-2029
- 2.1.3. Total Virtual Card Revenue
- Figure and Table 2.3: Total Virtual Card Revenue ($bn), Split by Sector, 2025-2029
- 2.1.1. Virtual Cards Transaction Volume
3. B2B Virtual Cards Forecast
- 3.1. B2B Virtual Cards
- 3.1.1. B2B Transaction Volume
- Figure and Table 3.1: B2B Transaction Volume per annum (m), Split by Region, 2025-2029
- Table 3.2: B2B Virtual Card Transaction Volume per annum (m), Split by Industry Segments, 2025-2029
- 3.1.2. B2B Virtual Card Spend
- Figure and Table 3.3: B2B Virtual Card Spend per annum ($bn), Split by Region, 2025-2029
- Figure 3.4: B2B Value of Virtual Card Transactions per annum ($m), Split by Industry Segments, 2025-2029
- 3.1.3. B2B Virtual Card Revenue
- Figure and Table 3.5: B2B Virtual Card Revenue per annum ($bn), Split by Region, 2025-2029
- Figure 3.6: B2B Virtual Card Revenue per annum ($bn), Split by Sector, 2025-2029
- 3.1.1. B2B Transaction Volume
4. B2C POS Virtual Cards Forecast
- 4.1.1. B2C POS Virtual Card Transaction Volume
- Figure and Table 4.1: B2C POS Virtual Card Transaction Volume (m), Split by Region, 2025-2029
- 4.1.2. B2C POS Virtual Card Transaction Value
- Figure and Table 4.2: Total B2C POS Virtual Card Transaction Value ($m), Split by Region, 2025-2029
- 4.1.3. B2C POS Virtual Card Revenue
- Figure and Table 4.3: Total B2C POS Virtual Card Transaction Revenue per annum ($m), Split by Region, 2025-2029
5. B2C Remote Virtual Cards
- 5.1.1. B2C Remote Virtual Card Volume
- Figure and Table 5.1: Total B2C Remote Virtual Card Transaction Volume per annum (m), Split by Region, 2025-2029
- 5.1.2. B2C Remote Virtual Card Value
- Figure and Table 5.2: Total B2C Remote Virtual Card Value ($m), Split by Regions, 2025-2029
- 5.1.3. B2C Remote Virtual Card Revenue
- Figure and Table 5.3: Total B2C Remote Virtual Card Revenue ($m), Split by Region, 2025-2029

