
PUBLISHER: Juniper Research Ltd | PRODUCT CODE: 1777931

PUBLISHER: Juniper Research Ltd | PRODUCT CODE: 1777931
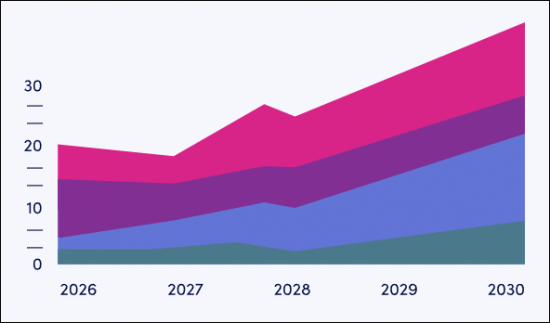
B2B Payments Market: 2025-2030
'B2B Payment Cross-border Transactions to Hit 18 Billion by 2030, as Cross-border Activity Intensifies Despite Tariffs'
| KEY STATISTICS | |
|---|---|
| Total transaction value in 2025: | $187tn |
| Total transaction value in 2030: | $224tn |
| 2025 to 2030 market growth: | 20% |
| Forecast period: | 2025-2030 |
Overview
Juniper Research's "B2B Payments" research suite provides a comprehensive and insightful analysis of this market; enabling stakeholders from B2B payment platform providers to regulators and banks, to understand future growth, key trends and the competitive environment.
The research suite includes several different options that can be purchased separately. The Market Trends & Strategies element includes an insightful analysis of the key areas of progress within B2B payments, including new payment types and automation systems. Additionally, it features Juniper Research's Country Readiness Index, which provides a country-level analysis of the current and future opportunities for B2B payments in 61 different geographies.
The Data & Forecasting element includes access to data mapping the adoption and future growth of the B2B payments market over the next five years, split by cross-border versus domestic transactions, by business size and by payment method.
Additionally, the Competitor Leaderboard document features two vendor positioning models: the Competitor Leaderboard, revealing an extensive analysis of the 19 market leaders in the B2B payments space, and a Future Leaders Index; covering the 18 leading innovators who are becoming important in the market.
The coverage can also be purchased as a full research suite containing the Market Trends & Strategies, Data & Forecasting, and Competitor Leaderboard & Future Leaders Index, and a substantial discount.
Collectively, these documents provide a critical tool for understanding this important market. They allow B2B payment platform providers and payments companies to shape their future strategy; capitalising on future growth opportunities. This research suite's extensive coverage makes it a valuable tool for navigating this market.
All report content is delivered in the English language.
Key Features
- Key Takeaways & Strategic Recommendations: In-depth analysis of key development opportunities, key findings and key strategic recommendations for B2B payment platforms, cross-border payment specialists, banks, and regulators.
- Market Outlook: A breakdown of the B2B payments market by its component segments, with insight into the relative challenges of domestic and cross-border payments. It also examines, in detail, a range of payment types. Value-added services are analysed; assessing their place in the market and what businesses are looking for from these services. The research examines key emerging technologies in the B2B payments market, how they are used in the market, and how they will affect the market in the future. A Country Readiness Index is also included; assessing growth prospects for B2B payments across 61 key countries.
- Benchmark Industry Forecasts: Extensive forecasts for the number and value of B2B payments, split by domestic and cross-border. This is further split by payment channel (cash, cheque, card, virtual card, wire transfer, instant payment, and other means) and by business size (small, medium, and large).
- Juniper Research Competitor Leaderboard & Future Leaders Index: Key player capability and capacity assessment for 19 B2B payment platforms, via the Juniper Research Competitor Leaderboard. The study also contains a Future Leaders Index; positioning 18 key emerging players shaking up the B2B payments market.
SAMPLE VIEW
Market Data & Forecasting Report
The numbers tell you what's happening, but our written report details why, alongside the methodologies.
SAMPLE VIEW
Market Trends & Strategies Report
A comprehensive analysis of the current market landscape, alongside strategic recommendations.
Market Data & Forecasting Report
The market-leading research suite for the "B2B Payments" market includes access to the full set of forecast data of 158 tables and over 61,000 datapoints. Metrics in the research suite include:
- Total Number of B2B Payments
- Total Value of B2B Payments
- Number of Businesses Making Cross-border Payments
These metrics are provided for the following key market verticals:
- Domestic B2B Payments
- Cross-border B2B Payments
This data is also split by the following payment methods:
- Cash
- Cheque
- Card
- Virtual Card
- Wire Transfer
- Instant Payment
- Other Means
The data is also split by transactions being made by small, medium, and large businesses.
Juniper Research Interactive Forecast Excel contains the following functionality:
- Statistics Analysis: Users benefit from the ability to search for specific metrics, displayed for all regions and countries across the data period. Graphs are easily modified and can be exported to the clipboard.
- Country Data Tool: This tool enables users to look at metrics for all regions and countries in the forecast period. Users can refine the metrics displayed via a search bar.
- Country Comparison Tool: Users can select and compare countries. The ability to export graphs is included in this tool.
- What-if Analysis: Here, users can compare forecast metrics against their own assumptions, via 5 interactive scenarios.
Market Trends & Strategies Report
This report examines the "B2B Payments" market landscape in detail; assessing market trends and factors shaping the evolution of this growing market. The report delivers comprehensive analysis of the strategic opportunities in the B2B payments landscape; assessing key market segments, including real-time payments, A2A payments, credit card and debit cards, virtual cards, and other digital payment methods. It also examines their challenges and opportunities, such as the impact of the Trump Administration's tariffs and other economic policies. The report includes evaluation of key country-level opportunities for B2B payments growth; looking at the unique nature of individual B2B payment markets, from new real-time payment rails to the emergence of stablecoins for cross-border transactions.
Competitor Leaderboard Report
The Competitor Leaderboard report provides a detailed evaluation and market positioning for both the larger, established vendors, as well as for the newer, emerging disruptors: via two different vendor positioning tools. The Juniper Research Competitor Leaderboard offers coverage of 19 leading B2B payment platforms; positioning them as established leaders, leading challengers, or disruptors and challengers, based on capacity and capability assessments.
The 19 vendors included are:
|
|
|
The document also features a Feature Leaders Index. The Juniper Research Future Leaders Index provides a visual representation of the competitive positioning of companies in the B2B payments market which are challenging dominant players.
The 18 innovators included are:
|
|
|
Together, the Competitor Leaderboard and the Future Leaders Index give a comprehensive guide to the competitive landscape within B2B payments; providing an important resource for stakeholders.
Table of Contents
Market Trends & Strategies
1. Key Takeaways & Strategic Recommendations
- 1.1. Key Takeaways
- 1.2. Strategic Recommendations
2. Market Landscape & Segmentation
- 2.1. Introduction
- 2.1.1. The Context
- 2.2. Definition & Scope
- 2.3 Key Trends
- 2.3.1. Electronic Payments Increasingly Replacing Paper Cheques
- 2.3.2. Embedded Finance Drives Efficiency and Growth
- 2.3.3. Shift to Real-time Payments
- 2.3.4. A2A (Account-to-account) Payments
- 2.3.5. Pay by Bank and Instant Payments
- 2.3.6. Rise of Virtual Cards
- 2.3.7. Rising Levels of Automation
- 2.4. Challenges
- 2.4.1. General Challenges for Payers, Merchants and PSPs
- i. Fragmented Payment Workflows & Reconciliation Complexity
- ii. Payment Delays
- iii. Lack of Transparency
- iv. Cybersecurity & Fraud Risk
- v. Regulatory Compliance
- vi. Resistance to Technology Adoption
- 2.4.1. General Challenges for Payers, Merchants and PSPs
- 2.5. Challenges Induced by Tariffs
- Table 2.1: Impact of Tariffs for B2B Payment Stakeholders
- Figure 2.2: Impact of Tariffs for B2B Payment Stakeholders
- i. The Domestic Impact of Tariffs
- ii. Cross-border Impact of Tariffs
- 2.6. Solutions & Opportunities
- 2.6.1. Embedded Finance & Fintech Integration
- 2.6.2. Supply Chain Financing & Working Capital Solutions
- i. Enhanced Cashflow Management
- ii. Flexible Payment Options
- 2.6.3. Real-time Data & Analytics
- i. Services Consolidation
- 2.6.4. Digital Wallets and Identity
- 2.6.5. Collaborative Ecosystems
- 2.6.6. Fraud Prevention & Enhanced Security Measures
- 2.6.7. Compliance-as-a-service
- 2.7. Cross-border Versus Domestic B2B Payments
- 2.7.1. Domestic B2B Payments
- i. Automation
- ii. Data-driven Payment Decisions
- 2.7.2. Cross-border B2B Payments
- i. Seamless Cross-border Transactions
- ii. Interoperability
- 2.7.1. Domestic B2B Payments
- 2.8. B2B Payments Channels
- 2.8.1. Real-time Payments/Instant Payments
- 2.8.2. Cheques
- 2.8.3. Cards
- i. Corporate Cards
- ii. Virtual Cards
- 2.8.4. Non-instant Bank Payments
- 2.8.5. Blockchain Payment Networks
- 2.8.6. Central Bank Digital Currencies (CBDCs)
- 2.8.7. Stablecoins
- 2.9. Value-added Services
- 2.9.1. Invoice Financing
- 2.9.2. AP/AR Automation
- 2.9.3. Trade Financing
- 2.10. Value-added Technologies
- 2.10.1. AI
- 2.10.2. Payment Automation
- 2.10.3. Fraud Detection
- 2.10.4. FX Management and Global Payments
- 2.10.5. Blockchain
- 2.10.6. CBDCs
3. Country Readiness Index
- 3.1. Introduction to the Country Readiness Index
- Figure 3.1: Juniper Research's Country Readiness Index Scoring Criteria: B2B Payments
- Figure 3.2: Juniper Research Country Readiness Index: B2B Payments
- Figure 3.3: B2B Payments Country Readiness Index: Market Segments
- 3.2. Regional Analysis
- 3.2.1. North America
- i. US
- 3.2.2. Latin America
- i. Argentina
- ii. Brazil
- 3.2.3. West Europe
- i. EU
- ii. UK
- 3.2.4. Central & East Europe
- i. Poland
- 3.2.5. Far East & China
- i. China
- ii. Japan
- 3.2.6. Indian Subcontinent
- i. India
- 3.2.7. Rest of Asia Pacific
- i. Australia
- ii. Malaysia
- 3.2.8. Africa & Middle East
- i. Nigeria
- ii. Saudi Arabia
- Figure 3.4: Juniper Research's Country Readiness Index Heatmap: North America
- Figure 3.5: Juniper Research's Country Readiness Index Heatmap: Latin America
- Figure 3.6: Juniper Research's Country Readiness Index Heatmap: West Europe60
- Figure 3.7: Juniper Research's Country Readiness Index Heatmap: Central and East Europe
- Figure 3.8: Juniper Research's Country Readiness Index Heatmap: Far East & China
- Figure 3.9: Juniper Research's Country Readiness Index Heatmap: Indian Subcontinent
- Figure 3.10: Juniper Research's Country Readiness Index Heatmap: Rest of Asia Pacific
- Figure 3.11: Juniper Research's Country Readiness Index Heatmap: Africa and Middle East
- 3.2.1. North America
Competitor Leaderboard
1. Juniper Research Competitor Leaderboard
- 1.1. Why Read This Report
- Table 1.1: Juniper Research's Competitor Leaderboard: B2B Payments Vendors Included & Product Portfolio
- Figure 1.2: Juniper Research's Competitor Leaderboard for B2B Payments
- Table 1.3: Juniper Research B2B Payments Vendors & Positioning
- Table 1.4: Juniper Research's Competitor Leaderboard Heatmap B2B Payments Vendors (Part 1 of 2)
- Table 1.4: Juniper Research's Competitor Leaderboard Heatmap B2B Payments Vendors (Part 2 of 2)
2. Competitor Leaderboard Company Profiles
- 2.1. Vendor Profiles
- 2.1.1. ACI Worldwide
- i. Corporate
- Table 2.1: ACI Worldwide's Financial Snapshot ($m), 2022-2024
- ii. Geographical Spread
- iii. Key Clients & Strategic Partnerships
- iv. High-level View of Offerings
- v. Juniper Research's View: Key Strengths & Strategic Development Opportunities
- i. Corporate
- 2.1.2. American Express
- i. Corporate
- Table 2.2: American Express' Financial Snapshot ($m), 2022-2024
- ii. Geographical Spread
- iii. Key Clients & Strategic Partnerships
- iv. High-level View of Offerings
- v. Juniper Research's View: Key Strengths & Strategic Development Opportunities
- i. Corporate
- 2.1.3. Banking Circle
- i. Corporate
- ii. Geographical Spread
- iii. Key Clients & Strategic Partnerships
- iv. High-level View of Offerings
- v. Juniper Research's View: Key Strengths & Strategic Development Opportunities
- 2.1.4. CGI
- i. Corporate
- Table 2.3: CGI's Financial Snapshot ($m), 2022-2024
- ii. Geographical Spread
- iii. Key Clients & Strategic Partnerships
- iv. High-level View of Offerings
- Figure 2.4: CGI's All Payments Solution
- v. Juniper Research's View: Key Strengths & Strategic Development Opportunities
- i. Corporate
- 2.1.5. Discover
- i. Corporate
- Table 2.5: Discover's Financial Snapshot ($m), 2022-2024
- ii. Geographical Spread
- iii. Key Clients & Strategic Partnerships
- iv. High-level View of Offerings
- v. Juniper Research's View: Key Strengths & Strategic Development Opportunities
- i. Corporate
- 2.1.6. ECS Fin
- i. Corporate
- ii. Geographical Spread
- iii. Key Clients & Strategic Partnerships
- iv. High-level View of Offerings
- v. Juniper Research's View: Key Strengths & Strategic Development Opportunities
- 2.1.7. Finastra
- i. Corporate
- ii. Geographical Spread
- iii. Key Clients & Strategic Partnerships
- iv. High-level View of Offerings
- v. Juniper Research's View: Key Strengths & Strategic Development Opportunities
- 2.1.8. FIS
- i. Corporate
- Figure 2.6: FIS' Financial Snapshot ($m), 2022-2024
- ii. Geographical Spread
- iii. Key Clients & Strategic Partnerships
- iv. High-level View of Offerings
- v. Juniper Research's View: Key Strengths & Strategic Development Opportunities
- i. Corporate
- 2.1.9. Fiserv
- i. Corporate
- Table 2.7: Fiserv's Financial Snapshot ($m), 2022-2024
- ii. Geographical Spread
- iii. Key Clients & Strategic Partnerships
- iv. High-level View of Offerings
- v. Juniper Research's View: Key Strengths & Strategic Development Opportunities
- i. Corporate
- 2.1.10. Flutterwave
- i. Corporate
- Table 2.8: Flutterwave's Rounds of Funding ($m), 2017-2022
- ii. Geographical Spread
- iii. Key Clients & Strategic Partnerships
- iv. High-level View of Offerings
- v. Juniper Research's View: Key Strengths & Strategic Development Opportunities
- i. Corporate
- 2.1.11. IBM
- i. Corporate
- Table 2.9: IBM's Financial Snapshot ($m), 2022-2024
- ii. Geographical Spread
- iii. Key Clients & Strategic Partnerships
- iv. High-level View of Offerings
- v. Juniper Research's View: Key Strengths & Strategic Development Opportunities
- i. Corporate
- 2.1.12. Mastercard
- i. Corporate
- Table 2.10: Mastercard's Financial Snapshot ($m), 2022-2024
- ii. Geographical Spread
- iii. Key Clients & Strategic Partnerships
- iv. High-level View of Offerings
- v. Juniper Research's View: Key Strengths & Strategic Development Opportunities
- i. Corporate
- 2.1.13. Montran Corporation
- i. Corporate
- ii. Geographical Spread
- iii. Key Clients & Strategic Partnerships
- iv. High-level View of Offerings
- v. Juniper Research's View: Key Strengths & Strategic Development Opportunities
- 2.1.14. Ripple
- i. Corporate
- Figure 2.11: Ripple's Funding Rounds ($m), 2015-2019
- ii. Geographical Spread
- iii. Key Clients & Strategic Partnerships
- iv. High-level View of Offerings
- Figure 2.12: How Ripple's Cross-border Payments Work
- v. Juniper Research's View: Key Strengths & Strategic Development Opportunities
- i. Corporate
- 2.1.15. Spendesk
- i. Corporate
- Table 2.13: Spendesk's Funding Rounds ($m), 2017-2022
- ii. Geographical Spread
- iii. Key Clients & Strategic Partnerships
- iv. High-level View of Offerings
- v. Juniper Research's View: Key Strengths & Strategic Development Opportunities
- i. Corporate
- 2.1.16. Stripe
- i. Corporate
- Table 2.14: Stripe's Funding Rounds ($m), 2019-2023
- ii. Geographical Spread
- iii. Key Clients & Strategic Partnerships
- iv. High-level View of Offerings
- v. Juniper Research's View: Key Strengths & Strategic Development Opportunities
- i. Corporate
- 2.1.17. SWIFT
- i. Corporate
- Table 2.15: SWIFT's Financial Snapshot ($m), 2021-2023
- ii. Geographical Spread
- iii. Key Clients & Strategic Partnerships
- iv. High-level View of Offerings
- v. Juniper Research's View: Key Strengths & Strategic Development Opportunities
- i. Corporate
- 2.1.18. Visa
- i. Corporate
- Table 2.16: Visa's Financial Snapshot ($m), 2022-2024
- ii. Geographical Spread
- iii. Key Clients & Strategic Partnerships
- iv. High-level View of Offerings
- Figure 2.17: How Visa B2B Connect Works
- v. Juniper Research's View: Key Strengths & Strategic Development Opportunities
- i. Corporate
- 2.1.19. Wise
- i. Corporate
- Figure 2.18: Wise's Financial Snapshot ($m), 2022-2024
- ii. Geographical Spread
- iii. Key Clients & Strategic Partnerships
- iv. High-level View of Offerings
- v. Juniper Research's View: Key Strengths & Strategic Development Opportunities
- i. Corporate
- 2.1.1. ACI Worldwide
- 2.2. Juniper Research Competitor Leaderboard Assessment Methodology
- 2.2.1. Limitations & Interpretations
- Table 2.19: Juniper Research's Competitor Leaderboard Scoring Criteria - B2B Payments
- 2.2.1. Limitations & Interpretations
3. Juniper Research Future Leaders Index
- Table 3.1: Juniper Research Future Leaders Index - B2B Payments Vendors & Product Portfolio
- Figure 3.2: Juniper Research Future Leaders Index - B2B Payments
- Table 3.3: Juniper Research Future Leaders Index Ranking - B2B Payments
- Table 3.4: Juniper Research Future Leaders Index - B2B Payments Heatmap
4. Future Leaders Index Vendor Profiles
- 4.1. Vendor Profiles
- 4.1.1. 3S Money
- i. Corporate
- ii. Geographical Spread
- iii. Key Clients & Strategic Partnerships
- iv. High-level View of Offerings
- v. Juniper Research's View: Key Strengths & Strategic Development Opportunities
- 4.1.2. AccessPay
- i. Corporate
- ii. Geographical Spread
- iii. Key Clients & Strategic Partnerships
- iv. High-level View of Offerings
- v. Juniper Research's View: Key Strengths & Strategic Development Opportunities
- 4.1.3. Airwallex
- i. Corporate
- Table 4.1: Airwallex's Rounds of Funding ($m), 2018-2025
- ii. Geographical Spread
- iii. Key Clients & Strategic Partnerships
- iv. High level View of Offerings
- v. Juniper Research's View: Key Strengths & Strategic Development Opportunities
- i. Corporate
- 4.1.4. Apron
- i. Corporate
- ii. Geographical Spread
- iii. Key Clients & Strategic Partnerships
- iv. High-level View of Offerings
- v. Juniper Research's View: Key Strengths & Strategic Development Opportunities
- 4.1.5. Aria
- i. Corporate
- ii. Geographical Spread
- iii. Key Clients & Strategic Partnerships
- iv. High-level View of Offerings
- v. Juniper Research's View: Key Strengths & Strategic Development Opportunities
- 4.1.6. Autobooks
- i. Corporate
- ii. Geographical Spread
- iii. Key Clients & Strategic Partnerships
- iv. High-level View of Offerings
- v. Juniper Research's View: Key Strengths & Strategic Development Opportunities
- 4.1.7. Balance
- i. Corporate
- ii. Geographical Spread
- iii. Key Clients & Strategic Partnerships
- iv. High-level View of Offerings
- v. Juniper Research's View: Key Strengths & Strategic Development Opportunities
- 4.1.8. Billie
- i. Corporate
- ii. Geographical Spread
- iii. Key Clients & Strategic Partnerships
- iv. High-level View of Offerings
- v. Juniper Research's View: Key Strengths & Strategic Development Opportunities
- 4.1.9. Brex
- i. Corporate
- Table 4.2: Brex's Funding Rounds ($m), 2018-2022
- ii. Geographical Spread
- iii. Key Clients & Strategic Partnerships
- iv. High-level View of Offerings
- v. Juniper Research's View: Key Strengths & Strategic Development Opportunities
- i. Corporate
- 4.1.10. Hokodo
- i. Corporate
- ii. Geographical Spread
- iii. Key Clients & Strategic Partnerships
- iv. High-level View of Offerings
- v. Juniper Research's View: Key Strengths & Strategic Development Opportunities
- 4.1.11. Jeeves
- i. Corporate
- ii. Geographical Spread
- iii. Key Clients & Strategic Partnerships
- iv. High-level View of Offerings
- v. Juniper Research's View: Key Strengths & Strategic Development Opportunities
- 4.1.12. Modulr
- i. Corporate
- ii. Geographical Spread
- iii. Key Clients & Strategic Partnerships
- iv. High-level View of Offerings
- v. Juniper Research's View: Key Strengths & Strategic Development Opportunities
- 4.1.13. Mondu
- i. Corporate
- ii. Geographical Spread
- iii. Key Clients & Strategic Partnerships
- iv. High-level View of Offerings
- v. Juniper Research's View: Key Strengths & Strategic Development Opportunities
- 4.1.14. Paytron
- i. Corporate
- ii. Geographical Spread
- iii. Key Clients & Strategic Partnerships
- iv. High-level View of Offerings
- v. Juniper Research's View: Key Strengths & Strategic Development Opportunities
- 4.1.15. Pliant
- i. Corporate
- Table 4.3: Pliant's Rounds of Funding ($m), 2021-2025
- ii. Geographical Spread
- iii. Key Clients & Strategic Partnerships
- High-level View of Offerings
- iv. Juniper Research's View: Key Strengths & Strategic Development Opportunities
- i. Corporate
- 4.1.16. Routable
- i. Corporate
- ii. Geographical Spread
- iii. Key Clients & Strategic Partnerships
- iv. High-level View of Offerings
- v. Juniper Research's View: Key Strengths & Strategic Development Opportunities
- 4.1.17. Sila
- i. Corporate
- ii. Geographical Spread
- iii. Key Clients & Strategic Partnerships
- iv. High-level View of Offerings
- v. Juniper Research's View: Key Strengths & Strategic Development Opportunities
- 4.1.18. Spenmo
- i. Corporate
- ii. Geographical Spread
- iii. Key Clients & Strategic Partnerships
- iv. High-level View of Offerings
- v. Juniper Research's View: Key Strengths & Strategic Development Opportunities
- 4.1.1. 3S Money
- 4.2. Juniper Research Future Leaders Index Assessment Methodology
- 4.3. Limitations & Interpretations
- Table 4.5: Juniper Research Future Leaders Index: B2B Payments Criteria
- 4.4. Related Research
Data & Forecasting
1. Market Landscape
- 1.1. Introduction
- 1.2. Definitions
- Figure 1.1: Juniper Research's 8 Key Regions - Definition
2. Forecast Overview
- 2.1. Total Volume
- Figure & Table 2.1: Total Volume of B2B Payments (m), Split by 8 Key Regions, 2025-2030
- 2.2. Total Value
- Figure & Table 2.2: Total Value of B2B Payments ($m), Split by 8 Key Regions, 2025-2030
- 2.3. Payment Channel
- Figure & Table 2.3: Total Value of B2B Payments ($m), Split by Payment Channel, 2025-2030
3. Domestic B2B Payments Forecast
- 3.1. Introduction
- 3.2. Methodology and Assumptions
- Figure 3.1: B2B Domestic Payments Market - Forecast Methodology
- 3.3. Domestic Forecasts
- 3.3.1. Number of Domestic B2B Transactions
- Figure & Table 3.2: Number of Domestic B2B Payments per annum (m), Split by 8 Key Regions, 2025-2030
- 3.3.2. Value of Domestic B2B Transactions
- Figure & Table 3.3: Total Value of B2B Domestic Payments ($m), Split by 8 Key Regions, 2025-2030
- 3.3.3. Card Payments
- Figure & Table 3.4: Total Value of Domestic B2B Payments via Card ($m), Split by 8 Key Regions, 2025-2030
- 3.3.4. Instant Payments
- Figure & Table 3.5: Total Value of Domestic B2B Payments via Instant Payments ($m), Split by 8 Key Regions, 2025-2030
- 3.3.5. Domestic Payment Channels
- Figure & Table 3.6: Total Value of Domestic B2B Payments ($m), Split by Payment Channel, 2025-2030
- 3.3.1. Number of Domestic B2B Transactions
4. Cross-border B2B Payments
- 4.1. Introduction
- 4.2. Methodology & Assumptions
- Figure 4.1: B2B Cross-border B2B Payments - Forecast Methodology
- 4.3. Cross-border Forecasts
- 4.3.1. Number of Transactions
- Figure & Table 4.2: Total Number of Outflow Cross-border B2B Payments per annum (m), Split by 8 Key Regions, 2025-2030
- 4.3.2. Value of Transactions
- Figure & Table 4.3: Total Value of Cross-border Outflow Payments ($m), Split by 8 Key Regions, 2025-2030
- 4.3.3. Wire Transfer
- Figure & Table 4.4: Total Value of Cross-border Payments via Wire Transfer ($m), Split by 8 Key Regions, 2024-2030
- 4.3.4. Cross-border Payments Channels
- Figure & Table 4.5: Total Value of Cross-border B2B Payments ($m), Split by Payments Channel, 2025-2030
- 4.3.1. Number of Transactions

