
PUBLISHER: Juniper Research Ltd | PRODUCT CODE: 1876168

PUBLISHER: Juniper Research Ltd | PRODUCT CODE: 1876168
eSIMs & iSIMs Market: 2025-2030
'eSIM Connections to Grow 300% Globally in Next 5 Years, as China Presents Instant Opportunities'
| KEY STATISTICS | |
|---|---|
| Devices leveraging eSIMs for connectivity in 2025: | 1.2bn |
| Devices leveraging eSIMs for connectivity in 2030: | 4.9bn |
| Growth in connected eSIM devices and sensors from 2025-2030: | Over 250% |
| Forecast period: | 2025-2030 |
Overview
Our "eSIMs and iSIMs" research suite provides an in-depth analysis and evaluation of how connectivity requirements are changing specifically within the consumer and IoT markets. The report assesses how the release of eSIM-only smartphones and the GSMA's SGP.32 specifications will provide enhanced flexibility and report profile provisioning capabilities to complement the growth of the cellular IoT market. Additionally, Juniper Research leverages its expertise to hypothesise the impact the anticipated SGP.41/42 releases on the iSIMs and IoT market.
The eSIMs market research reports provide incisive and detailed analysis for the study period, and a wide range of valuable insights featuring the key trends and major factors driving eSIM adoption, including the requirement for automation, the crucial role demand for remote service provisioning, in factory profile provisioning, the transition to cloud connectivity and how the increased deployment of 5G will impact the scope of eSIM and iSIM use cases. The eSIM and iSIM market growth research also features a comprehensive forecast suite, with data split by three key sectors: consumer, industrial and public. For each sector, eSIM market size forecasts are provided for:
- Total Device/Sensors Leveraging eSIMs for Connectivity
- Total Shipments of Device/Sensor eSIM Modules
- eSIM Hardware Revenue
- eSIM Management Platform Revenue
- eSIM Market Value
The report also provides a quantitative evaluation on the impact of iSIMs in the eSIMs market. Despite SGP.41/42 specifications yet to be launched, this report provides in-depth forecasts on how iSIM adoption is impacting the SIM market in 60 key countries over the next four years and leverages interviews with key SIM management platforms to quantify this growth.
The suite includes several different options that can be purchased separately, including access to data mapping the adoption and future growth of eSIMs and iSIMs. This insightful study uncovers the latest trends and opportunities within the market, and a document containing extensive analysis of the 18 market leaders in the SIM management space. The coverage can also be purchased as a Full Research Suite, containing all these elements, and includes a substantial discount.
All report content is delivered in the English language.
Key Features
- Market Dynamics: Insights into key trends and changing market dynamics within the eSIMs and iSIMS market expected from the shift to eSIM-only smartphones and new provisioning protocols. The research suite assesses how the leading vendors are positioning themselves to profit from the market's growth; detailing what they can further do to better align with the evolving market. The suite also includes a regional market growth rate analysis on the current development and future growth of the eSIMs and iSIMs market across 61 key countries.
- Key Takeaways & Strategic Recommendations: In-depth analysis of key opportunities and findings within the eSIMs and iSIMs market, accompanied by key strategic recommendations for MNOs, OEMs, and eSIM and iSIM management and platforms vendors.
- Benchmark Industry Forecasts: Five-year forecast databases are provided for devices and sensors leveraging eSIMs for connectivity, as well as for the market value of connected eSIM devices and sensors, split by consumer, industrial, and public sectors.
- Juniper Research Competitor Leaderboard: Key player capability and capacity assessment for 13 eSIM and iSIM management and platform vendors via the Juniper Research Competitor Leaderboard; scoring these vendors on criteria such as market performance, revenue, and future business prospects.
SAMPLE VIEW
Market Data & Forecasting Report
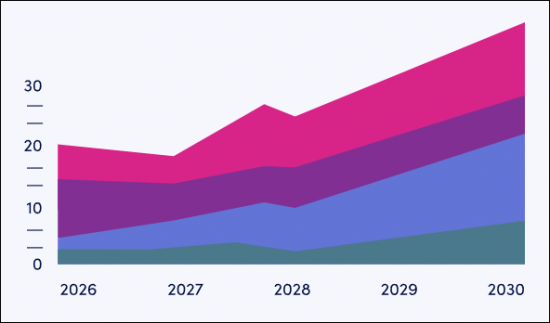
The numbers tell you what's happening, but our written report details why, alongside the methodologies.
SAMPLE VIEW
Market Trends & Strategies Report
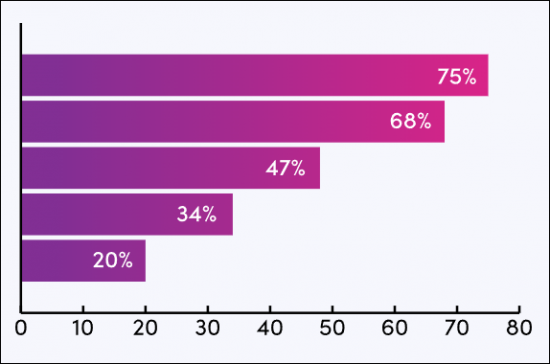
A comprehensive analysis of the current market landscape, alongside strategic recommendations.
Market Data & Forecasting Report
The market-leading research suite for the "eSIMs and iSIMs" Market includes access to a comprehensive five-year forecast dataset comprising 324 tables and over 290,000 datapoints.
Metrics in the research suite include:
- Total number of eSIMs installed in connected devices and sensors
- Total number of connected devices and sensors leveraging eSIMs for connectivity
- Proportion of connected eSIMs that are iSIMs
- Total market value of eSIM-connected devices and sensors
These metrics are provided for the following key sectors:
|
|
|
Juniper Research's Interactive Forecast Excel contains the following functionality:
- Statistics Analysis: Users benefit from the ability to search for specific metrics, displayed for all regions and countries across the data period. Graphs are easily modified and can be exported to the clipboard.
- Country Data Tool: This tool enables the user to look at metrics for all regions and countries in the forecast period. Users can refine the metrics displayed via a search bar.
- Country Comparison Tool: Users can select and compare specific countries. The ability to export graphs is included in this tool.
- What-if Analysis: Here, users can compare forecast metrics against their own assumptions, via 5 interactive scenarios.
Market Trends & Strategies Report
This report examines the "eSIMs and iSIMs" market landscape in thorough detail; assessing the trends and factors shaping the market. This must-have strategy report delivers a comprehensive analysis of the strategic opportunities for MNOs, OEMs, and eSIM management and platforms vendors; addressing key verticals and developing challenges, and how stakeholders must navigate these. It also includes evaluation of key country-level opportunities for growth in eSIMs and iSIMs.
Competitor Leaderboard Report
The Competitor Leaderboard report provides a detailed evaluation and market positioning for 13 leading eSIM and iSIM management and platform vendors. The vendors are positioned as an established leader, leading challenger, or disruptor and challenger, based on capacity and capability assessments.
The 13 vendors comprise:
|
|
|
This competitive analysis document is centred around the Juniper Research Competitor Leaderboard; a vendor positioning tool that provides an at-a-glance view of the competitive landscape in a market, backed by a robust methodology.
Table of Contents
Market Trends & Strategies
1. Key Takeaways & Strategic Recommendations
- 1.1. Key Takeaways
- 1.2. Strategic Recommendations
2. Market Landscape & Market Segment Analysis
- 2.1. Introduction & Definitions
- Figure 2.1: SGP.32 IoT Remote Provisioning Architecture
- i. iSIM
- ii. SoftSIM
- Figure 2.2: Key Differences Between Traditional SIMs, eSIMs, and iSIMs
- Figure 2.3: Evolution of Traditional SIMs to eSIMs and iSIMs (Not to Scale)
- Figure 2.4: Evolution of eSIMs in Consumer Devices
- 2.1.2. eSIMs Current Market Overview
- i. SGP.32
- ii. eSIM-only Smartphones
- Figure 2.5: Total Number of Smartphones Leveraging eSIMs for Connectivity (Split by 8 Key Regions, 2025-2030
- iii. China
- 2.1.3. iSIMs Current Market Overview
- Figure 2.6: Total Number of iSIMs Installed in Connected Devices and Sensors (m), Split by 8 Key Regions, 2025-2030
- 2.2. Future Market Outlook
- 2.2.1. Consumer Devices
- Figure 2.7: Proportion of Cellular Desktops & Notebooks That Have eSIMs (%), Split by 8 Key Regions, 2025-2030
- 2.2.2. SGP.42
- 2.2.3. Low-power Technology
- 2.2.4. Massive IoT
- Figure 2.8: Total Number of eSIMs Installed in Connected Industrial Devices Sensors (m), Split by 6 Key Sectors, 2025-2030
- 2.2.5. Security
- 2.2.1. Consumer Devices
- 2.3. eSIMs & iSIMs: Market Segment Analysis
- 2.3.1. Consumer
- Figure 2.9: Total Market Value of Connected Consumer Devices Leveraging eSIMs ($m), Split by Category, 2025-2030
- i. Smartphones
- ii. Consumer Vehicles
- Figure 2.10: Total Number of Connected Consumer Vehicles That Have eSIMs (m), Split by 8 Key Regions, 2025-2030
- iii. Consumer Wearables
- iv. Smart Meters
- 2.3.2. Industrial
- Figure 2.11: Total Market Value of Connected IoT Device & Sensor eSIMs ($m), Split by 8 Key Regions, 2025-2030
- 2.3.3. Public Sector
- Figure 2.12: Total Number of Connected Public Sector Sensors Leveraging eSIM Connectivity (m), Split by 8 Key Regions, 2025-2030
- i. Smart Parking Solutions
- ii. Smart Street Lighting Solutions
- iii. Smart Traffic Management Solutions
- 2.3.1. Consumer
3. Country Readiness Index
- 3.1. Introduction to Country Readiness Index
- Figure 3.1: eSIMs and iSIMs Country Readiness Index Regional Definitions
- Figure 3.2: Juniper Research Country Readiness Index Scoring Criteria: eSIMs and iSIMs
- Figure 3.3: Juniper Research Country Readiness Index: eSIMs and iSIMs
- Figure 3.4: Juniper Research eSIMs and iSIMs Country Readiness Index: Market Segments
- 3.1.1. Focus Markets
- i. Large Addressable User Base
- Figure 3.5: Number of Connected Devices & Sensors Leveraging eSIMs for Connectivity (m), Split by Top 8 Countries, 2025-2030
- ii. eSIM-only Smartphones to Establish US Market Dominance
- i. Large Addressable User Base
- 3.1.2. Growth Markets
- i. Large Addressable Consumer Base
- Figure 3.6: Total Number of Connected Consumer Devices (m), Split by 5 Countries in Growth Markets, 2025-2030
- ii. Strong Growth in Connected Devices & Sensors
- Figure 3.7: Total Number of Connected Devices & Sensors (m), Split by Growth Markets, 2025-2030
- i. Large Addressable Consumer Base
- 3.1.3. Saturated Markets
- Figure 3.8: Total Number of Smartphones With eSIMs Leveraging eSIMs for Connectivity (m), Split by Saturated Markets, 2025-2030
- Figure 3.9: Total eSIM Management Platform Revenue ($m), Split by Saturated Markets, 2025-2030
- 3.1.4. Developing Markets
- Figure 3.10: Total eSIM Management Platform Revenue ($m) Split by Developing Markets, 2025-2030
- Figure 3.11: Juniper Research Country Readiness Index Heatmap: North America
- Figure 3.12: Juniper Research Country Readiness Index Heatmap: Latin America
- Figure 3.13: Juniper Research Country Readiness Index Heatmap: West Europe
- Figure 3.14: Juniper Research Country Readiness Index Heatmap: Central & East Europe
- Figure 3.15: Juniper Research Country Readiness Index Heatmap: Far East & China
- Figure 3.16: Juniper Research Country Readiness Index Heatmap: Indian Subcontinent
- Figure 3.17: Juniper Research Country Readiness Index Heatmap: Rest of Asia Pacific
- Figure 3.18: Juniper Research Country Readiness Index Heatmap: Africa & Middle East
Competitor Leaderboard
1. Juniper Research Competitor Leaderboard
- 1.1. Why Read This Report
- Table 1.1: Juniper Research Competitor Leaderboard: eSIM & iSIM Management Platform Providers Included & Product Portfolio
- Figure 1.2: Juniper Research Competitor Leaderboard - eSIM/iSIM Platform Providers
- Table 1.3: Juniper Research Competitor Leaderboard: Vendors & Positioning
- Table 1.4: Juniper Research Competitor Leaderboard Heatmap - eSIM & iSIM Management Platform Providers
2. Company Profiles
- 2.1. eSIM & iSIM Platform Providers: Vendor Profiles
- 2.1.1. Ericsson
- i. Corporate
- Table 2.1: Ericsson Select Financial Information ($bn), 2021-2024
- ii. Geographical Spread
- iii. Key Clients & Strategic Partnerships
- iv. High-level View of Offerings
- v. Juniper Research's View: Key Strengths & Strategic Development Opportunities
- i. Corporate
- 2.1.2. Evolving Systems
- i. Corporate
- ii. Geographical Spread
- iii. Key Clients & Strategic Partnerships
- iv. High-level View of Offerings
- Figure 2.2: Evolving Systems' Product Portfolio
- Figure 2.3: DSA Core Technology Platform
- v. Juniper Research's View: Key Strengths & Strategic Development Opportunities
- 2.1.3. Giesecke+Devrient (G+D)
- i. Corporate
- Table 2.4: G+D Select Financial Information (Euro-m), 2021-2024
- ii. Geographical Spread
- iii. Key Clients & Strategic Partnerships
- iv. High-level View of Offerings
- v. Juniper Research's View: Key Strengths & Strategic Development Opportunities
- i. Corporate
- 2.1.4. iBASIS
- i. Corporate
- ii. Geographical Spread
- iii. Key Clients & Strategic Partnerships
- iv. High-level View of Offerings
- v. Juniper Research's View: Key Strengths & Strategic Development Opportunities
- 2.1.5. IDEMIA
- i. Corporate
- ii. Geographical Spread
- iii. Key Clients & Strategic Partnerships
- iv. High-level View of Offerings
- Figure 2.5: IDEMIA's Consumer eSIM Platform
- Figure 2.6: IDEMIA's eSIM IoT Platform
- v. Juniper Research's View: Key Strengths & Strategic Development Opportunities
- 2.1.6. Kigen
- i. Corporate
- ii. Geographical Spread
- iii. Key Clients & Strategic Partnerships
- iv. High-level View of Offerings
- v. Juniper Research's View: Key Strengths & Strategic Development Opportunities
- 2.1.7. Monty Mobile
- i. Corporate
- ii. Geographical Spread
- iii. Key Clients & Strategic Partnerships
- iv. High-level View of Offerings
- v. Juniper Research's View: Key Strengths & Strategic Development Opportunities
- 2.1.8. Motive
- i. Corporate
- ii. Geographical Spread
- iii. Key Clients & Strategic Partnerships
- iv. High-level View of Offerings
- v. Juniper Research's View: Key Strengths & Strategic Development Opportunities
- 2.1.9. Redtea Mobile
- i. Corporate
- ii. Geographical Spread
- iii. Key Clients & Strategic Partnerships
- iv. High-level View of Offerings
- Figure 2.7: Redtea Mobile's eSIM Solution for Network Operators
- v. Juniper Research's View: Key Strengths & Strategic Development Opportunities
- 2.1.10. Tata Communications
- Table 2.8: Tata Communications' FY 2024-25 & FY 2023-24 Revenue and Profit, Adjusted to USD
- ii. Geographical Spread
- iv. High-level View of Offerings
- v. Juniper Research's View: Key Strengths & Strategic Development Opportunities
- 2.1.11. Thales
- i. Corporate
- Table 2.9: Thales' Acquisitions, 2022-present
- ii. Geographical Spread
- iii. Key Clients & Strategic Partnerships
- iv. High-level View of Offerings
- Figure 2.10: Thales' Embedded Portfolio
- Figure 2.11: High-level Architecture of Thales Adaptive Connect
- Figure 2.12: High-level Architecture of Thales Instant Connect
- v. Juniper Research's View: Key Strengths & Strategic Development Opportunities
- i. Corporate
- 2.1.12. Valid
- i. Corporate
- ii. Geographical Spread
- iii. Key Clients & Strategic Partnerships
- iv. High-level View of Offerings
- v. Juniper Research's View: Key Strengths & Strategic Development Opportunities
- 2.1.13. Trasna
- i. Corporate
- ii. Geographical Spread
- iii. Key Clients & Strategic Partnerships
- iv. High-level View of Offerings
- v. Juniper Research's View: Key Strengths & Strategic Development Opportunities
- 2.1.1. Ericsson
- 2.2. Juniper Research Leaderboard Assessment Methodology
- 2.3. Limitation & Interpretations
- Table 2.8: Juniper Research Competitor Leaderboard eSIMS & iSIMs Market Scoring Criteria
- 2.4. Related Research
Data & Forecasting
1. eSIMs Market Forecast & Key Takeaways
- 1.1. eSIMs Market Summary & Future Outlook
- Figure 1.1: Total Number of Connected Devices & Sensors With eSIMs Leveraging eSIMs for Connectivity (m), Split by Category, 2025-2030
- 1.2. eSIM Market Forecast Methodology
- Table 1.2: eSIMs Market Forecast Methodology: Industry Splits
- Figure 1.3: Total eSIMs Market Forecast Methodology
- 1.3. Total Number of eSIM Connected Devices and Sensors Leveraging eSIM Connectivity
- Figure & Table 1.4: Number of Connected Devices & Sensors With eSIMs Leveraging eSIMs for Connectivity (m), Split by 8 Key Regions, 2025-2030
- Table 1.5: Number of Connected Devices & Sensors Leveraging eSIMs for Connectivity (m), Split by Category, 2025-2030
- 1.4. Total Market Value of Connected eSIM Devices and Sensors
- Figure & Table 1.6: Total Market Value of Connected eSIM Devices & Sensors ($m), Split by 8 Key Regions, 2025-2030.
- Table 1.7: Share of Market Value of Connected eSIM Devices & Sensor ($m), Split by Software and Hardware, 2025-2030
2. iSIMs Market Forecast & Key Takeaways
- 2.1. iSIMs Market Summary & Future Outlook
- Figure 2.1: Proportion of Connected eSIMs That Are iSIMs (%), Split by 8 Key Regions, 2025-2030
- 2.2. iSIMs Forecast Methodology
- Figure 2.2: Total iSIMs Market Forecast Methodology
- 2.3. Total Number of Devices and Sensors Leveraging iSIMs for Connectivity
- Figure & Table 2.3: Total Number of iSIMs Installed in Connected Devices & Sensors (m), Split by 8 Key Regions, 2025-2030
- Table 2.4: Share of Market Value of iSIM Connected Devices & Sensor ($m), Split by Software and Hardware, 2025-2030
3. Global eSIMs Consumer Market Forecasts
- 3.1. eSIMs Market - Consumer Sector
- 3.2. eSIMs Consumer Market Forecast Methodology & Assumptions
- Figure 3.1: Consumer Sector eSIMs Forecast Methodology
- 3.3. Total Number of Consumer Devices Leveraging eSIM Connectivity
- Figure Table 3.2: Total Number of Connected Consumer Devices With eSIMs Leveraging eSIMs for Connectivity (m), Split by 8 Key Regions, 2025-2030
- Table 3.3: Share of Platform Revenue From Connected Consumer Device eSIM Management ($) Split by Sector, 2025-2030
- 3.4. Total Revenue Generated from Consumer eSIM Devices
- Figure & Table 3.4: Total Market Value of Connected Consumer Device eSIMs ($m), Split by 8 Key Regions, 2025-2030
- Table 3.5: Total Market Value of Connected Consumer Device eSIMs ($m), Split by Software and Hardware, 2025-2030
4. Global eSIMs Industrial Market Forecasts
- 4.1. eSIMs Market - Industrial Sector
- 4.2. eSIMs Industrial Market Forecast Methodology
- Figure 4.1: Industrial Sector eSIMs Forecast Methodology
- 4.3. Total Number of Industrial Devices & Sensors Leveraging eSIMs for Connectivity
- Figure & Table 4.2: Total Number of Connected Industrial Devices & Sensors With eSIMs Leveraging eSIMs for Connectivity (m), Split by 8 Key Regions, 2025-2030
- Table 4.3: Total Number of Connected Industrial Devices & Sensors With eSIMs Leveraging eSIMs for Connectivity (m), Split by Sector, 2025-2030
- 4.4. Total Revenue Generated from Industrial eSIM Devices & Sensors
- Figure 4.4: Total Market Value of Connected IoT Device & Sensor eSIMs ($m), Split by 8 Key Regions, 2025-2030
5. Global eSIMs Public Sector Market Forecasts
- 5.1. eSIMs Market - Public Sector Market
- 5.2. eSIMs Public Sector Market Forecast Methodology
- Figure 5.1: Public Sector eSIMs Forecast Methodology
- 5.3. Total Number of eSIM Public Sector Devices & Sensors
- Figure & Table 5.2: Total Number of Connected Public Sector Sensors With eSIMs Leveraging eSIMs for Connectivity (m), Split by 8 Key Regions, 2025-2030
- Figure 5.3: Total Number of Connected Public Sector Sensors With eSIMs Leveraging eSIMs for Connectivity (m), Split by Sector, 2025-2030
- 5.4. Total Revenue Generated by Public Sector eSIM Connections
- Figure 5.4: Total Market Value of Connected Public Sector Sensor eSIMs ($m), Split by 8 Key Regions, 2025-2030
- Figure 5.5: Total Market Value of Connected Public Sector Device eSIMs ($m), Split by Software and Hardware, 2025-2030

