
PUBLISHER: Juniper Research Ltd | PRODUCT CODE: 1788492

PUBLISHER: Juniper Research Ltd | PRODUCT CODE: 1788492
Smart Buildings Market: 2025-2030
'Industrial Smart Buildings: Energy Wastage and Bespoke Vertical Solutions to Drive 525% Surge in Deployments by 2030'
| KEY STATISTICS | |
|---|---|
| Total smart building deployments by 2030: | 486.7m |
| Total smart building sensor deployments by 2030: | 14.7bn |
| Total smart building revenue by 2030: | $170.6bn |
| Forecast period: | 2025-2030 |
Overview
Our "Smart Buildings" research suite provides in-depth analysis and evaluation of how hardware and software service providers are reimagining smart building solutions as living ecosystems, using Internet of Things (IoT) and AI.
The suite includes a data deliverable; sizing the market and providing key forecast data across 61 countries and three market segments - Commercial, Industrial, and Residential. It also includes a Market Trends and Strategies document, which gives a complete assessment of the key trends, challenges, and recommendations for stakeholders. Collectively, they provide a critical tool for understanding this rapidly emerging market; allowing building automation vendors, IoT vendors, energy consumption management vendors, and smart building vendors to shape their future strategy.
All report content is delivered in the English language.
Key Features
- Key Takeaways & Strategic Recommendations: In-depth analysis of key development opportunities and findings within the smart buildings market; accompanied by key strategic recommendations for stakeholders.
- Market Dynamics: Insights into key trends and market expansion challenges within the market; addressing challenges posed by the highly technical nature of smart building systems, as well as ongoing consumer and building manager fears regarding security, privacy and the future impacts of industry 5.0. It analyses economical drivers (energy costs from energy consumption and carbon emission tracking, and net zero goals driving energy efficiency) as well as technological drivers (smart technology such as IoT technologies and digital transformation) within the market. Our Smart Buildings market research also includes a regional market growth analysis on the current development and segment growth of the smart building market in 61 countries; providing a future outlook.
- Benchmark Industry Forecasts: The business overview of smart building service providers includes forecasts for total revenue for smart building technologies, split by commercial, industrial, and residential sectors.
- Juniper Research Competitor Leaderboard: Key player capability and capacity assessment for 18 network operators, via the Juniper Research Competitor Leaderboard.
SAMPLE VIEW
Market Data & Forecasts PDF Report
The numbers tell you what's happening, but our written report details why, alongside the methodologies.
SAMPLE VIEW
Market Trends & Strategies Report
A comprehensive analysis of the current market landscape, alongside strategic recommendations.
Market Data & Forecasts
The market-leading research suite for the "Smart Buildings" market includes access to the full set of forecast data of 48 tables and over 33,000 datapoints. Metrics in the research suite include:
- Smart Building Deployments
- Smart Building Sensors Deployed
- Smart Building Sensor Hardware Revenue
- Smart Building Platform Revenue
- Smart Building Market Value
These metrics are provided for the following key market verticals:
- Commercial
- Industrial
- Residential
Juniper Research Interactive Forecast Excel contains the following functionality:
- Statistics Analysis: Users benefit from the ability to search for specific metrics; displayed for all regions and countries across the data period. Graphs are easily modified and can be exported to the clipboard.
- Country Data Tool: This tool allows users to look at metrics for all regions and countries in the forecast period. Users can refine the metrics displayed via a search bar.
- Country Comparison Tool: Users can select and compare countries. The ability to export graphs is included in this tool.
- What-if Analysis: Here, users can compare forecast metrics against their own assumptions, via five interactive scenarios.
Market Trends & Strategies Report
This report evaluates the global market for smart buildings. It considers the key technical differences between legacy and smart technology, and the challenges in bridging the gap between them going forwards. It also analyses different business models for deploying smart buildings and their pros and cons. Furthermore, it includes Juniper Research's ultimate Key Takeaways and Strategic Recommendations for the smart buildings market; summarising all its analysis.
Competitor Leaderboard Report
This market study includes a Competitor Leaderboard report, which provides detailed evaluation and market positioning of 18 smart buildings vendors. The vendors are positioned as established leaders, leading challengers, or disruptors and challengers, based on product and capability assessments.
Juniper Research's Competitor Leaderboard for Smart Buildings includes the following key players:
|
|
This report is centred around the Juniper Research Competitor Leaderboard; a vendor positioning tool that provides an at-a-glance view of the competitive landscape in a market, backed by a robust methodology.
Table of Contents
Market Trends & Strategies
1. Key Takeaways & Strategic Recommendations
- 1.1. Key Takeaways
- 1.2. Strategic Recommendations
2. Market Overview & Future Landscape
- 2.1.1. Market Overview
- Figure 2.1: Smart Building Technology
- 2.1.2. Traditional vs Smart
- i. Smart Building Sectors
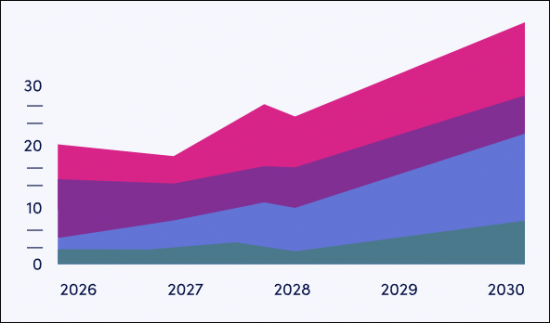
- Figure 2.2: Total Smart Building Deployments, Split by Segment (m), 2025-2030
- i. Smart Building Sectors
- 2.1.3. Market Drivers
- i. Technological Acceleration
- ii. Building Management Systems-as-a-Service (MBSaaS)
- iii. Government Regulation and Initiatives
- iv. Demand Trends for Smart Working Environments
- 2.1.4. Challenges
- i. Security and Cyber Security Threats
- ii. Privacy
- iii. High Cost of Technological and Infrastructural Implementation
- iv. Reliable Network Connection
- v. Complexity and Technological Integration
3. Market Trends & Business Model Analysis
- 3.1. Smart Buildings Market Trends
- Figure 3.1: Smart Buildings Market Revenue ($m) Split by 8 Key Regions, 2021-2030
- 3.1.1 5G
- i. High Data Throughput and Lower Latency
- ii. Reliability
- iii. Security
- Figure 3.1: Proportion of SIMs That Are 5G, Split by 8 Key Regions, 2025-2030
- iv. How 6G Will Impact Smart Buildings
- Figure 3.2: Average Number of Sensors per Residential Smart Building Deployment (m), Split by 8 Key Regions, 2025-2030
- 3.1.2. Industry 4.0 and 5.0
- 3.1.3. Security
- i. Physical Security
- ii. Cyber Security
- 3.1.4. Other Technical Areas
- 3.2. Business Model Analysis
- i. Buying
- ii. Leasing
- iii. Smart Financing
- iv. As-a-Service
- v. Summary
Competitor Leaderboard
1. Juniper Research Competitor Leaderboard
- 1.1. Why Read this Report
- Table 1.1: Juniper Research Competitor Leaderboard: Smart Buildings Market - Vendors Products & Portfolio
- Figure 1.2: Juniper Research Competitor Leaderboard: Smart Buildings Vendors
- Source: Juniper ResearchTable 1.3: Juniper Research Competitor Leaderboard: Smart Buildings Market -18 Vendors
- Table 1.4: Juniper Research Competitor Leaderboard Heatmap - Smart Buildings Vendors (1 of 2)
- Table 1.5: Juniper Research Competitor Leaderboard Heatmap - Smart Buildings Vendors (2 of 2)
- 1.2. Smart Buildings - Vendor Profiles
- 1.2.1. ABB
- i. Corporate
- Table 1.6: ABB's Financial Snapshot ($m), 2022-2025
- ii. Geographical Spread
- iii. Key Clients & Strategic Partnerships
- iv. High-level View of Offerings
- v. Juniper Research's View: Key Strengths & Strategic Opportunities
- i. Corporate
- 1.2.2. Avnet
- i. Corporate
- Table 1.7: Avnet's Financial Snapshot ($m), 2022-2024
- ii. Geographical Spread
- iii. Key Clients & Strategic Partnerships
- iv. High-level View of Offerings
- v. Juniper Research's View: Key Strengths & Strategic Development Opportunities
- i. Corporate
- 1.2.3. Bosch
- i. Corporate
- Table 1.8: Bosch's Financial Snapshot ($m), 2021-2024
- ii. Geographical Spread
- iii. Key Clients & Strategic Partnerships
- iv. High-level View of Offerings
- v. Juniper Research's View: Key Strengths & Strategic Development Opportunities
- i. Corporate
- 1.2.4. Carrier Global Corporation
- i. Corporate
- Table 1.9: Carrier's Financial Snapshot ($m), 2022-2024
- ii. Geographical Spread
- iii. Key Clients & Strategic Partnerships
- iv. High-level View of Offerings
- v. Juniper Research's View: Key Strengths & Strategic Development Opportunities
- i. Corporate
- 1.2.5. Cisco
- i. Corporate
- Table 1.10: Cisco's Financial Snapshot ($m), 2022-2024
- ii. Geographical Spread
- iii. Key Clients & Strategic Partnerships
- iv. High-level View of Offerings
- v. Juniper Research's View: Key Strengths & Strategic Development Opportunities
- i. Corporate
- 1.2.6. Delta Controls
- i. Corporate
- ii. Geographical Spread
- iii. Key Clients & Strategic Partnerships
- iv. High-level View of Offerings
- v. Juniper Research's View: Key Strengths & Strategic Development Opportunities
- 1.2.7. Hitachi
- i. Corporate
- Table 1.11: Hitachi's Financial Snapshot ($m), 2021-2024
- ii. Geographical Spread
- iii. Key Clients & Strategic Partnerships
- iv. High-level View of Offerings
- v. Juniper Research's View: Key Strengths & Strategic Development Opportunities
- i. Corporate
- 1.2.8. Honeywell
- i. Corporate
- Table 1.12: Honeywell's Financial Snapshot ($m), 2021-2024
- ii. Geographical Spread
- iii. Key Clients & Strategic Partnerships
- iv. High-level View of Offerings
- v. Juniper Research's View: Key Strengths & Strategic Development Opportunities
- i. Corporate
- 1.2.9. Huawei
- i. Corporate
- Table 1.13: Huawei's Financial Summary ($m), 2021-2024
- ii. Geographical Spread
- iii. Key Clients & Strategic Partnerships
- iv. High-level View of Offerings
- v. Juniper Research's View: Key Strengths & Strategic Development Opportunities
- i. Corporate
- 1.2.10. IBM
- i. Corporate
- Table 1.14: IBM's Financial Summary ($m), 2022-2024
- ii. Geographical Spread
- iii. Key Clients & Strategic Partnerships
- iv. High-level View of Offerings
- v. Juniper Research's View: Key Strengths & Strategic Development Opportunities
- i. Corporate
- 1.2.11. Intel
- i. Corporate
- Table 1.15: Intel's Financial Summary ($m), 2022-2024
- ii. Geographical Spread
- iii. Key Clients & Strategic Partnerships
- iv. High-level View of Offerings
- v. Juniper Research's View: Key Strengths & Strategic Development Opportunities
- i. Corporate
- 1.2.12. Johnson Controls
- i. Corporate
- Table 1.16: Johnson Controls' Financial Summary ($m), 2022-2024
- ii. Geographical Spread
- iii. Key Clients & Strategic Partnerships
- iv. High-level View of Offerings
- v. Juniper Research's View: Key Strengths & Strategic Development Opportunities
- i. Corporate
- 1.2.13. Legrand
- i. Corporate
- Table 1.17: Legrand's Financial Summary ($m) 2022-2024
- ii. Geographical Spread
- iii. Key Clients & Strategic Partnerships
- iv. High-level View of Offerings
- v. Juniper Research's View: Key Strengths & Strategic Development Opportunities
- i. Corporate
- 1.2.14. Schneider Electric
- i. Corporate
- Table 1.18: Schneider Electric's Financial Summary, 2022-2024
- ii. Geographical Spread
- iii. Key Clients & Strategic Partnerships
- iv. High-level View of Offerings
- v. Juniper Research's View: Key Strengths & Strategic Development Opportunities
- i. Corporate
- 1.2.15. Siemens
- i. Corporate
- Table 1.19: Siemens' Financial Summary 2022-2024
- ii. Geographical Spread
- iii. Key Clients & Strategic Partnerships
- iv. High-level View of Offerings
- v. Juniper Research's View: Key Strengths & Strategic Development Opportunities
- i. Corporate
- 1.2.16. Telit Cinterion
- i. Corporate
- ii. Geographical Spread
- iii. Key Clients & Strategic Partnerships
- iv. High-level View of Offerings
- v. Juniper Research's View: Key Strengths & Strategic Development Opportunities
- 1.2.17. Verdigris Technologies
- i. Corporate
- ii. Geographical Spread
- iii. Key Clients & Strategic Partnerships
- iv. High-level View of Offerings
- v. Juniper Research's View: Key Strengths & Strategic Development Opportunities
- 1.2.18. Boldyn Networks
- i. Corporate
- ii. Geographical Spread
- iii. Key Clients & Strategic Partnerships
- iv. High-level View of Offerings
- v. Juniper Research's View: Key Strengths & Strategic Development Opportunities
- 1.2.1. ABB
- 1.3. Juniper Research Leaderboard Assessment Methodology
- 1.4. Limitation & Interpretations
- Table 1.20: Juniper Research Competitor Leaderboard Scoring Criteria
- 1.5. Related Research
Data & Forecasting
1. Market Data & Forecasting
- 1.1. Smart Buildings Market Overview
- 1.1.1. Methodology
- Figure 1.1: Smart Buildings Forecast Methodology: Commercial Buildings
- Figure 1.2: Smart Buildings Forecast Methodology: Industrial Buildings
- Figure 1.3: Smart Buildings Forecast Methodology: Residential Buildings
- 1.1.1. Methodology
- 1.2. Smart Building Forecasts
- 1.2.1. Total Number of Smart Buildings
- Figure & Table 1.4: Number of Buildings Deploying Smart Building Technologies (m), Split by 8 Key Regions, 2025-2030
- Table 1.5: Number of Buildings Deploying Smart Features, Split by Segment, 2025-2030
- 1.2.2. Total Smart Buildings Revenue
- Figure & Table 1.6: Smart Buildings Revenue ($m), Split by 8 Key Regions, 2025-2030
- Table 1.7: Smart Buildings Revenue, Split by Segment, 2025-2030
- 1.2.3. Total Commercial Smart Buildings
- Figure & Table 1.8: Number of Commercial Buildings Deploying Smart Building Technologies (m), Split by 8 Key Regions, 2025-2030
- 1.2.4. Total Industrial Smart Buildings
- Figure & Table 1.9: Number of Industrial Buildings Deploying Smart Building Technologies (m), Split by 8 Key Regions, 2025-2030
- 1.2.5. Total Residential Smart Buildings
- Figure & Table 1.10: Number of Industrial Buildings Deploying Smart Building Technologies (m), Split by 8 Key Regions, 2025-2030
- 1.2.1. Total Number of Smart Buildings

