
PUBLISHER: Juniper Research Ltd | PRODUCT CODE: 1777932

PUBLISHER: Juniper Research Ltd | PRODUCT CODE: 1777932
Network APIs Market: 2025-2030
'Network API Revenue to Exceed $8 Billion by 2030 Globally, as KYC Identified as the Next Major Opportunity'
| KEY STATISTICS | |
|---|---|
| Total operator revenue from network APIs in 2025: | $283mn |
| Total operator revenue from network APIs in 2030: | $8.1bn |
| Total operator revenue from authentication and fraud prevention network APIs in 2030: | $4.9bn |
| Forecast period: | 2025-2030 |
Overview
Our "Network API" research suite provides operators, CPaaS providers, and other GSMA channel partners with extensive analysis and actionable insights into the rapidly growing network API market. It contains data that allows stakeholders in the market to make informed decisions on their product development and business strategies in the network API market. Since the launch of the GSMA Open Gateway and the CAMARA Project networks, APIs have become a key part of operators' future revenue strategies. The report assesses the present-day and future impact of current stable network APIs including Authentication and Fraud, Communication Quality, Communication Services, Computing Services, Device Information, Location Services, and Payments and Charging.
The report also analyses and provides strategy for non-stable network APIs, with recommendations being provided for network APIs in the areas of Know Your Customer (KYC), Population Density Data, and Network-as-a-Service (NaaS)-related APIs. This is in addition to assessing the different network APIs driving operator revenue both at present and in the future. The study includes case studies on Aduna's aggregation platform and the Bridge Alliance API Exchange (BAEx).
The report also features insights and analysis on how developers and enterprises are currently using network APIs, and which market verticals will be important to monetisation, including AI applications, banks and fintechs, cellular IoT, eCommerce, and gaming. It also looks at how operators need to update business systems, strategy alignment, and data protection and consent.
The report includes a Country Readiness Index; providing insight and analysis into which network API markets will experience the greatest growth over the next five years. This enables stakeholders to effectively understand the current and future status of more than 60 different network API markets.
The market forecast comprises of several different options that can be purchased separately, including access to data mapping and a forecast document, a strategy and trends document detailing critical trends in the market, and strategic recommendations for monetising and innovating services in the network API market.
The research suite includes a Competitor Leaderboard, which can be purchased separately; containing analysis and market sizing for 11 leading network API vendors, who are each working with operators to monetise network APIs.
Collectively, the suite provides a critical tool for understanding the network API market, allowing operators and other stakeholders to optimise their future business strategies and product or service development; providing them with a competitive advantage over their rivals.
All report content is delivered in the English language.
Key Features
- Key Takeaways & Strategic Recommendations: In-depth analysis of key development opportunities and findings within the network API market. This is accompanied by strategic recommendations for operators, and other stakeholders in the market seeking to increase their revenue from network APIs.
- Market Dynamics: Insights into key trends and opportunities in the network API market, including analysis of key APIs. It also includes a strategic analysis of the different business models that operators can leverage to monetise their network APIs.
- Benchmark Industry Forecast: The suite provides five-year forecasts for the global network API market, including for the total number of network API calls and total operator revenue from network APIs. It is further split by the categories of authentication and fraud prevention, location services, communication services, communication quality, device information, computing services, and payments and charging.
- Juniper Research Competitor Leaderboard: Key player capability and capacity assessment for 11 key vendors in the network API market, with market sizing and detailed analysis of each vendor's offering.
SAMPLE VIEW
Market Data & Forecasting Report
The numbers tell you what's happening, but our written report details why, alongside the methodologies.
SAMPLE VIEW
Market Trends & Strategies Report
A comprehensive analysis of the current market landscape, alongside strategic recommendations.
Market Data & Forecasting Report
The market-leading research for the "Network API" market includes access to the full set of forecast data; of 23,000 datapoints and over 50 tables.
Metrics in the research suite include:
- Total Number of Network API Calls
- Total Operator Revenue from Network APIs
- Average Operator Network API Revenue Per Mobile Subscriber
Splits are provided for each of these metrics for Authentication and Fraud, Communication Quality, Communication Services, Computing Services, Device Information, Location Services, and Payments and Charging.
Juniper Research's Interactive Forecast Excel contains the following functionality:
- Statistics Analysis: Users benefit from the ability to search for specific metrics; displayed for all regions and countries across the data period. Graphs are easily modified and can be exported to the clipboard.
- Country Data Tool: This tool enables users to look at metrics for all regions and countries in the forecast period. Users can refine the metrics displayed via a search bar.
- Country Comparison Tool: Users can select and compare specific countries. The ability to export graphs is included in this tool.
- What-if Analysis: Here, users can compare forecast metrics against their own assumptions, via three interactive scenarios.
Market Trends & Strategies Report
This report thoroughly examines the global Network API market; assessing market trends, challenges to monetisation, and the different business models available to operators. Alongside this analysis, the report provides comprehensive evaluation of the different stable APIs which will drive revenue in the future, and explores how operators can best convert the development of APIs into future revenue streams.
Competitor Leaderboard Report
The Competitor Leaderboard included in this report provides detailed evaluation and market positioning for 11 network API vendors. These companies are positioned as established leaders, leading challengers, or disruptors and challengers; based on a capacity, capability, and product assessment. This includes analysis of their key advantages in the market, future development plans, and key partnerships.
The network API Competitor Leaderboard includes the following key vendors:
|
|
|
Table of Contents
Market Trends & Strategies
1. Key Takeaways and Strategic Recommendations
- 1.1. Key Takeaways
- 1.2. Key Strategic Recommendations
2. Market Landscape
- 2.1. Introduction
- 2.1.1. The GSMA Open Gateway Initiative
- Figure 2.1: Examples of Operators Who Have Joined the GSMA Open Gateway
- 2.1.2. The CAMARA Project
- Figure 2.2: Select CAMARA Members
- 2.1.1. The GSMA Open Gateway Initiative
- 2.2. TM Forum and the GSMA Partnership
- 2.3. Current Market Status
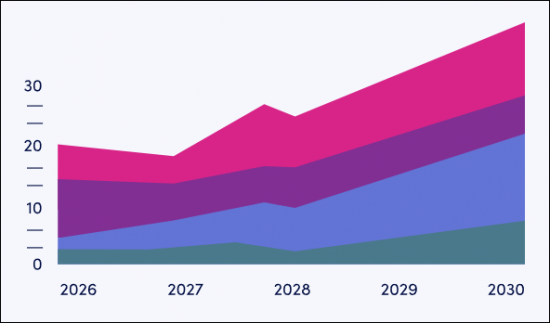
- Figure 2.3: Total Operator Revenue from Network APIs ($m), Split by 8 Key Regions, 2025-2030
- Table 2.4: Total Operator Revenue from Network APIs ($m), Split by API Category, 2025-2030
- 2.4. Key Distribution Channels for Network APIs
- 2.4.1. Operators
- i. Multi-operator Platforms
- 2.4.2. Hyperscalers
- 2.4.3. CPaaS Providers
- 2.4.4. System Integrators
- 2.4.5. Network Infrastructure Vendors
- 2.5. Understanding Developers
- 2.5.1. Which Applications Are Developers Building?
- i. Cellular IoT
- Figure 2.5: Total Number of Cellular IoT Connections in 2030 (%), Split by 8 Key Regions
- ii. Banks and Fintechs
- Table 2.6: Examples of Moves Away from A2P SMS (June 2025)
- iii. Gaming
- iv. eCommerce
- v. AI Applications
- i. Cellular IoT
- 2.5.2. Marketing and Education Strategies
- 2.5.1. Which Applications Are Developers Building?
- 2.6. Business Model and Monetisation Strategies
- i. When Is Charging a Premium Effective?
- 2.7. Cannibalisation Business Structure Changes
- 2.8. Business Systems
- 2.9. Operators Must Align Network API Strategies
- 2.10. Data Protections, Data Privacy, and Consent
- 2.11. Strategies Need to be Long-term, Not Short-term
- Figure 2.7: Total Operator Revenue from Network APIs ($m), Split by 8 Key Regions, 2025-2030
3. Future Opportunities and Market Strategies
- 3.1. CAMARA's Scope
- Figure 3.1: Types of CAMARA API
- 3.2. Meta-release Spring25
- Figure 3.2: Total Operator Revenue from Network APIs ($m), Split by 8 Key Regions, 2025-2030
- Figure 3.3: Meta-release Spring25
- 3.3. Stable APIs
- 3.3.1. Device Reachability Status
- 3.3.2. Device Roaming Status
- 3.3.3. Location Verification
- 3.3.4. Number Verification
- Figure 3.4: Without Number Verification
- 3.3.5. One-time Password SMS
- 3.3.6. Quality of Service Profiles
- 3.3.7. Quality on Demand
- Figure 3.5: Overview of Quality on Demand API
- 3.3.8. SIM Swap
- 3.3.9. Simple Edge Discovery
- 3.4. Future API Opportunities
- 3.4.1. KYC APIs
- Figure 3.6: Total Spend on KYC and KYB Systems per annum ($m), Split by 8 Key Regions, 2024-2029
- Figure 3.7: Total Spend on KYC/KYB Systems per annum ($m), Split by Select Key Industries, 2024-2029
- 3.4.2. Population Density Data
- 3.4.3. NaaS APIs
- 3.4.1. KYC APIs
4. Country Readiness Index
- 4.1. Introduction to the Country Readiness Index
- Figure 4.1: Juniper Research Country Readiness Index: Network API Market - Regional Definitions
- Table 4.2: Juniper Research Country Readiness Index: Network API Market - Scoring Criteria
- Figure 4.3: Juniper Research Country Readiness Index: Network API Market
- Table 4.4: Network API Market Country Readiness Index: Market Segments
- 4.2. Focus Markets
- 4.2.2. China
- Figure 4.5: Total Operator Revenue from Network APIs in China, 2024-2030
- Table 4.6: GSMA-certified Network APIs in China, in June 2025
- 4.2.3. The US
- Figure 4.7: Total Operator Revenue from Network APIs in the US ($m), Split by Network API Type, 2024-2030
- Figure 4.8: US Operator Network API Deployments
- 4.2.2. China
- 4.3. Growth Markets
- Figure 4.9: Network API High-growth Countries
- 4.3.1. Singapore
- Table 4.10: Total Number of Network APIs in Singapore
- Figure 4.11: Total Operator Revenue from Network APIs ($m) in Singapore, Split by Network API Category, 2024-2030
- 4.4. Developing Markets
- Figure 4.12: Total Operator Revenue from Select Developing Markets ($m), 2025-2030
- Table 4.13: Juniper Research Country Readiness Index Heatmap: North America
- Table 4.14: Juniper Research Country Readiness Index Heatmap: Latin America
- Table 4.15: Juniper Research Country Readiness Index Heatmap: West Europe
- Table 4.16: Juniper Research Country Readiness Index Heatmap: Central & East Europe
- Table 4.17: Juniper Research Country Readiness Index Heatmap: Far East & China
- Table 4.18: Juniper Research Country Readiness Index Heatmap: Indian Subcontinent
- Table 4.19: Juniper Research Country Readiness Index Heatmap: Rest of Asia Pacific
- Table 4.20: Juniper Research Country Readiness Index Heatmap: Africa & Middle East
Competitor Leaderboard
1. Competitor Leaderboard
- 1.1. Why Read This Report
- Table 1.1: Juniper Research Competitor Leaderboard: Network API Market - Vendors and Product Portfolios
- Figure 1.2: Juniper Research Competitor Leaderboard: Network API Market - 11 Vendors
- Table 1.3: Juniper Research Competitor Leaderboard: Network API Market - 11 Vendors & Positioning
- Table 1.4: Juniper Research Competitor Leaderboard Heatmap: Network API Market - 11 Vendors
2. Vendor Profiles
- 2.1. Vendor Profiles
- 2.1.1. BTS Group
- i. Corporate Information
- ii. Geographical Spread
- iii. Key Clients & Strategic Partnerships
- iv. High-level View of Offerings
- Figure 2.1: BTS' S1 Platform
- v. Juniper Research's View: Key Strengths & Strategic Development Opportunities
- 2.1.2. Comviva
- i. Corporate Information
- ii. Geographical Spread
- iii. Key Clients & Strategic Partnerships
- iv. High-level View of Offerings
- v. Juniper Research's View: Key Strengths & Strategic Development Opportunities
- 2.1.3. Glide Identity
- i. Corporate Information
- ii. Geographical Spread
- iii. Key Clients & Strategic Partnerships
- iv. High-level View of Offerings
- v. Juniper Research's View: Key Strengths & Strategic Development Opportunities
- 2.1.4. Infobip
- i. Corporate Information
- Table 2.2: Infobip's Acquisitions - April 2021 to Present
- ii. Geographical Spread
- iii. Key Clients & Strategic Partnerships
- iv. High-level View of Offerings
- v. Juniper Research's View: Key Strengths & Strategic Development Opportunities
- i. Corporate Information
- 2.1.5. Microsoft
- i. Corporate Information
- ii. Geographical Spread
- iii. Key Clients & Strategic Partnerships
- iv. High-level View of Offerings
- Figure 2.3: Azure Programmable Connectivity
- v. Juniper Research's View: Key Strengths & Strategic Development Opportunities
- 2.1.6. Nokia
- i. Corporate Information
- Table 2.4: Nokia's Select Financial Information (Euro), 2021-2024
- ii. Geographical Spread
- iii. Key Clients & Strategic Partnerships
- iv. High-level View of Offerings
- v. Juniper Research's View: Key Strengths & Strategic Development Opportunities
- i. Corporate Information
- 2.1.7. Sekura.id
- i. Corporate Information
- ii. Geographical Spread
- iii. Key Clients & Strategic Partnerships
- iv. High-level View of Offerings
- v. Juniper Research's View: Key Strengths & Strategic Development Opportunities
- 2.1.8. Sinch
- i. Corporate Information
- Table 2.5: Sinch's Most Recent Acquisitions, 2020-2021
- Table 2.6: Sinch's Select Financial Information (SEKm), 2022-2024
- ii. Geographical Spread
- iii. Key Clients & Strategic Partnerships
- iv. High-level View of Offerings
- Figure 2.7: Sinch's Offerings
- v. Juniper Research's View: Key Strengths & Strategic Development Opportunities
- i. Corporate Information
- 2.1.9. Symphonica
- i. Corporate Information
- ii. Geographical Spread
- iii. Key Clients & Strategic Partnerships
- iv. High-level View of Offerings
- Figure 2.8: Symphonica Platform
- v. Juniper Research's View: Key Strengths & Strategic Development Opportunities
- 2.1.10. Syniverse
- i. Corporate Information
- ii. Geographical Spread
- iii. Key Clients & Strategic Partnerships
- iv. High-level View of Offerings
- v. Juniper Research's View: Key Strengths & Strategic Development Opportunities
- 2.1.11. Vonage
- i. Corporate Information
- ii. Geographical Spread
- iii. Key Clients & Strategic Partnerships
- iv. High-level View of Offerings.
- v. Juniper Research's View: Key Strengths & Strategic Development Opportunities
- 2.1.1. BTS Group
- 2.2. Juniper Research Leaderboard Assessment Methodology
- 2.3. Limitations & Interpretations
- Table 2.9: Juniper Research Competitor Leaderboard: Network API Market
3. Data & Forecasting Table of Contents
- ii. Geographical Spread
- iii. Key Clients & Strategic Partnerships
- iv. High-level View of Offerings
- v. Juniper Research's View: Key Strengths & Strategic Development Opportunities
- 2.1.7. Sekura.id
- i. Corporate Information
- ii. Geographical Spread
- iii. Key Clients & Strategic Partnerships
- iv. High-level View of Offerings
- v. Juniper Research's View: Key Strengths & Strategic Development Opportunities
- 2.1.8. Sinch
- i. Corporate Information
- Table 2.5: Sinch's Most Recent Acquisitions, 2020-2021
- Table 2.6: Sinch's Select Financial Information (SEKm), 2022-2024
- ii. Geographical Spread
- iii. Key Clients & Strategic Partnerships
- iv. High-level View of Offerings
- Figure 2.7: Sinch's Offerings
- v. Juniper Research's View: Key Strengths & Strategic Development Opportunities
- i. Corporate Information
- 2.1.9. Symphonica
- i. Corporate Information
- ii. Geographical Spread
- iii. Key Clients & Strategic Partnerships
- iv. High-level View of Offerings
- Figure 2.8: Symphonica Platform
- v. Juniper Research's View: Key Strengths & Strategic Development Opportunities
- 2.1.10. Syniverse
- i. Corporate Information
- ii. Geographical Spread
- iii. Key Clients & Strategic Partnerships
- iv. High-level View of Offerings
- v. Juniper Research's View: Key Strengths & Strategic Development Opportunities
- 2.1.11. Vonage
- i. Corporate Information
- ii. Geographical Spread
- iii. Key Clients & Strategic Partnerships
- iv. High-level View of Offerings.
- v. Juniper Research's View: Key Strengths & Strategic Development Opportunities
- 2.1.7. Sekura.id
- 2.2. Juniper Research Leaderboard Assessment Methodology
- 2.3. Limitations & Interpretations
- Table 2.9: Juniper Research Competitor Leaderboard: Network API Market
Data & Forecasting
1. Introduction and Methodology
- 1.1. Introduction To Network APIs
- Figure 1.1: Total Operator Revenue from Network APIs ($m), Split by Network API Type, 2025-2030
- 1.2. Forecast Methodology
- Figure 1.2: Juniper Research Network API Market: Methodology Model
2. Market Summary and Future Market Outlook
- 2.1. Total Number of Network API Calls
- Figure & Table 2.1: Total Number of Network API Calls (m), Split by 8 Key Regions, 2025-2030
- 2.2. Total Operator Revenue from Network APIs
- Figure & Table 2.2: Total Operator Revenue from Network APIs ($m), Split By 8 Key Regions, 2025-2030
- 2.3. Total Number of Authentication and Fraud Prevention API Calls
- Figure & Table 2.3: Total Number of Authentication and Fraud Prevention API Calls (m), Split by 8 Key Regions, 2025-2030
- 2.4. Total Operator Revenue from Authentication and Fraud Prevention APIs
- Figure & Table 2.4: Total Operator Revenue ($m) from Authentication and Fraud APIs
- 2.5. Total Number of Location Services API Calls
- Figure & Table 2.5: Total Number of Location Services API Calls (m), Split by 8 Key Regions, 2025-2030
- 2.6. Total Operator Revenue from Location Services APIs
- Figure & Table 2.6: Total Operator Revenue from Location Services APIs ($m), Split by 8 Key Regions, 2025-2030
- 2.7. Total Number of Communication Services API Calls
- Figure & Table 2.7: Total Number of Location Services API Calls (m), Split by 8 Key Regions, 2025-2030
- 2.8. Total Operator Revenue from Communication Services APIs
- Figure & Table 2.8: Total Operator Revenue from Communication Services APIs ($m), Split by 8 Key Regions, 2025-2030
- 2.9. Total Number of Communication Quality API Calls
- Figure & Table 2.9: Total Number of Communication Quality API Calls (m), Split by 8 Key Regions, 2025-2030
- 2.10. Total Operator Revenue from Communication Quality APIs
- Figure & Table 2.10: Total Operator Revenue from Communication Quality APIs ($m), Split by 8 Key Regions, 2025-2030
- 2.11. Total Number of Device Information API Calls
- Figure & Table 2.11: Total Number of Device Information API Calls (m), Split by Key Regions, 2025-2030
- 2.12. Total Operator Revenue from Device Information APIs
- Figure & Table 2.12: Total Operator Revenue from Device Information APIs ($m), Split by 8 Key Regions, 2025-2030
- 2.13. Total Number of Computing Services API Calls
- Figure & Table 2.13: Total Number of Computing Services API Calls (m), Split by Key Regions, 2025-2030
- 2.14. Total Operator Revenue from Computing Services APIs
- Figure & Table 2.14: Total Operator Revenue from Computing Services APIs ($m), Split by 8 Key Regions, 2025-2030
- 2.15. Total Number of Payments and Charging API Calls
- Figure & Table 2.15: Total Number of Payments and Charging API Calls (m), Split by 8 Key Regions, 2025-2030
- 2.16. Total Operator Revenue from Payments and Charging API Calls
- Figure & Table 2.16: Total Operator Revenue from Payments and Charging APIs ($m), Split by 8 Key Regions, 2025-2030

