
PUBLISHER: KBV Research | PRODUCT CODE: 1126588
PUBLISHER: KBV Research | PRODUCT CODE: 1126588
Asia Pacific Biosimilars Market Size, Share & Industry Trends Analysis Report By Application (Oncology Diseases, Blood Disorders, Chronic & Autoimmune Diseases and Others), By Type, By Country and Growth Forecast, 2022 - 2028
The Asia Pacific Biosimilars Market would witness market growth of 25.4% CAGR during the forecast period (2022-2028).
Almost all healthcare system stakeholders may benefit from biosimilars. By providing a less expensive treatment option, they can cut costs while giving patients more options for care. In fact, patients can benefit from the competition sparked by the entry of biosimilars into the market by receiving high-quality biologic products at lower costs. In comparison to the reference products, the introduction of biosimilars presents opportunities for cost savings for payers, employers, state and federal governments, and patients.
Treatments for rare diseases frequently make use of expensive orphan drugs. Although biosimilars for these orphan medications are being developed, they still have many practical obstacles to overcome. For phase I and III trials, it is challenging to gather a sizable, non-heterogeneous population. Additionally, it can be disproportionately expensive to produce enough batches of the biosimilar to conduct batch-to-batch variability studies and compile extensive comparability data.
Due to the region's high population, rising hospital population, increasing cancer prevalence, and growing hospital number, significant growth in the region is anticipated. Due to the presence of numerous emerging players in the region, the Asia-Pacific biosimilar production would rise in the nations like India & China. The region's geriatric population is linked to a high burden on healthcare spending, and this market segment is demanding lower-cost alternatives like biosimilars, which can boost revenue.
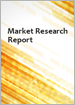
The China market dominated the Asia Pacific Biosimilars Market by Country in 2021, and would continue to be a dominant market till 2028; thereby, achieving a market value of $4,505.4 million by 2028. The Japan market is poised to grow at a CAGR of 24.6% during (2022 - 2028). Additionally, The India market would experience a CAGR of 26.1% during (2022 - 2028).
Based on Application, the market is segmented into Oncology Diseases, Blood Disorders, Chronic & Autoimmune Diseases and Others. Based on Type, the market is segmented into Monoclonal Antibodies, Granulocyte-Colony Stimulating Factor, Erythropoietin, Human Growth Hormone, Insulin and Others. Based on countries, the market is segmented into China, Japan, India, South Korea, Singapore, Malaysia, and Rest of Asia Pacific.
The market research report covers the analysis of key stake holders of the market. Key companies profiled in the report include Amgen, Inc., Biocon Limited, Dr. Reddy's Laboratories Ltd., Eli Lilly and Company, Intas Pharmaceutical Ltd, Novartis AG (Sandoz), Merck & Co., Inc., Pfizer, Inc., Teva Pharmaceuticals Industries Ltd. and Fresenius SE & Co. KGaA
Scope of the Study
Market Segments covered in the Report:
By Application
- Oncology Diseases
- Blood Disorders
- Chronic & Autoimmune Diseases
- Others
By Type
- Monoclonal Antibodies
- Granulocyte-Colony Stimulating Factor
- Erythropoietin
- Human Growth Hormone
- Insulin
- Others
By Country
- China
- Japan
- India
- South Korea
- Singapore
- Malaysia
- Rest of Asia Pacific
Companies Profiled
- Amgen, Inc.
- Biocon Limited
- Dr. Reddy's Laboratories Ltd.
- Eli Lilly and Company
- Intas Pharmaceutical Ltd
- Novartis AG (Sandoz)
- Merck & Co., Inc.
- Pfizer, Inc.
- Teva Pharmaceuticals Industries Ltd.
- Fresenius SE & Co. KGaA
Unique Offerings from KBV Research
- Exhaustive coverage
- Highest number of market tables and figures
- Subscription based model available
- Guaranteed best price
- Assured post sales research support with 10% customization free
Table of Contents
Chapter 1. Market Scope & Methodology
- 1.1 Market Definition
- 1.2 Objectives
- 1.3 Market Scope
- 1.4 Segmentation
- 1.4.1 Asia Pacific Biosimilars Market, by Application
- 1.4.2 Asia Pacific Biosimilars Market, by Type
- 1.4.3 Asia Pacific Biosimilars Market, by Country
- 1.5 Methodology for the research
Chapter 2. Market Overview
- 2.1 Introduction
- 2.1.1 Overview
- 2.1.1.1 Market Composition & Scenario
- 2.1.1 Overview
- 2.2 Key Factors Impacting the Market
- 2.2.1 Market Drivers
- 2.2.2 Market Restraints
Chapter 3. Competition Analysis - Global
- 3.1 KBV Cardinal Matrix
- 3.2 Recent Industry Wide Strategic Developments
- 3.2.1 Partnerships, Collaborations and Agreements
- 3.2.2 Product Launches and Product Expansions
- 3.2.3 Acquisition and Mergers
- 3.2.4 Approvals and Trials
- 3.3 Top Winning Strategies
- 3.3.1 Key Leading Strategies: Percentage Distribution (2018-2022)
- 3.3.2 Key Strategic Move: (Partnerships, Collaborations & Agreements : 2018, Jun - 2022, Aug) Leading Players
Chapter 4. Asia Pacific Biosimilars Market by Application
- 4.1 Asia Pacific Oncology Diseases Market by Country
- 4.2 Asia Pacific Blood Disorders Market by Country
- 4.3 Asia Pacific Chronic & Autoimmune Diseases Market by Country
- 4.4 Asia Pacific Others Market by Country
Chapter 5. Asia Pacific Biosimilars Market by Type
- 5.1 Asia Pacific Monoclonal Antibodies Market by Country
- 5.2 Asia Pacific Granulocyte-Colony Stimulating Factor Market by Country
- 5.3 Asia Pacific Erythropoietin Market by Country
- 5.4 Asia Pacific Human Growth Hormone Market by Country
- 5.5 Asia Pacific Insulin Market by Country
- 5.6 Asia Pacific Others Market by Country
Chapter 6. Asia Pacific Biosimilars Market by Country
- 6.1 China Biosimilars Market
- 6.1.1 China Biosimilars Market by Application
- 6.1.2 China Biosimilars Market by Type
- 6.2 Japan Biosimilars Market
- 6.2.1 Japan Biosimilars Market by Application
- 6.2.2 Japan Biosimilars Market by Type
- 6.3 India Biosimilars Market
- 6.3.1 India Biosimilars Market by Application
- 6.3.2 India Biosimilars Market by Type
- 6.4 South Korea Biosimilars Market
- 6.4.1 South Korea Biosimilars Market by Application
- 6.4.2 South Korea Biosimilars Market by Type
- 6.5 Singapore Biosimilars Market
- 6.5.1 Singapore Biosimilars Market by Application
- 6.5.2 Singapore Biosimilars Market by Type
- 6.6 Malaysia Biosimilars Market
- 6.6.1 Malaysia Biosimilars Market by Application
- 6.6.2 Malaysia Biosimilars Market by Type
- 6.7 Rest of Asia Pacific Biosimilars Market
- 6.7.1 Rest of Asia Pacific Biosimilars Market by Application
- 6.7.2 Rest of Asia Pacific Biosimilars Market by Type
Chapter 7. Company Profiles
- 7.1 Fresenius SE & Co. KGaA
- 7.1.1 Company Overview
- 7.1.2 Financial Analysis
- 7.1.3 Segmental and Regional Analysis
- 7.1.4 Research & Development Expenses
- 7.1.5 Recent strategies and developments:
- 7.1.5.1 Approvals and Trials:
- 7.1.5.2 Product Launches and Product Expansions:
- 7.1.5.3 Acquisition and Mergers:
- 7.2 Dr. Reddy's Laboratories Ltd.
- 7.2.1 Company Overview
- 7.2.2 Financial Analysis
- 7.2.3 Segmental and Regional Analysis
- 7.2.4 Research & Development Expense
- 7.2.5 Recent strategies and developments:
- 7.2.5.1 Partnerships, Collaborations, and Agreements:
- 7.2.5.2 Product Launches and Product Expansions:
- 7.3 Pfizer, Inc.
- 7.3.1 Company Overview
- 7.3.2 Financial Analysis
- 7.3.3 Regional & Segmental Analysis
- 7.3.4 Research & Development Expense
- 7.3.5 Recent strategies and developments:
- 7.3.5.1 Approvals and Trials:
- 7.3.5.2 Product Launches and Product Expansions:
- 7.3.5.3 Acquisition and Mergers:
- 7.4 Amgen, Inc.
- 7.4.1 Company Overview
- 7.4.2 Financial Analysis
- 7.4.3 Regional Analysis
- 7.4.4 Research & Development Expenses
- 7.4.5 Recent strategies and developments:
- 7.4.5.1 Approvals and Trials:
- 7.4.5.2 Product Launches and Product Expansions:
- 7.4.5.3 Acquisition and Mergers:
- 7.5 Teva Pharmaceutical Industries Ltd.
- 7.5.1 Company Overview
- 7.5.2 Financial Analysis
- 7.5.3 Regional Analysis
- 7.5.4 Research & Development Expenses
- 7.5.5 Recent strategies and developments:
- 7.5.5.1 Partnerships, Collaborations, and Agreements:
- 7.5.5.2 Approvals and Trials:
- 7.5.5.3 Product Launches and Product Expansions:
- 7.6 Eli Lilly And Company
- 7.6.1 Company Overview
- 7.6.2 Financial Analysis
- 7.6.3 Regional Analysis
- 7.6.4 Research & Development Expenses
- 7.6.5 Recent strategies and developments:
- 7.6.5.1 Partnerships, Collaborations, and Agreements:
- 7.7 Merck & Co., Inc.
- 7.7.1 Company Overview
- 7.7.2 Financial Analysis
- 7.7.3 Segmental and Regional Analysis
- 7.7.4 Research & Development Expenses
- 7.7.5 Recent strategies and developments:
- 7.7.5.1 Product Launches and Product Expansions:
- 7.8 Novartis AG (Sandoz)
- 7.8.1 Company Overview
- 7.8.2 Financial Analysis
- 7.8.3 Segmental and Regional Analysis
- 7.8.4 Research & Development Expense
- 7.8.5 Recent strategies and developments:
- 7.8.5.1 Partnerships, Collaborations, and Agreements:
- 7.8.5.2 Approvals and Trials:
- 7.9 Biocon Limited
- 7.9.1 Company Overview
- 7.9.2 Recent strategies and developments:
- 7.9.2.1 Partnerships, Collaborations, and Agreements:
- 7.9.2.2 Product Launches and Product Expansions:
- 7.9.2.3 Acquisition and Mergers:
- 7.10. Intas Pharmaceutical Ltd.
- 7.10.1 Company Overview
- 7.10.2 Recent strategies and developments:
- 7.10.2.1 Partnerships, Collaborations, and Agreements:
- 7.10.2.2 Product Launches and Product Expansions:
LIST OF TABLES
- TABLE 1 Asia Pacific Biosimilars Market, 2018 - 2021, USD Million
- TABLE 2 Asia Pacific Biosimilars Market, 2022 - 2028, USD Million
- TABLE 3 Partnerships, Collaborations and Agreements- Biosimilars Market
- TABLE 4 Product Launches And Product Expansions- Biosimilars Market
- TABLE 5 Acquisition and Mergers- Biosimilars Market
- TABLE 6 Approvals and Trials - Biosimilars Market
- TABLE 7 Asia Pacific Biosimilars Market by Application, 2018 - 2021, USD Million
- TABLE 8 Asia Pacific Biosimilars Market by Application, 2022 - 2028, USD Million
- TABLE 9 Asia Pacific Oncology Diseases Market by Country, 2018 - 2021, USD Million
- TABLE 10 Asia Pacific Oncology Diseases Market by Country, 2022 - 2028, USD Million
- TABLE 11 Asia Pacific Blood Disorders Market by Country, 2018 - 2021, USD Million
- TABLE 12 Asia Pacific Blood Disorders Market by Country, 2022 - 2028, USD Million
- TABLE 13 Asia Pacific Chronic & Autoimmune Diseases Market by Country, 2018 - 2021, USD Million
- TABLE 14 Asia Pacific Chronic & Autoimmune Diseases Market by Country, 2022 - 2028, USD Million
- TABLE 15 Asia Pacific Others Market by Country, 2018 - 2021, USD Million
- TABLE 16 Asia Pacific Others Market by Country, 2022 - 2028, USD Million
- TABLE 17 Asia Pacific Biosimilars Market by Type, 2018 - 2021, USD Million
- TABLE 18 Asia Pacific Biosimilars Market by Type, 2022 - 2028, USD Million
- TABLE 19 Asia Pacific Monoclonal Antibodies Market by Country, 2018 - 2021, USD Million
- TABLE 20 Asia Pacific Monoclonal Antibodies Market by Country, 2022 - 2028, USD Million
- TABLE 21 Asia Pacific Granulocyte-Colony Stimulating Factor Market by Country, 2018 - 2021, USD Million
- TABLE 22 Asia Pacific Granulocyte-Colony Stimulating Factor Market by Country, 2022 - 2028, USD Million
- TABLE 23 Asia Pacific Erythropoietin Market by Country, 2018 - 2021, USD Million
- TABLE 24 Asia Pacific Erythropoietin Market by Country, 2022 - 2028, USD Million
- TABLE 25 Asia Pacific Human Growth Hormone Market by Country, 2018 - 2021, USD Million
- TABLE 26 Asia Pacific Human Growth Hormone Market by Country, 2022 - 2028, USD Million
- TABLE 27 Asia Pacific Insulin Market by Country, 2018 - 2021, USD Million
- TABLE 28 Asia Pacific Insulin Market by Country, 2022 - 2028, USD Million
- TABLE 29 Asia Pacific Others Market by Country, 2018 - 2021, USD Million
- TABLE 30 Asia Pacific Others Market by Country, 2022 - 2028, USD Million
- TABLE 31 Asia Pacific Biosimilars Market by Country, 2018 - 2021, USD Million
- TABLE 32 Asia Pacific Biosimilars Market by Country, 2022 - 2028, USD Million
- TABLE 33 China Biosimilars Market, 2018 - 2021, USD Million
- TABLE 34 China Biosimilars Market, 2022 - 2028, USD Million
- TABLE 35 China Biosimilars Market by Application, 2018 - 2021, USD Million
- TABLE 36 China Biosimilars Market by Application, 2022 - 2028, USD Million
- TABLE 37 China Biosimilars Market by Type, 2018 - 2021, USD Million
- TABLE 38 China Biosimilars Market by Type, 2022 - 2028, USD Million
- TABLE 39 Japan Biosimilars Market, 2018 - 2021, USD Million
- TABLE 40 Japan Biosimilars Market, 2022 - 2028, USD Million
- TABLE 41 Japan Biosimilars Market by Application, 2018 - 2021, USD Million
- TABLE 42 Japan Biosimilars Market by Application, 2022 - 2028, USD Million
- TABLE 43 Japan Biosimilars Market by Type, 2018 - 2021, USD Million
- TABLE 44 Japan Biosimilars Market by Type, 2022 - 2028, USD Million
- TABLE 45 India Biosimilars Market, 2018 - 2021, USD Million
- TABLE 46 India Biosimilars Market, 2022 - 2028, USD Million
- TABLE 47 India Biosimilars Market by Application, 2018 - 2021, USD Million
- TABLE 48 India Biosimilars Market by Application, 2022 - 2028, USD Million
- TABLE 49 India Biosimilars Market by Type, 2018 - 2021, USD Million
- TABLE 50 India Biosimilars Market by Type, 2022 - 2028, USD Million
- TABLE 51 South Korea Biosimilars Market, 2018 - 2021, USD Million
- TABLE 52 South Korea Biosimilars Market, 2022 - 2028, USD Million
- TABLE 53 South Korea Biosimilars Market by Application, 2018 - 2021, USD Million
- TABLE 54 South Korea Biosimilars Market by Application, 2022 - 2028, USD Million
- TABLE 55 South Korea Biosimilars Market by Type, 2018 - 2021, USD Million
- TABLE 56 South Korea Biosimilars Market by Type, 2022 - 2028, USD Million
- TABLE 57 Singapore Biosimilars Market, 2018 - 2021, USD Million
- TABLE 58 Singapore Biosimilars Market, 2022 - 2028, USD Million
- TABLE 59 Singapore Biosimilars Market by Application, 2018 - 2021, USD Million
- TABLE 60 Singapore Biosimilars Market by Application, 2022 - 2028, USD Million
- TABLE 61 Singapore Biosimilars Market by Type, 2018 - 2021, USD Million
- TABLE 62 Singapore Biosimilars Market by Type, 2022 - 2028, USD Million
- TABLE 63 Malaysia Biosimilars Market, 2018 - 2021, USD Million
- TABLE 64 Malaysia Biosimilars Market, 2022 - 2028, USD Million
- TABLE 65 Malaysia Biosimilars Market by Application, 2018 - 2021, USD Million
- TABLE 66 Malaysia Biosimilars Market by Application, 2022 - 2028, USD Million
- TABLE 67 Malaysia Biosimilars Market by Type, 2018 - 2021, USD Million
- TABLE 68 Malaysia Biosimilars Market by Type, 2022 - 2028, USD Million
- TABLE 69 Rest of Asia Pacific Biosimilars Market, 2018 - 2021, USD Million
- TABLE 70 Rest of Asia Pacific Biosimilars Market, 2022 - 2028, USD Million
- TABLE 71 Rest of Asia Pacific Biosimilars Market by Application, 2018 - 2021, USD Million
- TABLE 72 Rest of Asia Pacific Biosimilars Market by Application, 2022 - 2028, USD Million
- TABLE 73 Rest of Asia Pacific Biosimilars Market by Type, 2018 - 2021, USD Million
- TABLE 74 Rest of Asia Pacific Biosimilars Market by Type, 2022 - 2028, USD Million
- TABLE 75 key information - Fresenius SE & Co. KGaA
- TABLE 76 key information - Dr. Reddy's Laboratories Ltd.
- TABLE 77 Key Information - Pfizer, Inc.
- TABLE 78 Key Information - Amgen, Inc.
- TABLE 79 Key Information - Teva Pharmaceuticals Industries Ltd.
- TABLE 80 Key Information - Eli Lilly And Company
- TABLE 81 KEY INFORMATION - MERCK & CO., INC.
- TABLE 82 Key Information - Novartis AG
- TABLE 83 Key Information - Biocon Limited
- TABLE 84 Key Information - Intas Pharmaceutical Ltd.
List of Figures
- FIG 1 Methodology for the research
- FIG 2 KBV Cardinal Matrix
- FIG 3 Key Leading Strategies: Percentage Distribution (2018-2022)
- FIG 4 Key Strategic Move: (Partnerships, Collaborations & Agreements : 2018, Jan - 2022, Aug) Leading Players
- FIG 5 Recent strategies and developments: Fresenius SE & Co. KGaA
- FIG 6 Recent strategies and developments: Dr. Reddy's Laboratories Ltd.
- FIG 7 Recent strategies and developments: Pfizer, Inc.
- FIG 8 Recent strategies and developments: Amgen, Inc.
- FIG 9 Recent strategies and developments: Teva Pharmaceuticals Industries Ltd.
- FIG 10 Recent strategies and developments: Novartis AG
- FIG 11 Recent strategies and developments: Biocon Limited
- FIG 12 Recent strategies and developments: Intas Pharmaceutical Ltd.

