
PUBLISHER: KBV Research | PRODUCT CODE: 1126762
PUBLISHER: KBV Research | PRODUCT CODE: 1126762
North America Industrial Burner Market Size, Share & Industry Trends Analysis Report By Operating Temperature, By Vertical, By Burner Type, By Fuel Type (Oil, Dual Fuel, Gas, and Solid Fuel), By Power Rating, By Country and Growth Forecast, 2022 - 2028
The North America Industrial Burner Market would witness market growth of 5.3% CAGR during the forecast period (2022-2028).
Metal-fiber technology, which was developed in the past ten years and is now widely used by larger industrial-burner makers, is used in Surface-Stabilized Combustion. The more common diffusion-based flame is not produced by this procedure since it does not use a traditional diffuser to stabilize the flame. Instead, the fuel and air are already mixed, and a metal-fiber substance stabilizes the flame. With this technique, the burner may reduce thermal NOx generation, expand the flame, get rid of hot-flame zones, and achieve single-digit NOx levels.
Operators and engineers may stay in control of their equipment even when they are not physically there due to remote monitoring. From its early days of communication via pagers, beepers, and fax machines to today's use of many online linked gadgets, this technology has evolved over the years. The Industrial Burner Industry would be able to manage their complete facility and keep an eye on every operation using apps on their desktop, laptop, or mobile devices.
The industrial and commercial sectors in the United States use a lot of energy. Boilers consume a large portion of this energy to produce steam and hot water. With an actual fuel input capacity of 2.7 million MMBtu/hr, the EEA estimates that there are nearly 163,000 commercial and industrial boilers in the United States. These boilers use around 8,100 TBtu of energy annually, which is about 40% of the total energy used in these industries. According to the number of units, collective capacity, unit capabilities, primary fuel, application, and regional distribution. The high utilization of the industrial burners for the boilers propels the growth of the market in this region.
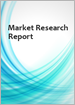
The US market dominated the North America Industrial Burner Market by Country in 2021, and would continue to be a dominant market till 2028; thereby, achieving a market value of $1,707.3 million by 2028. The Canada market would experience a CAGR of 7.6% during (2022 - 2028). Additionally, The Mexico market is exhibiting a CAGR of 6.7% during (2022 - 2028).
Based on Operating Temperature, the market is segmented into High Temperature (> 1,400°F) and Low Temperature (< 1,400°F). Based on Vertical, the market is segmented into Chemicals, Petrochemicals, Automotive, Power Generation, Metals & Mining, Food & Beverages, and Others. Based on Burner Type, the market is segmented into Radiant Burner, Direct-fired Burner, Regenerative Burner, High Thermal Release Burner, and Self-recuperative Burner & Others. Based on Fuel Type, the market is segmented into Oil, Dual Fuel, Gas, and Solid Fuel. Based on Power Rating, the market is segmented into Monoblock and Duoblock. Based on countries, the market is segmented into U.S., Mexico, Canada, and Rest of North America.
The market research report covers the analysis of key stake holders of the market. Key companies profiled in the report include Andritz AG, NIBE Industrier AB, Corp., Honeywell International, Inc., Ariston Holding N.V., Max Weishaupt GmbH, Selas Heat Technology Company, LLC. Riello S.P.A. (Raytheon Technologies Corporation), Fives Group (Novafives S.A.S.), Oilon Group Oy and Ebico Trading Ltd.
Scope of the Study
Market Segments covered in the Report:
By Operating Temperature
- High Temperature (> 1,400°F)
- Low Temperature (< 1,400°F)
By Vertical
- Chemicals
- Petrochemicals
- Automotive
- Power Generation
- Metals & Mining
- Food & Beverages
- Others
By Burner Type
- Radiant Burner
- Direct-fired Burner
- Regenerative Burner
- High Thermal Release Burner
- Self-recuperative Burner & Others
By Fuel Type
- Oil
- Dual Fuel
- Gas
- Solid Fuel
By Power Rating
- Monoblock
- Duoblock
By Country
- US
- Canada
- Mexico
- Rest of North America
Companies Profiled
- Andritz AG
- NIBE Industrier AB, Corp.
- Honeywell International, Inc.
- Ariston Holding N.V.
- Max Weishaupt GmbH
- Selas Heat Technology Company, LLC
- Riello S.P.A. (Raytheon Technologies Corporation)
- Fives Group (Novafives S.A.S.)
- Oilon Group Oy
- Ebico Trading Ltd.
Unique Offerings from KBV Research
- Exhaustive coverage
- Highest number of market tables and figures
- Subscription based model available
- Guaranteed best price
- Assured post sales research support with 10% customization free
Table of Contents
Chapter 1. Market Scope & Methodology
- 1.1 Market Definition
- 1.2 Objectives
- 1.3 Market Scope
- 1.4 Segmentation
- 1.4.1 North America Industrial Burner Market, by Operating Temperature
- 1.4.2 North America Industrial Burner Market, by Vertical
- 1.4.3 North America Industrial Burner Market, by Burner Type
- 1.4.4 North America Industrial Burner Market, by Fuel Type
- 1.4.5 North America Industrial Burner Market, by Power Rating
- 1.4.6 North America Industrial Burner Market, by Country
- 1.5 Methodology for the research
Chapter 2. Market Overview
- 2.1 Introduction
- 2.1.1 Overview
- 2.1.1.1 Market composition & scenarios
- 2.1.1 Overview
- 2.2 Key Factors Impacting the Market
- 2.2.1 Market Drivers
- 2.2.2 Market Restraints
Chapter 3. North America Industrial Burner Market by Operating Temperature
- 3.1 North America High Temperature (> 1,400°F) Market by Country
- 3.2 North America Low Temperature (< 1,400°F) Market by Country
Chapter 4. North America Industrial Burner Market by Vertical
- 4.1 North America Chemicals Market by Country
- 4.2 North America Petrochemicals Market by Country
- 4.3 North America Automotive Market by Country
- 4.4 North America Power Generation Market by Country
- 4.5 North America Metals & Mining Market by Country
- 4.6 North America Food & Beverages Market by Country
- 4.7 North America Others Market by Country
Chapter 5. North America Industrial Burner Market by Burner Type
- 5.1 North America Radiant Burner Market by Country
- 5.2 North America Direct-fired Burner Market by Country
- 5.3 North America Regenerative Burner Market by Country
- 5.4 North America High Thermal Release Burner Market by Country
- 5.5 North America Self-recuperative Burner & Others Market by Country
Chapter 6. North America Industrial Burner Market by Fuel Type
- 6.1 North America Oil Market by Country
- 6.2 North America Dual Fuel Market by Country
- 6.3 North America Gas Market by Country
- 6.4 North America Solid Fuel Market by Country
Chapter 7. North America Industrial Burner Market by Power Rating
- 7.1 North America Monoblock Market by Country
- 7.2 North America Duoblock Market by Country
Chapter 8. North America Industrial Burner Market by Country
- 8.1 US Industrial Burner Market
- 8.1.1 US Industrial Burner Market by Operating Temperature
- 8.1.2 US Industrial Burner Market by Vertical
- 8.1.3 US Industrial Burner Market by Burner Type
- 8.1.4 US Industrial Burner Market by Fuel Type
- 8.1.5 US Industrial Burner Market by Power Rating
- 8.2 Canada Industrial Burner Market
- 8.2.1 Canada Industrial Burner Market by Operating Temperature
- 8.2.2 Canada Industrial Burner Market by Vertical
- 8.2.3 Canada Industrial Burner Market by Burner Type
- 8.2.4 Canada Industrial Burner Market by Fuel Type
- 8.2.5 Canada Industrial Burner Market by Power Rating
- 8.3 Mexico Industrial Burner Market
- 8.3.1 Mexico Industrial Burner Market by Operating Temperature
- 8.3.2 Mexico Industrial Burner Market by Vertical
- 8.3.3 Mexico Industrial Burner Market by Burner Type
- 8.3.4 Mexico Industrial Burner Market by Fuel Type
- 8.3.5 Mexico Industrial Burner Market by Power Rating
- 8.4 Rest of North America Industrial Burner Market
- 8.4.1 Rest of North America Industrial Burner Market by Operating Temperature
- 8.4.2 Rest of North America Industrial Burner Market by Vertical
- 8.4.3 Rest of North America Industrial Burner Market by Burner Type
- 8.4.4 Rest of North America Industrial Burner Market by Fuel Type
- 8.4.5 Rest of North America Industrial Burner Market by Power Rating
Chapter 9. Company Profiles
- 9.1 Andritz AG
- 9.1.1 Company Overview
- 9.1.2 Financial Analysis
- 9.1.3 Segmental and Regional Analysis
- 9.1.4 Research & Development Expenses
- 9.1.5 Recent strategies and developments:
- 9.1.5.1 Acquisition and Mergers:
- 9.2 NIBE Industrier AB, Corp.
- 9.2.1 Company Overview
- 9.2.2 Financial Analysis
- 9.2.3 Segmental and Regional Analysis
- 9.2.4 Research & Development Expenses
- 9.3 Honeywell International, Inc.
- 9.3.1 Company Overview
- 9.3.2 Financial Analysis
- 9.3.3 Segmental and Regional Analysis
- 9.3.4 Research & Development Expenses
- 9.3.5 SWOT Analysis
- 9.4 Ariston Holding N.V.
- 9.4.1 Company Overview
- 9.4.2 Financial Analysis
- 9.4.3 Segmental and Regional Analysis
- 9.5 Max Weishaupt GmbH
- 9.5.1 Company Overview
- 9.6 Selas Heat Technology Company, LLC
- 9.6.1 Company Overview
- 9.7 Riello S.P.A. (Raytheon Technologies Corporation)
- 9.7.1 Company Overview
- 9.7.2 Financial Analysis
- 9.7.3 Segmental and Regional Analysis
- 9.7.4 Research & Development Expenses
- 9.7.5 Recent strategies and developments:
- 9.7.5.1 Product Launches and Product Expansions:
- 9.8 Fives Group (Novafives S.A.S.)
- 9.8.1 Company Overview
- 9.8.2 Financial Analysis
- 9.8.3 Segmental and Regional Analysis
- 9.8.4 Research & Development Expense
- 9.8.5 Recent strategies and developments:
- 9.8.5.1 Product Launches and Product Expansions:
- 9.9 Oilon Group Oy
- 9.9.1 Company Overview
- 9.10. Ebico Trading Ltd.
- 9.10.1 Company Overview
LIST OF TABLES
- TABLE 1 North America Industrial Burner Market, 2018 - 2021, USD Million
- TABLE 2 North America Industrial Burner Market, 2022 - 2028, USD Million
- TABLE 3 North America Industrial Burner Market by Operating Temperature, 2018 - 2021, USD Million
- TABLE 4 North America Industrial Burner Market by Operating Temperature, 2022 - 2028, USD Million
- TABLE 5 North America High Temperature (> 1,400°F) Market by Country, 2018 - 2021, USD Million
- TABLE 6 North America High Temperature (> 1,400°F) Market by Country, 2022 - 2028, USD Million
- TABLE 7 North America Low Temperature (< 1,400°F) Market by Country, 2018 - 2021, USD Million
- TABLE 8 North America Low Temperature (< 1,400°F) Market by Country, 2022 - 2028, USD Million
- TABLE 9 North America Industrial Burner Market by Vertical, 2018 - 2021, USD Million
- TABLE 10 North America Industrial Burner Market by Vertical, 2022 - 2028, USD Million
- TABLE 11 North America Chemicals Market by Country, 2018 - 2021, USD Million
- TABLE 12 North America Chemicals Market by Country, 2022 - 2028, USD Million
- TABLE 13 North America Petrochemicals Market by Country, 2018 - 2021, USD Million
- TABLE 14 North America Petrochemicals Market by Country, 2022 - 2028, USD Million
- TABLE 15 North America Automotive Market by Country, 2018 - 2021, USD Million
- TABLE 16 North America Automotive Market by Country, 2022 - 2028, USD Million
- TABLE 17 North America Power Generation Market by Country, 2018 - 2021, USD Million
- TABLE 18 North America Power Generation Market by Country, 2022 - 2028, USD Million
- TABLE 19 North America Metals & Mining Market by Country, 2018 - 2021, USD Million
- TABLE 20 North America Metals & Mining Market by Country, 2022 - 2028, USD Million
- TABLE 21 North America Food & Beverages Market by Country, 2018 - 2021, USD Million
- TABLE 22 North America Food & Beverages Market by Country, 2022 - 2028, USD Million
- TABLE 23 North America Others Market by Country, 2018 - 2021, USD Million
- TABLE 24 North America Others Market by Country, 2022 - 2028, USD Million
- TABLE 25 North America Industrial Burner Market by Burner Type, 2018 - 2021, USD Million
- TABLE 26 North America Industrial Burner Market by Burner Type, 2022 - 2028, USD Million
- TABLE 27 North America Radiant Burner Market by Country, 2018 - 2021, USD Million
- TABLE 28 North America Radiant Burner Market by Country, 2022 - 2028, USD Million
- TABLE 29 North America Direct-fired Burner Market by Country, 2018 - 2021, USD Million
- TABLE 30 North America Direct-fired Burner Market by Country, 2022 - 2028, USD Million
- TABLE 31 North America Regenerative Burner Market by Country, 2018 - 2021, USD Million
- TABLE 32 North America Regenerative Burner Market by Country, 2022 - 2028, USD Million
- TABLE 33 North America High Thermal Release Burner Market by Country, 2018 - 2021, USD Million
- TABLE 34 North America High Thermal Release Burner Market by Country, 2022 - 2028, USD Million
- TABLE 35 North America Self-recuperative Burner & Others Market by Country, 2018 - 2021, USD Million
- TABLE 36 North America Self-recuperative Burner & Others Market by Country, 2022 - 2028, USD Million
- TABLE 37 North America Industrial Burner Market by Fuel Type, 2018 - 2021, USD Million
- TABLE 38 North America Industrial Burner Market by Fuel Type, 2022 - 2028, USD Million
- TABLE 39 North America Oil Market by Country, 2018 - 2021, USD Million
- TABLE 40 North America Oil Market by Country, 2022 - 2028, USD Million
- TABLE 41 North America Dual Fuel Market by Country, 2018 - 2021, USD Million
- TABLE 42 North America Dual Fuel Market by Country, 2022 - 2028, USD Million
- TABLE 43 North America Gas Market by Country, 2018 - 2021, USD Million
- TABLE 44 North America Gas Market by Country, 2022 - 2028, USD Million
- TABLE 45 North America Solid Fuel Market by Country, 2018 - 2021, USD Million
- TABLE 46 North America Solid Fuel Market by Country, 2022 - 2028, USD Million
- TABLE 47 North America Industrial Burner Market by Power Rating, 2018 - 2021, USD Million
- TABLE 48 North America Industrial Burner Market by Power Rating, 2022 - 2028, USD Million
- TABLE 49 North America Monoblock Market by Country, 2018 - 2021, USD Million
- TABLE 50 North America Monoblock Market by Country, 2022 - 2028, USD Million
- TABLE 51 North America Duoblock Market by Country, 2018 - 2021, USD Million
- TABLE 52 North America Duoblock Market by Country, 2022 - 2028, USD Million
- TABLE 53 North America Industrial Burner Market by Country, 2018 - 2021, USD Million
- TABLE 54 North America Industrial Burner Market by Country, 2022 - 2028, USD Million
- TABLE 55 US Industrial Burner Market, 2018 - 2021, USD Million
- TABLE 56 US Industrial Burner Market, 2022 - 2028, USD Million
- TABLE 57 US Industrial Burner Market by Operating Temperature, 2018 - 2021, USD Million
- TABLE 58 US Industrial Burner Market by Operating Temperature, 2022 - 2028, USD Million
- TABLE 59 US Industrial Burner Market by Vertical, 2018 - 2021, USD Million
- TABLE 60 US Industrial Burner Market by Vertical, 2022 - 2028, USD Million
- TABLE 61 US Industrial Burner Market by Burner Type, 2018 - 2021, USD Million
- TABLE 62 US Industrial Burner Market by Burner Type, 2022 - 2028, USD Million
- TABLE 63 US Industrial Burner Market by Fuel Type, 2018 - 2021, USD Million
- TABLE 64 US Industrial Burner Market by Fuel Type, 2022 - 2028, USD Million
- TABLE 65 US Industrial Burner Market by Power Rating, 2018 - 2021, USD Million
- TABLE 66 US Industrial Burner Market by Power Rating, 2022 - 2028, USD Million
- TABLE 67 Canada Industrial Burner Market, 2018 - 2021, USD Million
- TABLE 68 Canada Industrial Burner Market, 2022 - 2028, USD Million
- TABLE 69 Canada Industrial Burner Market by Operating Temperature, 2018 - 2021, USD Million
- TABLE 70 Canada Industrial Burner Market by Operating Temperature, 2022 - 2028, USD Million
- TABLE 71 Canada Industrial Burner Market by Vertical, 2018 - 2021, USD Million
- TABLE 72 Canada Industrial Burner Market by Vertical, 2022 - 2028, USD Million
- TABLE 73 Canada Industrial Burner Market by Burner Type, 2018 - 2021, USD Million
- TABLE 74 Canada Industrial Burner Market by Burner Type, 2022 - 2028, USD Million
- TABLE 75 Canada Industrial Burner Market by Fuel Type, 2018 - 2021, USD Million
- TABLE 76 Canada Industrial Burner Market by Fuel Type, 2022 - 2028, USD Million
- TABLE 77 Canada Industrial Burner Market by Power Rating, 2018 - 2021, USD Million
- TABLE 78 Canada Industrial Burner Market by Power Rating, 2022 - 2028, USD Million
- TABLE 79 Mexico Industrial Burner Market, 2018 - 2021, USD Million
- TABLE 80 Mexico Industrial Burner Market, 2022 - 2028, USD Million
- TABLE 81 Mexico Industrial Burner Market by Operating Temperature, 2018 - 2021, USD Million
- TABLE 82 Mexico Industrial Burner Market by Operating Temperature, 2022 - 2028, USD Million
- TABLE 83 Mexico Industrial Burner Market by Vertical, 2018 - 2021, USD Million
- TABLE 84 Mexico Industrial Burner Market by Vertical, 2022 - 2028, USD Million
- TABLE 85 Mexico Industrial Burner Market by Burner Type, 2018 - 2021, USD Million
- TABLE 86 Mexico Industrial Burner Market by Burner Type, 2022 - 2028, USD Million
- TABLE 87 Mexico Industrial Burner Market by Fuel Type, 2018 - 2021, USD Million
- TABLE 88 Mexico Industrial Burner Market by Fuel Type, 2022 - 2028, USD Million
- TABLE 89 Mexico Industrial Burner Market by Power Rating, 2018 - 2021, USD Million
- TABLE 90 Mexico Industrial Burner Market by Power Rating, 2022 - 2028, USD Million
- TABLE 91 Rest of North America Industrial Burner Market, 2018 - 2021, USD Million
- TABLE 92 Rest of North America Industrial Burner Market, 2022 - 2028, USD Million
- TABLE 93 Rest of North America Industrial Burner Market by Operating Temperature, 2018 - 2021, USD Million
- TABLE 94 Rest of North America Industrial Burner Market by Operating Temperature, 2022 - 2028, USD Million
- TABLE 95 Rest of North America Industrial Burner Market by Vertical, 2018 - 2021, USD Million
- TABLE 96 Rest of North America Industrial Burner Market by Vertical, 2022 - 2028, USD Million
- TABLE 97 Rest of North America Industrial Burner Market by Burner Type, 2018 - 2021, USD Million
- TABLE 98 Rest of North America Industrial Burner Market by Burner Type, 2022 - 2028, USD Million
- TABLE 99 Rest of North America Industrial Burner Market by Fuel Type, 2018 - 2021, USD Million
- TABLE 100 Rest of North America Industrial Burner Market by Fuel Type, 2022 - 2028, USD Million
- TABLE 101 Rest of North America Industrial Burner Market by Power Rating, 2018 - 2021, USD Million
- TABLE 102 Rest of North America Industrial Burner Market by Power Rating, 2022 - 2028, USD Million
- TABLE 103 Key Information - Andritz AG
- TABLE 104 key information - NIBE Industrier AB, Corp.
- TABLE 105 Key Information - Honeywell International, Inc.
- TABLE 106 Key Information - Ariston Holding N.V.
- TABLE 107 Key Information - Max Weishaupt GmbH
- TABLE 108 Key Information - Selas Heat Technology Company, LLC
- TABLE 109 Key Information - RIELLO S.P.A.
- TABLE 110 Key Information - Fives Group
- TABLE 111 Key Information - Oilon Group Oy
- TABLE 112 Key Information - Ebico Trading Ltd.
List of Figures
- FIG 1 Methodology for the research
- FIG 2 Swot analysis: Honeywell international, inc.

