
PUBLISHER: MarketsandMarkets | PRODUCT CODE: 1777934
PUBLISHER: MarketsandMarkets | PRODUCT CODE: 1777934
Botulinum Toxins Market by Product, Application (Cosmetic, Therapeutic), Volume, End User, Region - Global Forecast to 2030
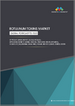
The global botulinum toxins market is projected to reach USD 15.7 billion by 2030 from USD 8.9 billion in 2025, at a CAGR of 11.7% during the forecast period.
| Scope of the Report | |
|---|---|
| Years Considered for the Study | 2024-2030 |
| Base Year | 2024 |
| Forecast Period | 2024-2030 |
| Units Considered | Value (USD billion) |
| Segments | Product, Type, Application, End User, and Region |
| Regions covered | North America, Europe, Asia Pacific, Latin America, and the Middle East & Africa |
The growth of the market can be attributed to the increasing societal and occupational emphasis on looking youthful, especially in urban and professional environments. This trend encourages more individuals to seek cosmetic procedures, including the use of botulinum toxins. In developing countries, rising disposable incomes and exposure to urban lifestyles are creating new patient demographics, which significantly increases the demand for botulinum toxins. These factors are expected to drive the market for botulinum toxins during the forecast period.
"Based on product, Botox held the largest share of the botulinum toxins market in 2024."
The botulinum toxins market is divided by product into major brands, including Botox, Dysport, Jeuveau, Myobloc, Xeomin, and other products. In 2024, Botox held the largest share of the market. The brand has established a strong reputation for clinical reliability, which instills confidence among cosmetologists, dermatologists, and aestheticians, as well as trust from end users such as clinics, spas, and hospitals. Botox offers a wide range of applications and demonstrates a safe and effective profile compared to its competitors.
Botox is utilized in various medical fields, including neurology, dermatology, urology, ophthalmology, and rehabilitation medicine, contributing to its increasing demand. Additionally, Botox provides extensive training modules and patient support programs. These factors have enabled Botox to surpass its competitors and secure a leading position in the botulinum toxins market.
"Based on type, the type A botulinum toxins segment held the largest share of the market in 2024."
The botulinum toxins market is divided into two main categories based on type: type A and type B botulinum toxins. Type A botulinum toxins occupy a significant share of the global market, primarily due to their proven clinical effectiveness and long history of regulatory approvals. Being the first serotype in this category, type A is supported by substantial evidence demonstrating its safety and efficacy in both therapeutic and aesthetic applications.
Type A is authorized for a wide range of uses around the world, including treatments for chronic migraines, spasticity, and reducing facial wrinkles, which contributes to its widespread adoption. Additionally, type A offers a longer-lasting effect, typically lasting between three and six months, resulting in fewer treatment sessions and greater patient convenience.
These factors reinforce type A's dominant position in manufacturing, sales, and demand within the botulinum toxins industry. In comparison, type A is preferred over type B because it provides effects lasting longer (up to six months) and has more extensive regulatory approvals for aesthetic and therapeutic purposes. It is also more potent at smaller doses and less likely to develop antibody resistance. Furthermore, type A is widely recognized among physicians, supported by extensive clinical experience and research, which cements its leading market position globally.
"Based on applications, the aesthetics segment commanded the largest market share in 2024."
The aesthetics segment, particularly wrinkle removal, is expected to dominate the botulinum toxins market. In 2024, wrinkle removal continues to be a popular and well-recognized application of botulinum toxins, especially among adults seeking non-surgical anti-aging solutions. Clinics report high patient volumes, primarily for the treatment of forehead lines, crow's feet, and glabellar (frown) lines. This popularity is attributed to the visible and relatively quick results, along with fewer treatment cycles needed, making it widely accepted across diverse demographics. The procedure duration is short, and the results are noticeable quickly, leading to its prominence among non-surgical options.
"Based on end users, the dermatology clinics & hospitals segment accounted for the largest share in 2024."
The global botulinum toxins market is segmented by end user into dermatology clinics & hospitals, beauty centers, medical spas, and other end users. In 2024, dermatology clinics & hospitals witnessed a significant demand for botulinum toxin products, as they serve as primary providers for both aesthetic and medical procedures.
Dermatology clinics primarily focus on cosmetic treatments, such as wrinkle reduction and facial contouring, which are among the most common applications of botulinum toxins. In contrast, hospitals use these toxins to treat various medical conditions, including muscle spasticity, chronic migraines, and dystonia. With their well-equipped facilities, access to trained professionals, and capacity to manage both routine and complex cases, hospitals and clinics are key players that drive consistent usage of botulinum toxin products.
"The market in North America is expected to hold a significant market share for botulinum toxins throughout the forecast period."
The botulinum toxins market comprises five key regions: North America, Europe, Asia Pacific, Latin America, and the Middle East & Africa. In 2024, the North America region held a significant market share for botulinum toxins. This growth is primarily attributed to a strong healthcare infrastructure and the considerable disposable income of the population. North America is also home to several major manufacturers of botulinum toxins, fostering a sustainable ecosystem of buyers, distributors, and suppliers. These factors are anticipated to contribute to the growth of the botulinum toxins market in North America.
A breakdown of the primary participants referred to for this report is provided below:
- By Company Type: Tier 1 (35%), Tier 2 (45%), and Tier 3 (20%)
- By Designation: C-level Executives (35%), Directors (25%), and Others (40%)
- By Region: North America (40%), Europe (30%), Asia Pacific (20%), Latin America (5%), and the Middle East & Africa (5%)
The key players profiled in the botulinum toxins market are by AbbVie Inc. (US), Ipsen Biopharmaceuticals Inc. (France), Galderma (Switzerland), Hugel, Inc. (South Korea), Revance Therapeutics, Inc. (US), Evolus, Inc. (US), Medytox, Inc. (South Korea), Merz Pharmaceuticals GmbH (Germany), Supernus Pharmaceuticals, Inc. (US), Daewoong Pharmaceutical Co., Ltd. (South Korea), Huons Co., Ltd. (South Korea), Eisai Co., Ltd. (Japan) and Hugh Source (International) Ltd. (Hong Kong).
Research Coverage
The research report examines the botulinum toxins market by product, type, application, end user, and region. This research examines the factors contributing to market expansion, analyzes the challenges and opportunities currently faced by various industries, and provides details on the competitive landscape, including both market leaders and small to medium-sized enterprises. Additionally, it estimates the revenue generated by different market segments across five regions and includes a micromarket analysis.
Reasons to Buy the Report
The report will assist market leaders and new entrants by providing accurate revenue estimates for the overall botulinum toxins market and its subsegments. It will help stakeholders understand the competitive landscape, allowing them to position their businesses more effectively and develop appropriate go-to-market strategies. Additionally, the report offers insights into the market dynamics, including key drivers, restraints, challenges, and opportunities.
This report provides insightful data on the following points:
- Market Penetration: In-depth coverage of product portfolios offered by the top players in the botulinum toxins market.
- Product Development/Innovation: In-depth coverage of product portfolios offered by the top players in the botulinum toxins market.
- Market Development: Insightful data on profitable developing areas.
- Market Diversification: Details about recent developments and advancements in the botulinum toxins market.
- Competitive Assessment: Extensive assessment of the products, growth tactics, revenue projections, and market categories of the top competitors.
TABLE OF CONTENTS
1 INTRODUCTION
- 1.1 STUDY OBJECTIVES
- 1.2 MARKET DEFINITION
- 1.3 STUDY SCOPE
- 1.3.1 MARKET SEGMENTATION & REGIONAL SCOPE
- 1.3.2 INCLUSIONS & EXCLUSIONS
- 1.3.3 YEARS CONSIDERED
- 1.3.4 CURRENCY CONSIDERED
- 1.4 STAKEHOLDERS
2 RESEARCH METHODOLOGY
- 2.1 RESEARCH DATA
- 2.1.1 SECONDARY RESEARCH
- 2.1.1.1 Key secondary sources
- 2.1.1.2 Key data from secondary sources
- 2.1.1.3 Objectives of secondary research
- 2.1.2 PRIMARY RESEARCH
- 2.1.2.1 Key primary sources
- 2.1.1 SECONDARY RESEARCH
- 2.2 MARKET SIZE ESTIMATION
- 2.2.1 BOTTOM-UP APPROACH
- 2.2.1.1 Company revenue estimation
- 2.2.1.2 Customer-based market estimation
- 2.2.1.3 Primary interviews
- 2.2.2 TOP-DOWN APPROACH
- 2.2.1 BOTTOM-UP APPROACH
- 2.3 GROWTH RATE ASSUMPTIONS
- 2.4 DATA TRIANGULATION
- 2.5 STUDY ASSUMPTIONS
- 2.6 RESEARCH LIMITATIONS
- 2.7 RISK ANALYSIS
3 EXECUTIVE SUMMARY
4 PREMIUM INSIGHTS
- 4.1 BOTULINUM TOXINS MARKET OVERVIEW
- 4.2 ASIA PACIFIC: BOTULINUM TOXINS MARKET, BY APPLICATION AND COUNTRY, 2024 (USD MILLION)
- 4.3 BOTULINUM TOXINS MARKET: EMERGING VS. DEVELOPED MARKETS, 2025 VS. 2030 (USD MILLION)
- 4.4 BOTULINUM TOXINS MARKET: GEOGRAPHIC GROWTH OPPORTUNITIES
5 MARKET OVERVIEW
- 5.1 INTRODUCTION
- 5.2 MARKET DYNAMICS
- 5.2.1 DRIVERS
- 5.2.1.1 Increased adoption in therapeutic indications
- 5.2.1.2 Reduced out-of-pocket expenditure due to sufficient reimbursement schemes
- 5.2.1.3 Aesthetic consciousness among adults
- 5.2.1.4 Greater acceptance and normalization of botulinum toxins among millennials and Gen Z
- 5.2.2 RESTRAINTS
- 5.2.2.1 Risk of infection and safety concerns
- 5.2.2.2 Complex regulatory framework and compliance standards
- 5.2.3 OPPORTUNITIES
- 5.2.3.1 High growth opportunities in emerging economies
- 5.2.3.2 Formulation advancements and innovations for improved safety
- 5.2.4 CHALLENGES
- 5.2.4.1 High treatment costs
- 5.2.4.2 Social and cultural barriers
- 5.2.1 DRIVERS
- 5.3 TRENDS/DISRUPTIONS IMPACTING CUSTOMER'S BUSINESS
- 5.4 PRICING ANALYSIS
- 5.4.1 AVERAGE SELLING PRICE TREND OF BOTULINUM TOXINS, BY KEY PLAYER, 2022-2024
- 5.4.2 AVERAGE SELLING PRICE TREND OF BOTULINUM TOXINS, BY REGION, 2022-2024
- 5.5 VALUE CHAIN ANALYSIS
- 5.5.1 RESEARCH & DEVELOPMENT
- 5.5.2 RAW MATERIAL PROCUREMENT AND MANUFACTURING
- 5.5.3 DISTRIBUTION AND MARKETING & SALES
- 5.5.4 AFTER-SALES SERVICES
- 5.6 SUPPLY CHAIN ANALYSIS
- 5.6.1 PROMINENT COMPANIES
- 5.6.2 SMALL & MEDIUM-SIZED ENTERPRISES
- 5.6.3 END USERS
- 5.7 ECOSYSTEM ANALYSIS
- 5.7.1 ROLE IN ECOSYSTEM
- 5.8 INVESTMENT & FUNDING SCENARIO
- 5.9 TECHNOLOGY ANALYSIS
- 5.9.1 KEY TECHNOLOGIES
- 5.9.1.1 Jet-based delivery systems
- 5.9.1.2 Facial imaging and mapping systems
- 5.9.2 COMPLEMENTARY TECHNOLOGIES
- 5.9.2.1 Laser, RF, & ultrasound-based devices
- 5.9.3 ADJACENT TECHNOLOGIES
- 5.9.3.1 3D imaging and AI-based facial mapping
- 5.9.1 KEY TECHNOLOGIES
- 5.10 PATENT ANALYSIS
- 5.10.1 INNOVATIONS AND PATENT REGISTRATIONS
- 5.11 TRADE ANALYSIS
- 5.11.1 IMPORT DATA FOR HS CODE 300290, 2020-2024
- 5.11.2 EXPORT DATA FOR HS CODE 300290, 2020-2024
- 5.12 KEY CONFERENCES & EVENTS, 2025-2026
- 5.13 CASE STUDY ANALYSIS
- 5.13.1 COMMERCIAL PARTNERSHIPS BY ANIKA THERAPEUTICS TO INCREASE MEDICAL AESTHETIC PRODUCT SALES
- 5.13.2 DIVISION OF BUSINESS BY MERZ BIOPHARMA TO HELP EFFECIENTLY MEET CUSTOMER DEMANDS
- 5.13.3 COLLABORATIONS BETWEEN CANDELA CORPORATION AND SMES TO STREAMLINE LASER-BASED DEVICES
- 5.14 REGULATORY ANANLYSIS
- 5.14.1 REGULATORY BODIES, GOVERNMENT AGENCIES, AND OTHER ORGANIZATIONS
- 5.14.2 KEY REGULATORY GUIDELINES
- 5.14.2.1 North America
- 5.14.2.1.1 US
- 5.14.2.1.2 Canada
- 5.14.2.2 Europe
- 5.14.2.2.1 UK
- 5.14.2.2.2 France
- 5.14.2.2.3 Germany
- 5.14.2.3 Asia Pacific
- 5.14.2.3.1 China
- 5.14.2.3.2 Japan
- 5.14.2.3.3 India
- 5.14.2.4 Latin America
- 5.14.2.4.1 Brazil
- 5.14.2.5 Middle East & Africa
- 5.14.2.5.1 UAE
- 5.14.2.1 North America
- 5.14.3 REGULATORY STANDARDS/APPROVALS
- 5.15 REIMBURSEMENT SCENARIO ANALYSIS
- 5.15.1 NORTH AMERICA
- 5.15.1.1 US
- 5.15.1.2 Canada
- 5.15.2 EUROPE
- 5.15.2.1 UK
- 5.15.2.2 Germany
- 5.15.2.3 France
- 5.15.2.4 Italy
- 5.15.2.5 Spain
- 5.15.3 ASIA PACIFIC
- 5.15.3.1 China
- 5.15.3.2 Japan
- 5.15.3.3 India
- 5.15.3.4 Australia
- 5.15.4 LATIN AMERICA
- 5.15.4.1 Brazil
- 5.15.4.2 Mexico
- 5.15.5 MIDDLE EAST & AFRICA
- 5.15.5.1 GCC Countries
- 5.15.5.2 Africa (Major Economies)
- 5.15.1 NORTH AMERICA
- 5.16 PORTER'S FIVE FORCE ANALYSIS
- 5.16.1 THREAT OF NEW ENTRANTS
- 5.16.2 THREAT OF SUBSTITUTES
- 5.16.3 BARGAINING POWER OF SUPPLIERS
- 5.16.4 BARGAINING POWER OF BUYERS
- 5.16.5 INTENSITY OF COMPETITIVE RIVALRY
- 5.17 KEY STAKEHOLDERS & BUYING CRITERIA
- 5.17.1 KEY STAKEHOLDERS IN BUYING PROCESS
- 5.17.2 BUYING CRITERIA
- 5.18 UNMET NEEDS
- 5.19 IMPACT OF 2025 US TARIFF ON BOTULINUM TOXINS MARKET
- 5.19.1 INTRODUCTION
- 5.19.2 KEY TARIFF RATES
- 5.19.3 PRICE IMPACT ANALYSIS
- 5.19.4 IMPACT ON COUNTRY/REGION
- 5.19.4.1 North America
- 5.19.4.1.1 US
- 5.19.4.2 Europe
- 5.19.4.3 Asia Pacific
- 5.19.4.1 North America
- 5.19.5 IMPACT ON END-USE INDUSTRIES
- 5.20 IMPACT OF AI/GEN AI ON BOTULINUM TOXINS MARKET
- 5.20.1 MARKET POTENTIAL OF AI/GEN AI
- 5.20.2 AI USE CASES
- 5.20.3 KEY COMPANIES IMPLEMENTING AI/GEN AI
- 5.20.4 FUTURE OF AI/GEN AI
6 BOTULINUM TOXINS MARKET, BY PRODUCT
- 6.1 INTRODUCTION
- 6.2 BOTOX
- 6.2.1 USE IN THERAPEUTIC AND COSMETIC PROCEDURES TO AUGMENT MARKET GROWTH
- 6.3 DYSPORT
- 6.3.1 FASTER ONSET DURATION AND LONG-LASTING EFFECT TO BOOST MARKET ADOPTION
- 6.4 JEUVEAU
- 6.4.1 INTRODUCTION OF TECH-ENABLED PLATFORMS FOR CONSUMER SUPPORT TO FUEL MARKET GROWTH
- 6.5 MYOBLOC
- 6.5.1 WIDE THERAPEUTIC PROFILE TO DRIVE MARKET
- 6.6 XEOMIN
- 6.6.1 STABLE THERAPEUTIC PERFORMANCE AND EFFECTIVE FORMULATION TO FAVOR MARKET GROWTH
- 6.7 OTHER PRODUCTS
7 BOTULINUM TOXINS MARKET, BY TYPE
- 7.1 INTRODUCTION
- 7.2 TYPE A BOTULINUM TOXINS
- 7.2.1 GLOBAL CLINICAL ACCEPTANCE AND PROVEN EFFICACY TO SUPPORT MARKET GROWTH
- 7.3 TYPE B BOTULINUM TOXINS
- 7.3.1 WIDE THERAPEUTIC UTILITY AND DISTINCT CLINICAL PROFILE TO PROPEL MARKET GROWTH
8 BOTULINUM TOXINS MARKET, BY AGE GROUP
- 8.1 INTRODUCTION
- 8.2 17 YEARS OR YOUNGER
- 8.2.1 INCREASING THERAPEUTIC USE OF BOTOX TO PROPEL MARKET GROWTH AMONG YOUNGER PEOPLE
- 8.3 18-34 YEARS
- 8.3.1 GOOD TOLERABILITY AND IMPROVED PATIENT-REPORTED OUTCOMES TO DRIVE ADOPTION OF BOTOX TREATMENT
- 8.4 35-50 YEARS
- 8.4.1 NEED FOR APPEARANCE MAINTENANCE AND BETTER SOCIAL ENGAGEMENT TO FUEL MARKET GROWTH
- 8.5 51-64 YEARS OLD
- 8.5.1 SUSTAINED DEMAND FOR COSMETIC AND THERAPEUTIC INDICATIONS TO AUGMENT MARKET GROWTH
- 8.6 65 YEARS OR OLDER
- 8.6.1 HIGH DEMAND FOR FUNCTIONAL IMPROVEMENTS AND CONSERVATIVE AESTHETIC ENHANCEMENTS TO DRIVE MARKET
9 BOTULINUM TOXINS MARKET, BY APPLICATION
- 9.1 INTRODUCTION
- 9.2 COSMETIC APPLICATIONS
- 9.2.1 WRINKLE REMOVAL
- 9.2.1.1 Surge in beauty clinics and medical spas to support segment growth
- 9.2.2 FACIAL CONTOURING
- 9.2.2.1 Rising desire for natural results and growing appeal of minimally invasive procedures to propel segment growth
- 9.2.3 SKIN REJUVENATION
- 9.2.3.1 Increased adoption of minimally invasive facial enhancement procedures to boost market growth
- 9.2.1 WRINKLE REMOVAL
- 9.3 THERAPEUTIC APPLICATIONS
- 9.3.1 PAIN MANAGEMENT
- 9.3.1.1 Rising need for pain management techniques to drive segment
- 9.3.2 OVERACTIVE BLADDER
- 9.3.2.1 Localized mechanism, strong efficacy, and long-lasting relief to spur demand for botulinum toxins among neurogenic patients
- 9.3.1 PAIN MANAGEMENT
- 9.4 OTHER APPLICATIONS
10 BOTULINUM TOXINS MARKET, BY END USER
- 10.1 INTRODUCTION
- 10.2 DERMATOLOGY CLINICS & HOSPITALS
- 10.2.1 RISING TREND OF MEDICAL TOURISM AND INCREASING POPULARITY OF PLASTIC SURGERY TO SUPPORT MARKET GROWTH
- 10.3 BEAUTY CENTERS
- 10.3.1 GROWING INCLINATION TOWARD CUSTOMIZED TREATMENTS TO BOOST MARKET GROWTH
- 10.4 MEDICAL SPAS
- 10.4.1 INCREASING FOCUS ON CONVENIENCE, TREATMENT FLEXIBILITY, AND COST EFFECTIVENESS TO SPUR MARKET GROWTH
- 10.5 OTHER END USERS
11 BOTULINUM TOXINS MARKET, BY REGION
- 11.1 INTRODUCTION
- 11.2 NORTH AMERICA
- 11.2.1 MACROECONOMIC OUTLOOK FOR NORTH AMERICA
- 11.2.2 US
- 11.2.2.1 US to dominate North American botulinum toxins market during study period
- 11.2.3 CANADA
- 11.2.3.1 Preference for minimally invasive cosmetic procedures among aging individuals to drive market growth
- 11.3 EUROPE
- 11.3.1 MACROECONOMIC OUTLOOK FOR EUROPE
- 11.3.2 GERMANY
- 11.3.2.1 Selective reimbursement regimes and large number of cosmetic procedures to spur market demand
- 11.3.3 UK
- 11.3.3.1 Increased demand for Botox for cosmetic enhancements to propel market growth
- 11.3.4 FRANCE
- 11.3.4.1 Increased awareness and broader societal acceptance of cosmetic treatments to augment market growth
- 11.3.5 ITALY
- 11.3.5.1 Rising number of medical aesthetic procedures to aid market growth
- 11.3.6 SPAIN
- 11.3.6.1 Growing availability of safe and effective minimally invasive or non-invasive aesthetic treatments to aid market growth
- 11.3.7 REST OF EUROPE
- 11.4 ASIA PACIFIC
- 11.4.1 MACROECONOMIC OUTLOOK FOR ASIA PACIFIC
- 11.4.2 JAPAN
- 11.4.2.1 Popularity of medical tourism to increase demand for cosmetic treatments
- 11.4.3 CHINA
- 11.4.3.1 Surging demand for non-surgical aesthetic procedures to support market growth
- 11.4.4 INDIA
- 11.4.4.1 Lack of reimbursements for aesthetic treatments alongside social and ethical concerns to limit market growth
- 11.4.5 AUSTRALIA
- 11.4.5.1 Increased number of aesthetic procedures to grow market for botulinum toxins
- 11.4.6 SOUTH KOREA
- 11.4.6.1 Rising availability of safe and effective minimally invasive and non-invasive aesthetic procedures and products to drive market
- 11.4.7 REST OF ASIA PACIFIC
- 11.5 LATIN AMERICA
- 11.5.1 MACROECONOMIC OUTLOOK FOR LATIN AMERICA
- 11.5.2 BRAZIL
- 11.5.2.1 Rapid growth in medical tourism and high disposable incomes to expedite market growth
- 11.5.3 MEXICO
- 11.5.3.1 Rising influx of medical tourists from US to drive adoption of cost-effective cosmetic procedures
- 11.5.4 REST OF LATIN AMERICA
- 11.6 MIDDLE EAST & AFRICA
- 11.6.1 MACROECONOMIC OUTLOOK FOR MIDDLE EAST & AFRICA
- 11.6.2 GCC COUNTRIES
- 11.6.2.1 Favorable government policies to propel market growth
- 11.6.3 REST OF MIDDLE EAST & AFRICA
12 COMPETITIVE LANDSCAPE
- 12.1 INTRODUCTION
- 12.2 KEY PLAYERS' STRATEGIES/RIGHT TO WIN
- 12.2.1 OVERVIEW OF STRATEGIES ADOPTED BY KEY PLAYERS IN BOTULINUM TOXINS MARKET
- 12.3 REVENUE ANALYSIS, 2020-2024
- 12.4 MARKET SHARE ANALYSIS, 2024
- 12.4.1 MARKET RANKING OF KEY PLAYERS, 2024
- 12.5 COMPANY VALUATION & FINANCIAL METRICS
- 12.5.1 FINANCIAL METRICS
- 12.5.2 COMPANY VALUATION
- 12.6 BRAND/PRODUCT COMPARISON
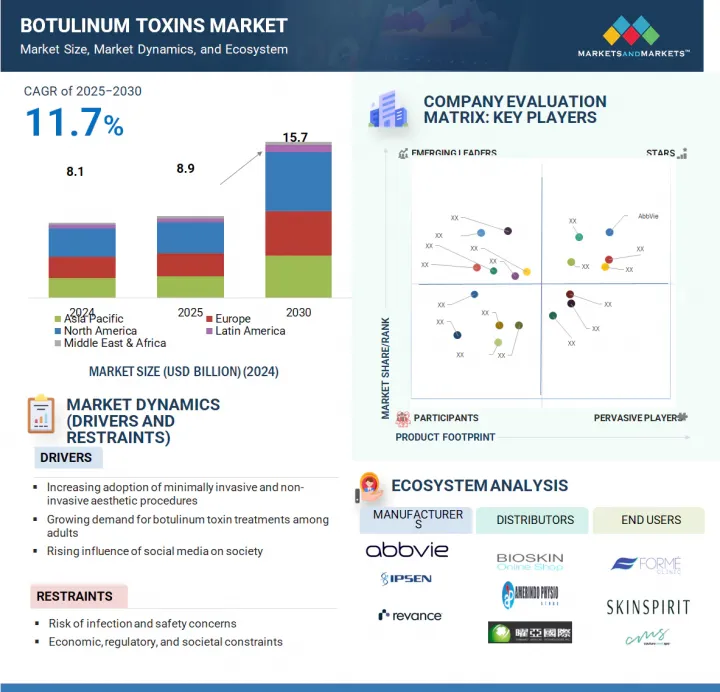
- 12.7 COMPANY EVALUATION MATRIX: KEY PLAYERS, 2024
- 12.7.1 STARS
- 12.7.2 PERVASIVE PLAYERS
- 12.7.3 EMERGING LEADERS
- 12.7.4 PARTICIPANTS
- 12.7.5 COMPANY FOOTPRINT: KEY PLAYERS, 2024
- 12.7.5.1 Company footprint
- 12.7.5.2 Region footprint
- 12.7.5.3 Type footprint
- 12.7.5.4 Application footprint
- 12.7.5.5 End-user footprint
- 12.8 COMPANY EVALUATION MATRIX: STARTUPS/SMES, 2024
- 12.8.1 PROGRESSIVE COMPANIES
- 12.8.2 RESPONSIVE COMPANIES
- 12.8.3 DYNAMIC COMPANIES
- 12.8.4 STARTING BLOCKS
- 12.8.5 COMPETITIVE BENCHMARKING OF STARTUPS/SMES, 2024
- 12.8.5.1 Detailed list of key startups/SMEs
- 12.8.5.2 Competitive benchmarking of key startups/SMEs
- 12.9 COMPETITIVE SCENARIO
- 12.9.1 PRODUCT LAUNCHES & APPROVALS
- 12.9.2 DEALS
- 12.9.3 EXPANSIONS
13 COMPANY PROFILES
- 13.1 KEY PLAYERS
- 13.1.1 ABBVIE INC.
- 13.1.1.1 Business overview
- 13.1.1.2 Products offered
- 13.1.1.3 Recent developments
- 13.1.1.3.1 Deals
- 13.1.1.3.2 Expansions
- 13.1.1.3.3 Other developments
- 13.1.1.4 MnM view
- 13.1.1.4.1 Key strengths
- 13.1.1.4.2 Strategic choices
- 13.1.1.4.3 Weaknesses & competitive threats
- 13.1.2 IPSEN BIOPHARMACEUTICALS, INC.
- 13.1.2.1 Business overview
- 13.1.2.2 Products offered
- 13.1.2.3 Recent developments
- 13.1.2.3.1 Product approvals
- 13.1.2.3.2 Expansions
- 13.1.2.3.3 Other developments
- 13.1.2.4 MnM view
- 13.1.2.4.1 Key strengths
- 13.1.2.4.2 Strategic choices
- 13.1.2.4.3 Weaknesses & competitive threats
- 13.1.3 GALDERMA
- 13.1.3.1 Business overview
- 13.1.3.2 Products offered
- 13.1.3.3 Recent developments
- 13.1.3.3.1 Product launches
- 13.1.3.3.2 Deals
- 13.1.3.3.3 Expansions
- 13.1.3.4 MnM view
- 13.1.3.4.1 Key strengths
- 13.1.3.4.2 Strategic choices
- 13.1.3.4.3 Weaknesses & competitive threats
- 13.1.4 HUGEL, INC.
- 13.1.4.1 Business overview
- 13.1.4.2 Products offered
- 13.1.4.3 Recent developments
- 13.1.4.3.1 Product approvals
- 13.1.4.3.2 Deals
- 13.1.4.3.3 Expansions
- 13.1.4.4 MnM view
- 13.1.4.4.1 Key strengths
- 13.1.4.4.2 Strategic choices
- 13.1.4.4.3 Weaknesses & competitive threats
- 13.1.5 REVANCE
- 13.1.5.1 Business overview
- 13.1.5.2 Products offered
- 13.1.5.3 Recent developments
- 13.1.5.3.1 Product launches & approvals
- 13.1.5.3.2 Deals
- 13.1.5.4 MnM view
- 13.1.5.4.1 Key strengths
- 13.1.5.4.2 Strategic choices
- 13.1.5.4.3 Weaknesses & competitive threats
- 13.1.6 EVOLUS, INC.
- 13.1.6.1 Business overview
- 13.1.6.2 Products offered
- 13.1.6.3 Recent developments
- 13.1.6.3.1 Product launches & approvals
- 13.1.6.3.2 Deals
- 13.1.7 MEDYTOX
- 13.1.7.1 Business overview
- 13.1.7.2 Products offered
- 13.1.7.3 Recent developments
- 13.1.7.3.1 Product approvals
- 13.1.7.3.2 Deals
- 13.1.8 MERZ PHARMA
- 13.1.8.1 Business overview
- 13.1.8.2 Products offered
- 13.1.8.3 Recent developments
- 13.1.8.3.1 Product approvals
- 13.1.9 SUPERNUS PHARMACEUTICALS, INC.
- 13.1.9.1 Business overview
- 13.1.9.2 Products offered
- 13.1.10 DAEWOONG PHARMACEUTICAL CO., LTD.
- 13.1.10.1 Business overview
- 13.1.10.2 Products offered
- 13.1.10.3 Recent developments
- 13.1.10.3.1 Product launches & approvals
- 13.1.11 HUONS
- 13.1.11.1 Business overview
- 13.1.11.2 Products offered
- 13.1.11.3 Recent developments
- 13.1.11.3.1 Product launches & approvals
- 13.1.12 EISAI CO., LTD.
- 13.1.12.1 Business overview
- 13.1.12.2 Products offered
- 13.1.13 HUGH SOURCE (INTERNATIONAL) LTD.
- 13.1.13.1 Business overview
- 13.1.13.2 Products offered
- 13.1.1 ABBVIE INC.
- 13.2 OTHER PLAYERS
- 13.2.1 DERMAX CO., LTD.
- 13.2.2 GUFIC BIOSCIENCES
- 13.2.3 OCEAN PHARMACEUTICAL
- 13.2.4 CROMA-PHARMA GMBH
- 13.2.5 MICROGEN
- 13.2.6 JDBIO CO., LTD.
- 13.2.7 CKD BIO
- 13.2.8 ATRAZIST ARAY CO.
- 13.2.9 GUANGZHOU AOMA BUSINESS CO., LTD.
- 13.2.10 JETEMA CO., LTD.
- 13.2.11 SINOPHARM GROUP CO., LTD.
- 13.2.12 QUFU HANTANG BIOTECHNOLOGY CO., LTD.
14 APPENDIX
- 14.1 DISCUSSION GUIDE
- 14.2 KNOWLEDGESTORE: MARKETSANDMARKETS' SUBSCRIPTION PORTAL
- 14.3 CUSTOMIZATION OPTIONS
- 14.4 RELATED REPORTS
- 14.5 AUTHOR DETAILS
List of Tables
- TABLE 1 BOTULINUM TOXINS MARKET: INCLUSIONS & EXCLUSIONS
- TABLE 2 BOTULINUM TOXINS MARKET: STUDY ASSUMPTIONS
- TABLE 3 BOTULINUM TOXINS MARKET: RISK ANALYSIS
- TABLE 4 BOTULINUM TOXINS MARKET: IMPACT ANALYSIS OF MARKET DYNAMICS
- TABLE 5 AVERAGE SELLING PRICE TREND OF BOTULINUM TOXINS, BY KEY PLAYER, 2022-2024 (USD)
- TABLE 6 AVERAGE SELLING PRICE TREND OF BOTULINUM TOXINS, BY REGION, 2022-2024 (USD THOUSAND)
- TABLE 7 BOTULINUM TOXINS MARKET: ROLE IN ECOSYSTEM
- TABLE 8 BOTULINUM TOXINS MARKET: INNOVATIONS AND PATENT REGISTRATIONS, 2024
- TABLE 9 IMPORT SCENARIO FOR HS CODE 300290, BY COUNTRY, 2020-2024 (USD)
- TABLE 10 EXPORT SCENARIO FOR HS CODE 300290, BY COUNTRY, 2020-2024 (USD)
- TABLE 11 BOTULINUM TOXINS MARKET: LIST OF KEY CONFERENCES & EVENTS, JANUARY 2025-DECEMBER 2026
- TABLE 12 CASE STUDY 1: COMMERCIAL PARTNERSHIPS BY ANIKA THERAPEUTICS TO INCREASE MEDICAL AESTHETIC PRODUCT SALES
- TABLE 13 CASE STUDY 2: DIVISION OF BUSINESS BY MERZ BIOPHARMA TO HELP EFFECIENTLY MEET CUSTOMER DEMANDS
- TABLE 14 CASE STUDY 3: COLLABORATIONS BETWEEN CANDELA CORPORATION AND SMES TO STREAMLINE LASER-BASED DEVICES
- TABLE 15 NORTH AMERICA: REGULATORY BODIES, GOVERNMENT AGENCIES, AND OTHER ORGANIZATIONS
- TABLE 16 EUROPE: REGULATORY BODIES, GOVERNMENT AGENCIES, AND OTHER ORGANIZATIONS
- TABLE 17 ASIA PACIFIC: REGULATORY BODIES, GOVERNMENT AGENCIES, AND OTHER ORGANIZATIONS
- TABLE 18 REST OF THE WORLD: REGULATORY BODIES, GOVERNMENT AGENCIES, AND OTHER ORGANIZATIONS
- TABLE 19 REGULATORY STANDARD/APPROVAL AUTHORIZATION AND CLASS OF APPROVAL FOR PRODUCTS USED IN AESTHETIC PROCEDURES, BY COUNTRY
- TABLE 20 BOTULINUM TOXINS MARKET: PORTER'S FIVE FORCES
- TABLE 21 INFLUENCE OF KEY STAKEHOLDERS ON BUYING PROCESS OF BOTULINUM TOXINS, BY TYPE
- TABLE 22 INFLUENCE OF KEY STAKEHOLDERS ON BUYING PROCESS OF BOTULINUM TOXINS, BY END USER
- TABLE 23 BOTULINUM TOXINS MARKET: UNMET NEEDS
- TABLE 24 RECIPROCAL TARIFF RATES ADJUSTED BY US, 2024
- TABLE 25 KEY COMPANIES IMPLEMENTING AI/GEN AI IN BOTULINUM TOXINS MARKET
- TABLE 26 BOTULINUM TOXINS MARKET, BY PRODUCT, 2023-2030 (USD MILLION)
- TABLE 27 BOTULINUM TOXINS MARKET, BY TYPE, 2023-2030 (USD MILLION)
- TABLE 28 TYPE A BOTULINUM TOXINS MARKET, BY REGION, 2023-2030 (USD MILLION)
- TABLE 29 NORTH AMERICA: TYPE A BOTULINUM TOXINS MARKET, BY COUNTRY, 2023-2030 (USD MILLION)
- TABLE 30 EUROPE: TYPE A BOTULINUM TOXINS MARKET, BY COUNTRY, 2023-2030 (USD MILLION)
- TABLE 31 ASIA PACIFIC: TYPE A BOTULINUM TOXINS MARKET, BY COUNTRY, 2023-2030 (USD MILLION)
- TABLE 32 LATIN AMERICA: TYPE A BOTULINUM TOXINS MARKET, BY COUNTRY, 2023-2030 (USD MILLION)
- TABLE 33 MIDDLE EAST & AFRICA: TYPE A BOTULINUM TOXINS MARKET, 2023-2030 (USD MILLION)
- TABLE 34 TYPE A BOTULINUM TOXINS MARKET, BY APPLICATION, 2023-2030 (USD MILLION)
- TABLE 35 TYPE A BOTULINUM TOXINS MARKET, BY END USER, 2023-2030 (USD MILLION)
- TABLE 36 TYPE B BOTULINUM TOXINS MARKET, BY REGION, 2023-2030 (USD MILLION)
- TABLE 37 NORTH AMERICA: TYPE B BOTULINUM TOXINS MARKET, BY COUNTRY, 2023-2030 (USD MILLION)
- TABLE 38 TYPE B BOTULINUM TOXINS MARKET, BY APPLICATION, 2023-2030 (USD MILLION)
- TABLE 39 TYPE B BOTULINUM TOXINS MARKET, BY END USER, 2023-2030 (USD MILLION)
- TABLE 40 BOTULINUM TOXINS MARKET, BY AGE GROUP, 2023-2030 (USD MILLION)
- TABLE 41 BOTULINUM TOXINS MARKET FOR 17 YEARS OR YOUNGER, BY REGION, 2023-2030 (USD MILLION)
- TABLE 42 BOTULINUM TOXINS MARKET FOR 18-34 YEARS, BY REGION, 2023-2030 (USD MILLION)
- TABLE 43 BOTULINUM TOXINS MARKET FOR 35-50 YEARS, BY REGION, 2023-2030 (USD MILLION)
- TABLE 44 BOTULINUM TOXINS MARKET FOR 51-64 YEARS, BY REGION, 2023-2030 (USD MILLION)
- TABLE 45 BOTULINUM TOXINS MARKET FOR 65 YEARS OR OLDER, BY REGION, 2023-2030 (USD MILLION)
- TABLE 46 BOTULINUM TOXINS MARKET, BY APPLICATION, 2023-2030 (USD MILLION)
- TABLE 47 BOTULINUM TOXINS MARKET FOR COSMETIC APPLICATIONS, BY TYPE, 2023-2030 (USD MILLION)
- TABLE 48 BOTULINUM TOXINS MARKET FOR COSMETIC APPLICATIONS, BY REGION, 2023-2030 (USD MILLION)
- TABLE 49 WRINKLE REMOVAL MARKET, BY REGION, 2023-2030 (USD MILLION)
- TABLE 50 FACIAL CONTOURING MARKET, BY REGION, 2023-2030 (USD MILLION)
- TABLE 51 SKIN REJUVENATION MARKET, BY REGION, 2023-2030 (USD MILLION)
- TABLE 52 BOTULINUM TOXINS MARKET FOR THERAPEUTIC APPLICATIONS, BY TYPE, 2023-2030 (USD MILLION)
- TABLE 53 BOTULINUM TOXINS MARKET FOR THERAPEUTIC APPLICATIONS, BY REGION, 2023-2030 (USD MILLION)
- TABLE 54 PAIN MANAGEMENT MARKET, BY TYPE, 2023-2030 (USD MILLION)
- TABLE 55 PAIN MANAGEMENT MARKET, BY REGION, 2023-2030 (USD MILLION)
- TABLE 56 OVERACTIVE BLADDER MARKET, BY REGION, 2023-2030 (USD MILLION)
- TABLE 57 BOTULINUM TOXINS MARKET FOR OTHER APPLICATIONS, BY REGION, 2023-2030 (USD MILLION)
- TABLE 58 BOTULINUM TOXINS MARKET, BY END USER, 2023-2030 (USD MILLION)
- TABLE 59 BOTULINUM TOXINS MARKET FOR DERMATOLOGY CLINICS & HOSPITALS, BY REGION, 2023-2030 (USD MILLION)
- TABLE 60 BOTULINUM TOXINS MARKET FOR BEAUTY CENTERS, BY REGION, 2023-2030 (USD MILLION)
- TABLE 61 BOTULINUM TOXINS MARKET FOR MEDICAL SPAS, BY REGION, 2023-2030 (USD MILLION)
- TABLE 62 BOTULINUM TOXINS MARKET FOR OTHER END USERS, BY REGION, 2023-2030 (USD MILLION)
- TABLE 63 BOTULINUM TOXINS MARKET, BY REGION, 2023-2030 (USD MILLION)
- TABLE 64 GLOBAL: NUMBER OF BOTULINUM TOXIN PROCEDURES, 2021-2023 (UNITS)
- TABLE 65 NORTH AMERICA: KEY MACROINDICATORS
- TABLE 66 NORTH AMERICA: BOTULINUM TOXINS MARKET, BY COUNTRY, 2023-2030 (USD MILLION)
- TABLE 67 NORTH AMERICA: BOTULINUM TOXINS MARKET, BY TYPE, 2023-2030 (USD MILLION)
- TABLE 68 NORTH AMERICA: BOTULINUM TOXINS MARKET, BY AGE GROUP, 2023-2030 (USD MILLION)
- TABLE 69 NORTH AMERICA: BOTULINUM TOXINS MARKET, BY APPLICATION, 2023-2030 (USD MILLION)
- TABLE 70 NORTH AMERICA: BOTULINUM TOXINS MARKET, BY END USER, 2023-2030 (USD MILLION)
- TABLE 71 US: NUMBER OF BOTULINUM TOXIN PROCEDURES, 2021-2023 (UNITS)
- TABLE 72 US: BOTULINUM TOXINS MARKET, BY TYPE, 2023-2030 (USD MILLION)
- TABLE 73 CANADA: BOTULINUM TOXINS MARKET, BY TYPE, 2023-2030 (USD MILLION)
- TABLE 74 EUROPE: BOTULINUM TOXINS MARKET, BY COUNTRY, 2023-2030 (USD MILLION)
- TABLE 75 EUROPE: BOTULINUM TOXINS MARKET, BY TYPE, 2023-2030 (USD MILLION)
- TABLE 76 EUROPE: BOTULINUM TOXINS MARKET, BY AGE GROUP, 2023-2030 (USD MILLION)
- TABLE 77 EUROPE: BOTULINUM TOXINS MARKET, BY APPLICATION, 2023-2030 (USD MILLION)
- TABLE 78 EUROPE: BOTULINUM TOXINS MARKET, BY END USER, 2023-2030 (USD MILLION)
- TABLE 79 EUROPE: KEY MACROINDICATORS
- TABLE 80 GERMANY: NUMBER OF BOTULINUM TOXIN PROCEDURES, 2021-2023 (UNITS)
- TABLE 81 GERMANY: BOTULINUM TOXINS MARKET, BY TYPE, 2023-2030 (USD MILLION)
- TABLE 82 UK: NUMBER OF BOTULINUM TOXIN PROCEDURES, 2021-2023 (UNITS)
- TABLE 83 UK: BOTULINUM TOXINS MARKET, BY TYPE, 2023-2030 (USD MILLION)
- TABLE 84 FRANCE: NUMBER OF BOTULINUM TOXIN PROCEDURES, 2021-2023 (UNITS)
- TABLE 85 FRANCE: BOTULINUM TOXINS MARKET, BY TYPE, 2023-2030 (USD MILLION)
- TABLE 86 ITALY: NUMBER OF BOTULINUM TOXIN PROCEDURES, 2021-2023 (UNITS)
- TABLE 87 ITALY: BOTULINUM TOXINS MARKET, BY TYPE, 2023-2030 (USD MILLION)
- TABLE 88 SPAIN: NUMBER OF BOTULINUM TOXIN PROCEDURES, 2021-2023 (UNITS)
- TABLE 89 SPAIN: BOTULINUM TOXINS MARKET, BY TYPE, 2023-2030 (USD MILLION)
- TABLE 90 REST OF EUROPE: BOTULINUM TOXINS MARKET, BY TYPE, 2023-2030 (USD MILLION)
- TABLE 91 ASIA PACIFIC: KEY MACROINDICATORS
- TABLE 92 ASIA PACIFIC: BOTULINUM TOXINS MARKET, BY COUNTRY, 2023-2030 (USD MILLION)
- TABLE 93 ASIA PACIFIC: BOTULINUM TOXINS MARKET, BY TYPE, 2023-2030 (USD MILLION)
- TABLE 94 ASIA PACIFIC: BOTULINUM TOXINS MARKET, BY AGE GROUP, 2023-2030 (USD MILLION)
- TABLE 95 ASIA PACIFIC: BOTULINUM TOXINS MARKET, BY APPLICATION, 2023-2030 (USD MILLION)
- TABLE 96 ASIA PACIFIC: BOTULINUM TOXINS MARKET, BY END USER, 2023-2030 (USD MILLION)
- TABLE 97 JAPAN: BOTULINUM TOXINS MARKET, BY TYPE, 2023-2030 (USD MILLION)
- TABLE 98 CHINA: BOTULINUM TOXINS MARKET, BY TYPE, 2023-2030 (USD MILLION)
- TABLE 99 INDIA: NUMBER OF BOTULINUM TOXIN PROCEDURES, 2021-2023 (UNITS)
- TABLE 100 INDIA: BOTULINUM TOXINS MARKET, BY TYPE, 2023-2030 (USD MILLION)
- TABLE 101 AUSTRALIA: BOTULINUM TOXINS MARKET, BY TYPE, 2023-2030 (USD MILLION)
- TABLE 102 SOUTH KOREA: BOTULINUM TOXINS MARKET, BY TYPE, 2023-2030 (USD MILLION)
- TABLE 103 REST OF ASIA PACIFIC: BOTULINUM TOXINS MARKET, BY TYPE, 2023-2030 (USD MILLION)
- TABLE 104 LATIN AMERICA: BOTULINUM TOXINS MARKET, BY COUNTRY, 2023-2030 (USD MILLION)
- TABLE 105 LATIN AMERICA: BOTULINUM TOXINS MARKET, BY TYPE, 2023-2030 (USD MILLION)
- TABLE 106 LATIN AMERICA: BOTULINUM TOXINS MARKET, BY AGE GROUP, 2023-2030 (USD MILLION)
- TABLE 107 LATIN AMERICA: BOTULINUM TOXINS MARKET, BY APPLICATION, 2023-2030 (USD MILLION)
- TABLE 108 LATIN AMERICA: BOTULINUM TOXINS MARKET, BY END USER, 2023-2030 (USD MILLION)
- TABLE 109 LATIN AMERICA: KEY MACROINDICATORS
- TABLE 110 BRAZIL: NUMBER OF BOTULINUM TOXIN PROCEDURES, 2021-2023 (UNITS)
- TABLE 111 BRAZIL: BOTULINUM TOXINS MARKET, BY TYPE, 2023-2030 (USD MILLION)
- TABLE 112 MEXICO: NUMBER OF BOTULINUM TOXIN PROCEDURES, 2021-2023 (UNITS)
- TABLE 113 MEXICO: BOTULINUM TOXINS MARKET, BY TYPE, 2023-2030 (USD MILLION)
- TABLE 114 REST OF LATIN AMERICA: BOTULINUM TOXINS MARKET, BY TYPE, 2023-2030 (USD MILLION)
- TABLE 115 MIDDLE EAST & AFRICA: KEY MACROINDICATORS
- TABLE 116 MIDDLE EAST & AFRICA: BOTULINUM TOXINS MARKET, BY REGION, 2023-2030 (USD MILLION)
- TABLE 117 MIDDLE EAST & AFRICA: BOTULINUM TOXINS MARKET, BY TYPE, 2023-2030 (USD MILLION)
- TABLE 118 MIDDLE EAST & AFRICA: BOTULINUM TOXINS MARKET, BY AGE GROUP, 2023-2030 (USD MILLION)
- TABLE 119 MIDDLE EAST & AFRICA: BOTULINUM TOXINS MARKET, BY APPLICATION, 2023-2030 (USD MILLION)
- TABLE 120 MIDDLE EAST & AFRICA: BOTULINUM TOXINS MARKET, BY END USER, 2023-2030 (USD MILLION)
- TABLE 121 GCC COUNTRIES: BOTULINUM TOXINS MARKET, BY TYPE, 2023-2030 (USD MILLION)
- TABLE 122 REST OF MIDDLE EAST & AFRICA: BOTULINUM TOXINS MARKET, BY TYPE, 2023-2030 (USD MILLION)
- TABLE 123 OVERVIEW OF STRATEGIES DEPLOYED BY KEY PLAYERS IN BOTULINUM TOXINS MARKET, 2022-2025
- TABLE 124 BOTULINUM TOXINS MARKET: DEGREE OF COMPETITION
- TABLE 125 BOTULINUM TOXINS MARKET: REGION FOOTPRINT
- TABLE 126 BOTULINUM TOXINS MARKET: TYPE FOOTPRINT
- TABLE 127 BOTULINUM TOXINS MARKET: APPLICATION FOOTPRINT
- TABLE 128 BOTULINUM TOXINS MARKET: END-USER FOOTPRINT
- TABLE 129 BOTULINUM TOXINS MARKET: DETAILED LIST OF KEY STARTUPS/SME PLAYERS
- TABLE 130 BOTULINUM TOXINS MARKET: COMPETITIVE BENCHMARKING OF KEY STARTUPS/SME PLAYERS, BY TYPE AND REGION
- TABLE 131 BOTULINUM TOXINS MARKET: PRODUCT LAUNCHES & APPROVALS, JANUARY 2022-JUNE 2025
- TABLE 132 BOTULINUM TOXINS MARKET: DEALS, JANUARY 2022-JUNE 2025
- TABLE 133 BOTULINUM TOXINS MARKET: EXPANSIONS, JANUARY 2021-JUNE 2025
- TABLE 134 ABBVIE INC.: COMPANY OVERVIEW
- TABLE 135 ABBVIE INC.: PRODUCTS OFFERED
- TABLE 136 ABBVIE INC.: DEALS, JANUARY 2022-JUNE 2025
- TABLE 137 ABBVIE INC.: EXPANSIONS, JANUARY 2022-JUNE 2025
- TABLE 138 ABBVIE INC.: OTHER DEVELOPMENTS, JANUARY 2022-JUNE 2025
- TABLE 139 IPSEN BIOPHARMACEUTICALS, INC.: COMPANY OVERVIEW
- TABLE 140 IPSEN BIOPHARMACEUTICALS, INC.: PRODUCTS OFFERED
- TABLE 141 IPSEN BIOPHARMACEUTICALS, INC.: PRODUCT APPROVALS, JANUARY 2022-JUNE 2025
- TABLE 142 IPSEN BIOPHARMACEUTICALS, INC.: EXPANSIONS, JANUARY 2022-JUNE 2025
- TABLE 143 IPSEN BIOPHARMACEUTICALS, INC.: OTHER DEVELOPMENTS, JANUARY 2022-JUNE 2025
- TABLE 144 GALDERMA: COMPANY OVERVIEW
- TABLE 145 GALDERMA: PRODUCTS OFFERED
- TABLE 146 GALDERMA: PRODUCT LAUNCHES, JANUARY 2022-JUNE 2025
- TABLE 147 GALDERMA: DEALS, JANUARY 2022-JUNE 2025
- TABLE 148 GALDERMA: EXPANSIONS, JANUARY 2022-JUNE 2025
- TABLE 149 HUGEL, INC.: COMPANY OVERVIEW
- TABLE 150 HUGEL, INC.: PRODUCTS OFFERED
- TABLE 151 HUGEL, INC.: PRODUCT APPROVALS, JANUARY 2022-JUNE 2025
- TABLE 152 HUGEL, INC.: DEALS, JANUARY 2022-JUNE 2025
- TABLE 153 HUGEL, INC.: EXPANSIONS, JANUARY 2022-JUNE 2025
- TABLE 154 REVANCE: COMPANY OVERVIEW
- TABLE 155 REVANCE: PRODUCTS OFFERED
- TABLE 156 REVANCE: PRODUCT LAUNCHES & APPROVALS, JANUARY 2022-JUNE 2025
- TABLE 157 REVANCE: DEALS, JANUARY 2022-JUNE 2025
- TABLE 158 EVOLUS, INC.: COMPANY OVERVIEW
- TABLE 159 EVOLUS, INC.: PRODUCTS OFFERED
- TABLE 160 EVOLUS, INC.: PRODUCT LAUNCHES & APPROVALS, JANUARY 2022-JUNE 2025
- TABLE 161 EVOLUS, INC.: DEALS, JANUARY 2022-JUNE 2025
- TABLE 162 MEDYTOX: COMPANY OVERVIEW
- TABLE 163 MEDYTOX: PRODUCTS OFFERED
- TABLE 164 MEDYTOX: PRODUCT APPROVALS, JANUARY 2022-JUNE 2025
- TABLE 165 MEDYTOX: DEALS, JANUARY 2022-JUNE 2025
- TABLE 166 MERZ PHARMA: COMPANY OVERVIEW
- TABLE 167 MERZ PHARMA: PRODUCTS OFFERED
- TABLE 168 MERZ PHARMA: PRODUCT APPROVALS, JANUARY 2022-JUNE 2025
- TABLE 169 SUPERNUS PHARMACEUTICALS, INC.: COMPANY OVERVIEW
- TABLE 170 SUPERNUS PHARMACEUTICALS, INC.: PRODUCTS OFFERED
- TABLE 171 DAEWOONG PHARMACEUTICAL CO., LTD.: COMPANY OVERVIEW
- TABLE 172 DAEWOONG PHARMACEUTICAL CO., LTD.: PRODUCTS OFFERED
- TABLE 173 DAEWOONG PHARMACEUTICAL CO., LTD.: PRODUCT LAUNCHES & APPROVALS, JANUARY 2022-JUNE 2025
- TABLE 174 HUONS: COMPANY OVERVIEW
- TABLE 175 HUONS: PRODUCTS OFFERED
- TABLE 176 HUONS: PRODUCT LAUNCHES & APPROVALS, JANUARY 2022-JUNE 2025
- TABLE 177 EISAI CO., LTD.: COMPANY OVERVIEW
- TABLE 178 EISAI CO., LTD.: PRODUCTS OFFERED
- TABLE 179 HUGH SOURCE (INTERNATIONAL) LTD.: COMPANY OVERVIEW
- TABLE 180 HUGH SOURCE (INTERNATIONAL) LTD.: PRODUCTS OFFERED
- TABLE 181 DERMAX CO., LTD.: COMPANY OVERVIEW
- TABLE 182 GUFIC BIOSCIENCES: COMPANY OVERVIEW
- TABLE 183 OCEAN PHARMACEUTICAL: COMPANY OVERVIEW
- TABLE 184 CROMA-PHARMA GMBH: COMPANY OVERVIEW
- TABLE 185 MICROGEN: COMPANY OVERVIEW
- TABLE 186 JDBIO CO., LTD.: COMPANY OVERVIEW
- TABLE 187 CKD BIO: COMPANY OVERVIEW
- TABLE 188 ATRAZIST ARAY CO.: COMPANY OVERVIEW
- TABLE 189 GUANGZHOU AOMA BUSINESS CO., LTD.: COMPANY OVERVIEW
- TABLE 190 JETEMA CO., LTD.: COMPANY OVERVIEW
- TABLE 191 SINOPHARM GROUP CO., LTD.: COMPANY OVERVIEW
- TABLE 192 QUFU HANTANG BIOTECHNOLOGY CO., LTD.: COMPANY OVERVIEW
List of Figures
- FIGURE 1 BOTULINUM TOXINS MARKET SEGMENTATION & REGIONAL SCOPE
- FIGURE 2 BOTULINUM TOXINS MARKET: YEARS CONSIDERED
- FIGURE 3 BOTULINUM TOXINS MARKET: RESEARCH DATA
- FIGURE 4 BOTULINUM TOXINS MARKET: RESEARCH DESIGN
- FIGURE 5 BOTULINUM TOXINS MARKET: KEY SECONDARY SOURCES
- FIGURE 6 BOTULINUM TOXINS MARKET: KEY DATA FROM SECONDARY SOURCES
- FIGURE 7 BOTULINUM TOXINS MARKET: KEY PRIMARY SOURCES (DEMAND AND SUPPLY SIDES)
- FIGURE 8 BOTULINUM TOXINS MARKET: KEY SUPPLY- AND DEMAND-SIDE PARTICIPANTS
- FIGURE 9 BOTULINUM TOXINS MARKET: BREAKDOWN OF PRIMARY INTERVIEWS (BY COMPANY TYPE, DESIGNATION, AND REGION)
- FIGURE 10 BOTULINUM TOXINS MARKET: KEY INSIGHTS FROM PRIMARY EXPERTS
- FIGURE 11 RESEARCH METHODOLOGY: HYPOTHESIS BUILDING
- FIGURE 12 BOTULINUM TOXINS MARKET: COMPANY REVENUE ESTIMATION
- FIGURE 13 BOTULINUM TOXINS MARKET: END USER- AND REVENUE-MAPPING-BASED MARKET SIZE ESTIMATION METHODOLOGY
- FIGURE 14 BOTULINUM TOXINS MARKET: TOP-DOWN APPROACH
- FIGURE 15 GROWTH PROJECTIONS ON REVENUE IMPACT OF KEY MACROINDICATORS
- FIGURE 16 BOTULINUM TOXINS MARKET: DATA TRIANGULATION METHODOLOGY
- FIGURE 17 BOTULINUM TOXINS MARKET, BY PRODUCT, 2025 VS. 2030 (USD MILLION)
- FIGURE 18 BOTUINUM TOXINS MARKET, BY AGE GROUP, 2025 VS. 2030 (USD MILLION)
- FIGURE 19 BOTULINUM TOXINS MARKET, BY END USER, 2025 VS. 2030 (USD MILLION)
- FIGURE 20 BOTULINUM TOXINS MARKET: REGIONAL SNAPSHOT
- FIGURE 21 INCREASED AESTHETIC CONSCIOUSNESS AND HIGH DISPOSABLE INCOME TO DRIVE MARKET
- FIGURE 22 JAPAN AND THERAPEUTIC APPLICATIONS COMMANDED LARGEST MARKET SHARE IN 2024
- FIGURE 23 EMERGING MARKETS TO REGISTER HIGHER GROWTH RATES DURING STUDY PERIOD
- FIGURE 24 CHINA TO REGISTER HIGHEST CAGR FROM 2025 TO 2030
- FIGURE 25 BOTULINUM TOXINS MARKET: DRIVERS, RESTRAINTS, OPPORTUNITIES, AND CHALLENGES
- FIGURE 26 BOTULINUM TOXINS MARKET: TRENDS/DISRUPTIONS IMPACTING CUSTOMER'S BUSINESS
- FIGURE 27 AVERAGE SELLING PRICE TREND OF BOTULINUM TOXINS, BY KEY PLAYER, 2022-2024 (USD)
- FIGURE 28 AVERAGE SELLING PRICE TREND OF BOTULINUM TOXINS, BY REGION, 2022-2024 (USD)
- FIGURE 29 BOTULINUM TOXINS MARKET: VALUE CHAIN ANALYSIS
- FIGURE 30 BOTULINUM TOXINS MARKET: SUPPLY CHAIN ANALYSIS
- FIGURE 31 BOTULINUM TOXINS MARKET: ECOSYSTEM ANALYSIS
- FIGURE 32 BOTULINUM TOXINS MARKET: FUNDING AND NUMBER OF DEALS, 2019-2023 (USD MILLION)
- FIGURE 33 NUMBER OF DEALS IN BOTULINUM TOXINS MARKET, BY KEY PLAYER, 2019-2023
- FIGURE 34 VALUE OF DEALS IN BOTULINUM TOXINS MARKET, BY KEY PLAYER, 2019-2023 (USD)
- FIGURE 35 BOTULINUM TOXINS MARKET: TOP COMPANIES/APPLICANTS FOR BOTULINUM TOXIN PATENTS AND NUMBER OF PATENTS GRANTED, 2015-2025
- FIGURE 36 BOTULINUM TOXINS MARKET: IMPORT SCENARIO FOR HS CODE 300290, 2020-2024 (USD)
- FIGURE 37 BOTULINUM TOXINS MARKET: EXPORT SCENARIO FOR HS CODE 300290, 2020-2024 (USD)
- FIGURE 38 BOTULINUM TOXINS MARKET: PORTER'S FIVE FORCES ANALYSIS
- FIGURE 39 INFLUENCE OF KEY STAKEHOLDERS ON BUYING PROCESS OF BOTULINUM TOXINS, BY TYPE
- FIGURE 40 KEY BUYING CRITERIA OF BOTULINUM TOXINS, BY END USER
- FIGURE 41 KEY AI USE CASES IN BOTULINUM TOXINS MARKET
- FIGURE 42 NORTH AMERICA: BOTULINUM TOXINS MARKET SNAPSHOT
- FIGURE 43 ASIA PACIFIC: BOTULINUM TOXINS MARKET SNAPSHOT
- FIGURE 44 REVENUE ANALYSIS OF KEY PLAYERS IN BOTULINUM TOXINS MARKET, 2020-2024 (USD MILLION)
- FIGURE 45 MARKET SHARE ANALYSIS OF KEY PLAYERS IN BOTULINUM TOXINS MARKET (2024)
- FIGURE 46 MARKET RANKING OF KEY PLAYERS IN BOTULINUM TOXINS MARKET (2024)
- FIGURE 47 EV/EBITDA OF TOP THREE PLAYERS (2025)
- FIGURE 48 YEAR-TO-DATE (YTD) PRICE TOTAL RETURN AND 5-YEAR STOCK BETA OF TOP THREE PLAYERS (2025)
- FIGURE 49 BOTUNILUM TOXINS MARKET: BRAND/PRODUCT COMPARATIVE ANALYSIS
- FIGURE 50 BOTULINUM TOXINS MARKET: COMPANY EVALUATION MATRIX (KEY PLAYERS), 2024
- FIGURE 51 BOTULINUM TOXINS MARKET: COMPANY FOOTPRINT
- FIGURE 52 BOULINUM TOXIN MARKET: COMPANY EVALUATION MATRIX (STARTUPS/SMES), 2024
- FIGURE 53 ABBVIE INC.: COMPANY SNAPSHOT
- FIGURE 54 IPSEN BIOPHARMACEUTICALS, INC.: COMPANY SNAPSHOT
- FIGURE 55 GALDERMA: COMPANY SNAPSHOT
- FIGURE 56 HUGEL, INC.: COMPANY SNAPSHOT
- FIGURE 57 EVOLUS, INC.: COMPANY SNAPSHOT
- FIGURE 58 MEDYTOX: COMPANY SNAPSHOT
- FIGURE 59 SUPERNUS PHARMACEUTICALS, INC.: COMPANY SNAPSHOT
- FIGURE 60 HUONS: COMPANY SNAPSHOT
- FIGURE 61 EISAI CO., LTD.: COMPANY SNAPSHOT

